BTC/USD Analysis – 4H Interval (Sample Workflow)BTC/USD Analysis – 4H Interval (Sample Workflow)
Note: I do not have access to the exact 4H chart from your screenshot, so I will perform the analysis based on the current market situation and typical price zones and setups that are worth following (you can apply them to your chart in TradingView).
📊1. Support and resistance zones
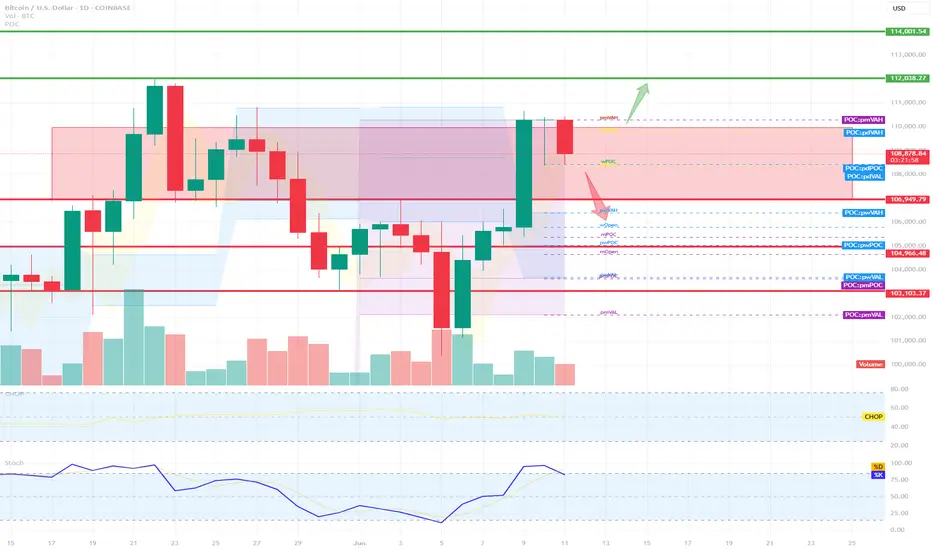
Resistance: 110,000 USD
(the last local peak and the place where a strong supply reaction was visible)
Support: 105,000 USD
(the place of the highest volumes and previous bounces, supported by POC levels from your screenshot)
Next support: 103,000 USD
(important level resulting from previous consolidations)
🔍2. Trend & Price Action
Direction: In the short term, the uptrend dominates (a series of higher lows and highs), but a stronger supply wick has appeared - a local pullback is possible.
Observe: Possible correction to the nearest support zones, rebound from POC/VAL/VAH levels.
Price channels: You can draw a rectangle (channel) between 107,000 and 110,000 as the current volatility range.
📌3. Indicators
Stochastic Oscillator: Close to the overbought zone (above 75) - a signal of a possible short-term pullback.
CHOP (Choppiness Index): Low - suggests that the market has just moved from consolidation to a trend (another strong movement after the correction may develop).
📊4. Candlestick structures
Last H4 candle: Long upper shadow (a possible signal of demand exhaustion).
Watch:
Reversal patterns (e.g. pinbar, engulfing) on support/resistance zones.
🧠5. Scenarios and levels to watch
Bull scenario
Breakout of resistance 110,000 USD → possible quick move to 112,000–114,000 USD.
Condition: Increased volume and closing of 4H candle above resistance.
Bearish scenario
Bounce from 110,000 USD and drop to 107,000 or 105,000 USD.
If 105,000 USD is broken, possible retest of 103,000 USD.
Supportzonen
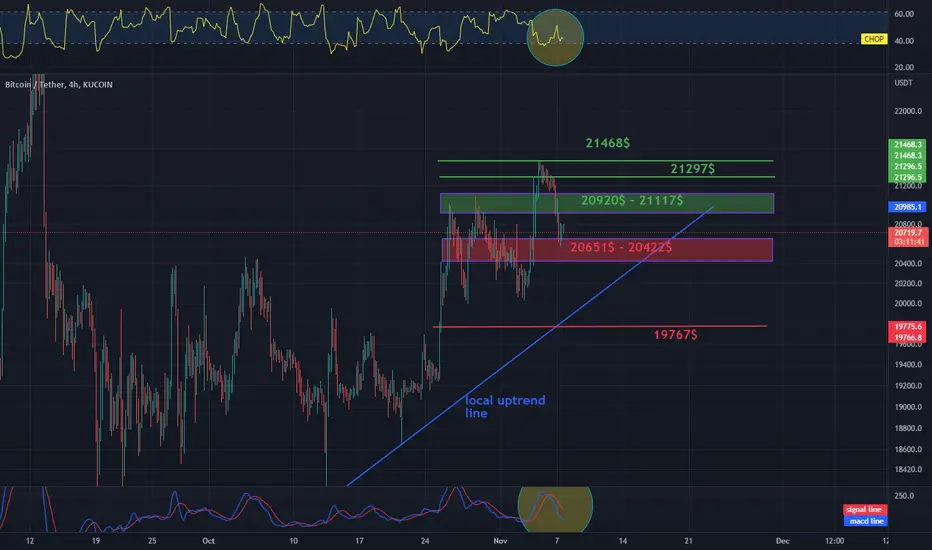
Daily review of BTC interval 4HHello everyone, I invite you to the BTC to USDT review for four hours and as you can see we are moving above the local uptrend line.
Looking at the next hours, maybe days we have a support zone from twenty thousand six hundred fifty one dollars to twenty thousand four hundred twenty two dollars, if this zone is broken the next support is at a price of nineteen thousand seven hundred sixty seven dollars.
Looking the other way, we have a resistance zone from twenty thousand nine hundred and twenty dollars to twenty one thousand one hundred and seventeen dollars, then we have resistance at twenty one thousand two hundred ninety seven dollars and twenty one thousand four hundred sixty eight dollars.
At the four-hour interval, the chop index indicates that the energy has been used and is slowly starting to increase, while the makdi indicator indicates a local downward trend.
Daily review of BTC interval 1DHello everyone, let's take a look at the BTC to USDT chart on a 1 day time frame. As you can see, the price is close to exiting the current downtrend channel.
Let's start by determining the support that the price has in the event of a further correction, and as you can see, we have a support zone from $ 18,979 to $ 18,123 in front of us.
Now let's move from the resistance line, as you can see, the first resistance is $ 19,222, if you can break it, the next resistance will be $ 19,899, the third resistance at $ 20,462 and the fourth resistance at $ 21,003.
Looking at the CHOP indicator, we can see that on the 1-day interval most of the energy has been used and the MACD indicator shows that the blue line is approaching the red crossing from below, which could confirm the upward trend shift.

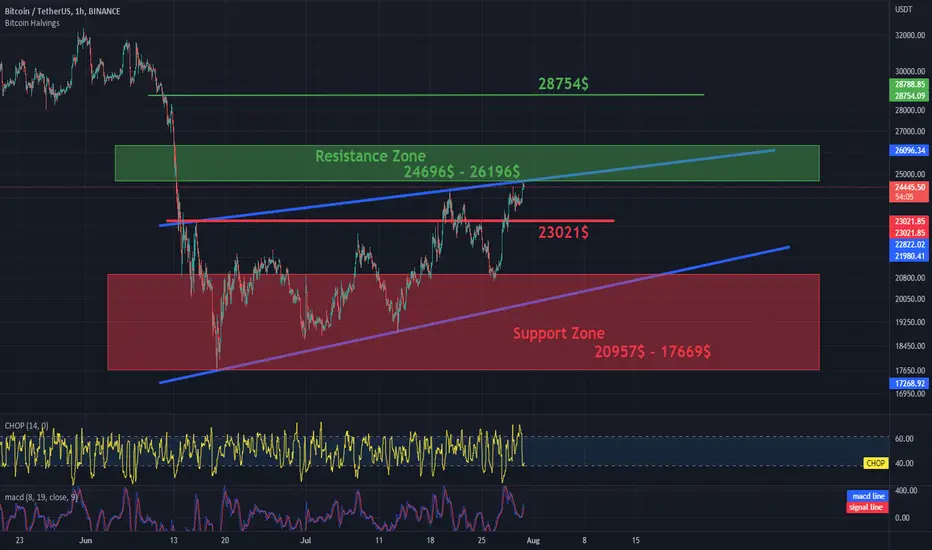
Will BTC come out of the current channel?Hi everyone.
Today we take a look at the BTC to USDT chart on a 1 hour time frame. We see an upward channel in which the price moves, and as you can see, we are currently at the upper end of our channel.
There is a resistance zone from $ 24,696 to $ 26,196 ahead of us to break, a break in this zone would result in an upward exit from the growth channel.
However, if the price starts to turn back, the first stronger support is at $ 23,021, and if it does not keep the price, we still have a support zone from $ 20,957 to $ 17,669.
It is worth paying attention to the CHOP indicator which shows that in a small interval the energy has been consumed, while the MACD indicator indicates a local upward trend.