Sushi - #sushi $sushidear friends
this is possible for this coin.
I think it'll have a pullback and then go up.
check for lower prices to enter.
Sushi
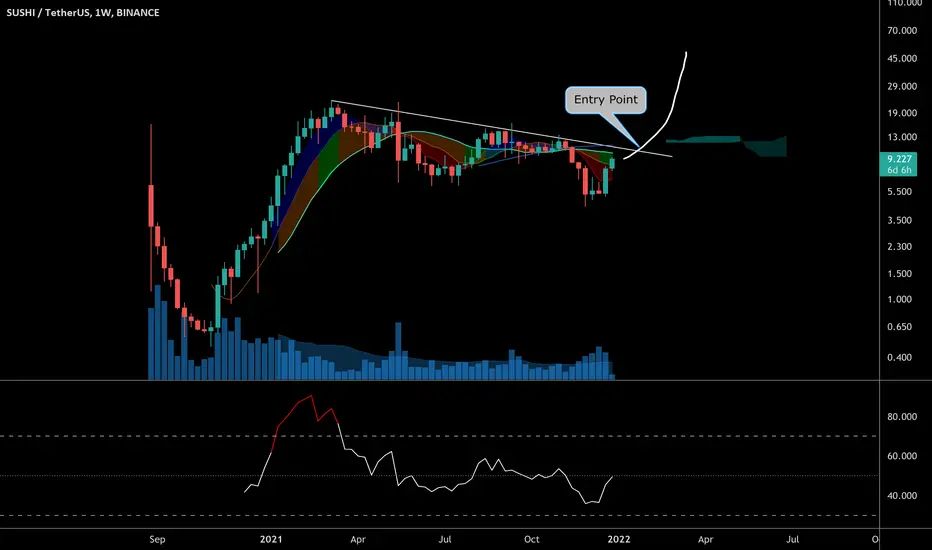
SUSHI Weekly Downtrend Turning BullishFalling wedge on weekly. Thinking we’ll break it next 2-3 weeks. If not just gotta ride the bounce again. Confirmed breakout level is probably around 10.50-11.00 IMO. Just speculating DYOR.
SUSHI/USDT: BullishHello everyone
This analysis is my personal opinion ,not a financial advice ,so do your own research.
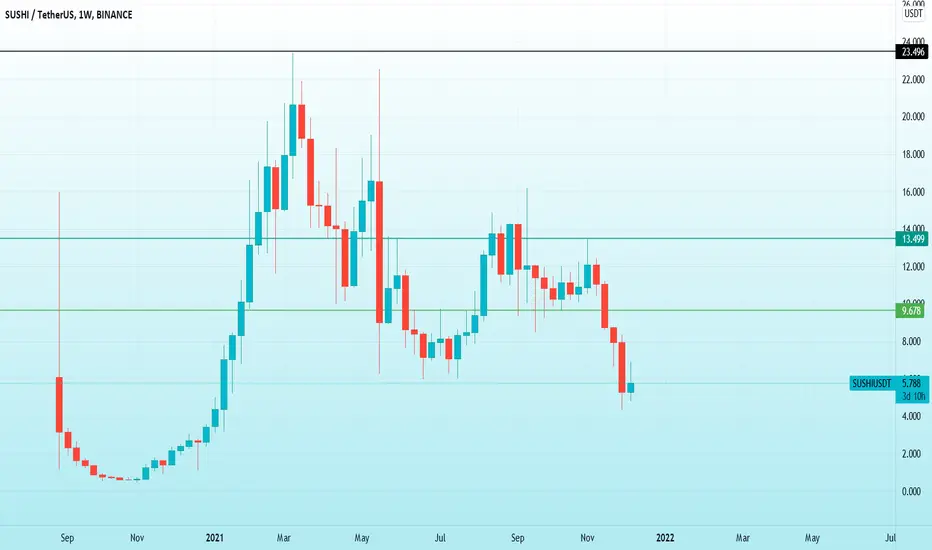
Sushi Can Recover After Long-Term CorrectionSUSHIBTC peaked in May 2021.
Here we are looking at Sushi's long-term chart since August 2020 on the weekly timeframe.
We can see that after May's price peak we had a long-term correction.
After hitting a low in late November, right below the 0.786 Fib. retracement level, we have some green candles.
Today SUSHIBTC is back above the 0.786 Fib. retracement support and also challenging the most important EMA10 level.
If SUSHIBTC can break and stay above 15,000 satoshis (0.00015000), we can expect additional growth.
The support we set it at the last low at 0.00010000.
Remember to build your own plan before you trade.
Good luck.
This is not financial advice.
Namaste.

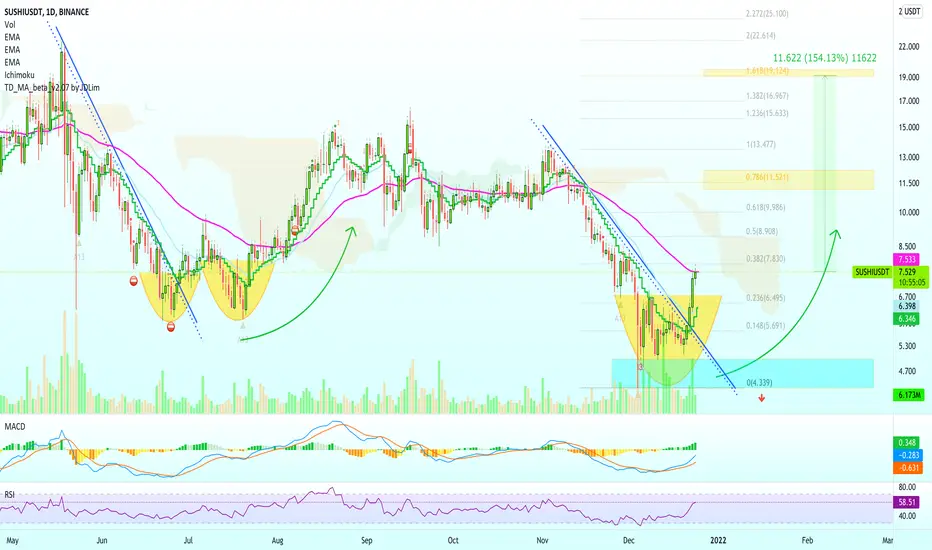
Sushi Can Grow 150%+ vs TetherWe can see the classic "cup pattern" on the SUSHIUSDT chart, this can signal that the trend is about to reverse.
As you can see on the left side, each time this bottom pattern shows up prices tend to grow.
We also have a broken downtrend as we all as increasing volume and bullish indicators (strong RSI).
All these signals support higher prices.
Note: There can be a retrace before higher prices as it happens with the cup & handle pattern.
The targets are marked on the chart.
This is not financial advice.
Namaste.
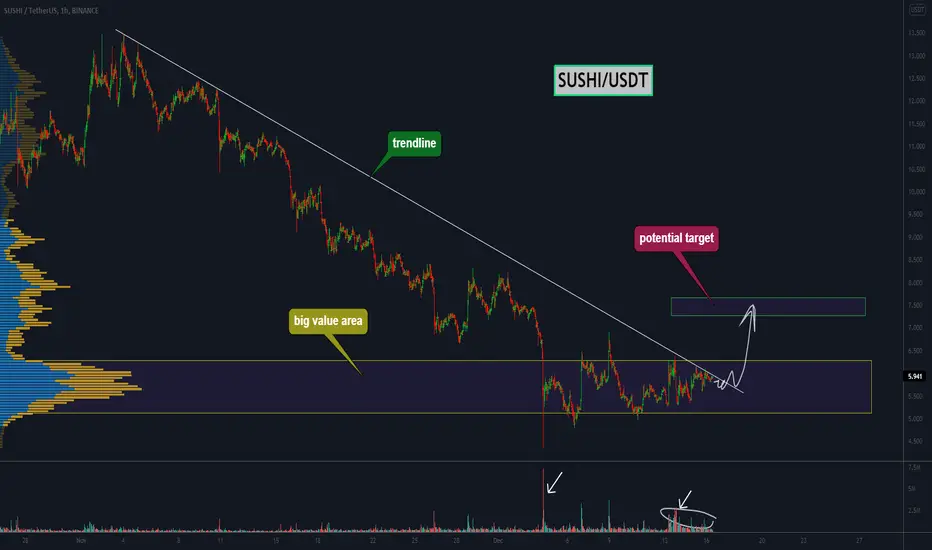
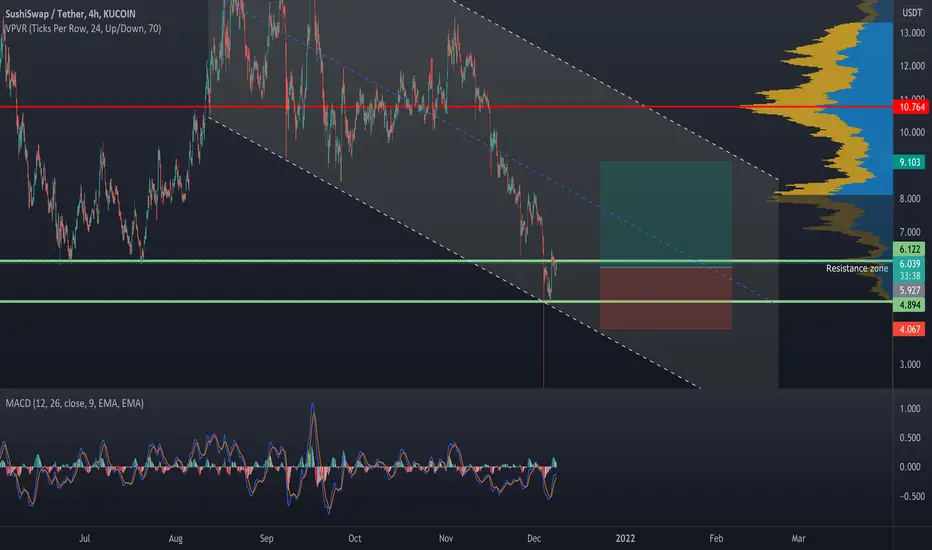
SUSHI - is going to break this trendline 👀SUSHI has been in a local downtrend for a long time. We now see the price in a trading range between $5 and $6.3 levels. It is very likely that big players are accumulating their positions here. The large volume at the bottom signals this as well. A breakdown of the trend line could be a good buying opportunity. In case the big value area is broken, there could be a trend reversal.
Write in the comments all your questions and instruments analysis of which you want to see.
Friends, push the like button, write a comment, and share with your mates - that would be the best THANK YOU.
P.S. I personally will open entry if the price will show it according to my strategy.
Always make your analysis before a trade.
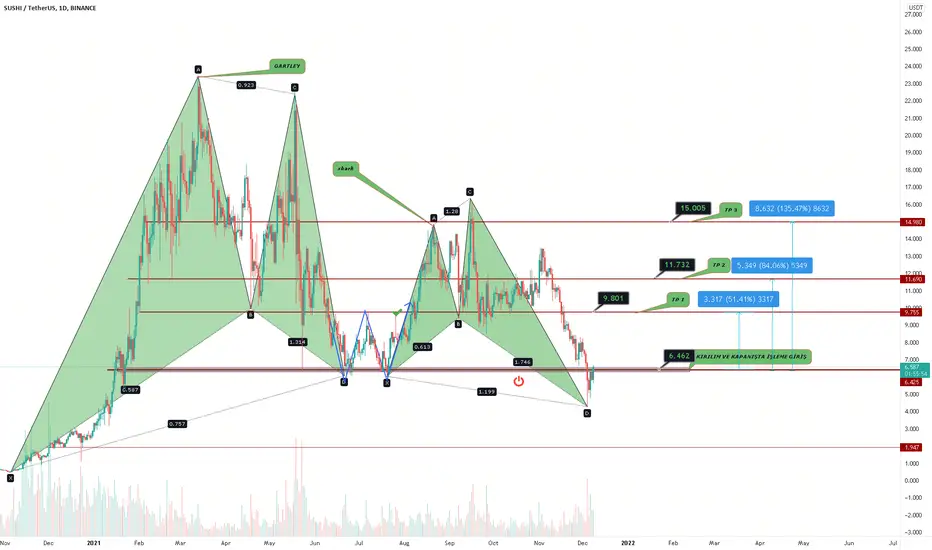
It Will Be Historical Move Of SushiSwap (SUSHI)Hi friends, hope you are well and welcome to the new update on SushiSwap (SUSHI).
broke out with bullish divergence:
On a daily time frame, the priceline of Sushi has broken out down channel with bullish divergence.
Big bullish Gartley:
On a weekly time frame, SUSHI has formed a bullish Gartley pattern.
In order to trade this pattern the targets can be as below:
Buy between: $8.04 to $5.96
Sell between: $11.16 to $14.45
Stop loss:
Stop loss can be set below the maximum extent of buying zone which is $5.96
Possible profit and loss ratio:
As per the above targets, this trade has a profit possibility of up to 142% and a loss possibility is 26%.
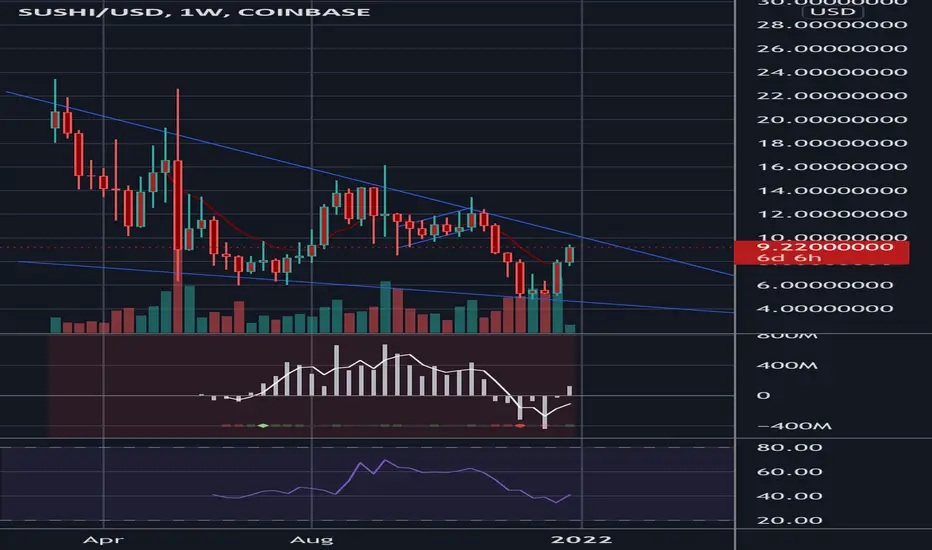
Big falling wedge:
On the same weekly time frame the priceline is also rising from the support of a big falling wedge pattern. The big bullish reversal Gartley move can become a big coz of breaking out this falling wedge and in case of breakout, wedge Sushi can start a massive rally for the long term.
Note: Above idea is for educational purpose only. It is advised to diversify and strictly follow the stop loss, and don't get stuck with the trade.
SUSHI possible setupSUSHI is looking to flip the resistance, making it a support.
If 12/21 EMA are doing a bullish crossover and we are bouncing from the new support, then i'm longing it
GL to all

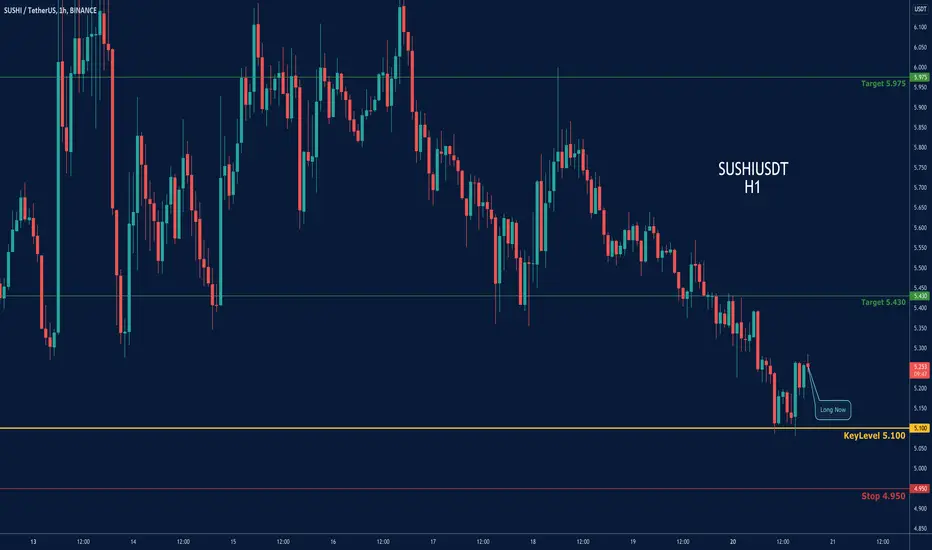
SUSHIUSDT-LONGThere is a long position in SUSHIUSDT SUSHI
SUSHIUSDT SUSHI
🔵Long Now or set on Key Level 5.100
🟢Target 1 5.430
🟢Target 2 5.975
❌Stop loss 4.950
#K_Level
SUSHI Long position, good R:R entry with potential futureSUSHI long position added in the dip yesterday at 5.38 leveraged long.
This looks a great area to add SUSHI for a long term hold. Wonderland.fi project is looking to acquire SUSHI which will bring huge volume of trading to the company.
Technically - SUSHI has fallen to solid resistance and buys below 5.5 offer a good R:R.
This chart abides by 2 of my main long term rules.
1. Buy when below the 100 and 200 SMA. - I've drawn around these areas on the chart, always offering a good R:R.
2. Buy at the bottom of resistances, not at the top of supports.

SUSHI BREAKOUT!Hi! this is my SUSHI/USDT set up for the upcoming week:)
Hope you will like it! if you have any feedback about the chart pls feel free to tell me:)
MY IDEA ONLY NOT A FINANCIAL ADVICE!!!
Love Yall :)

You can buy #SUSHI in Dip hereGood volume is being injected in this coin over recent period and also looking for Breakout. Can show a reversal here.
Entry : Around 5.9$
Targets : 6.6$,7.5$,8.8$,10$+
Stoploss : Daily close below 5$

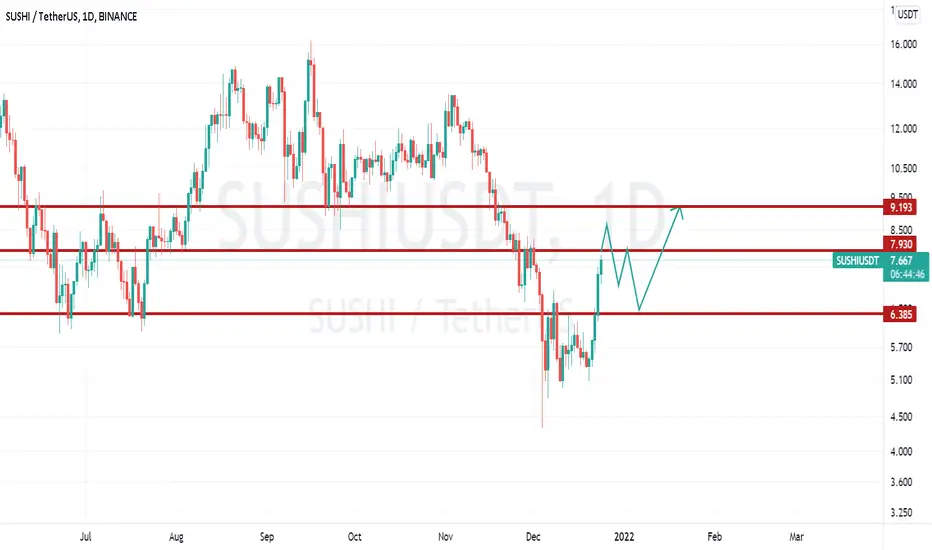
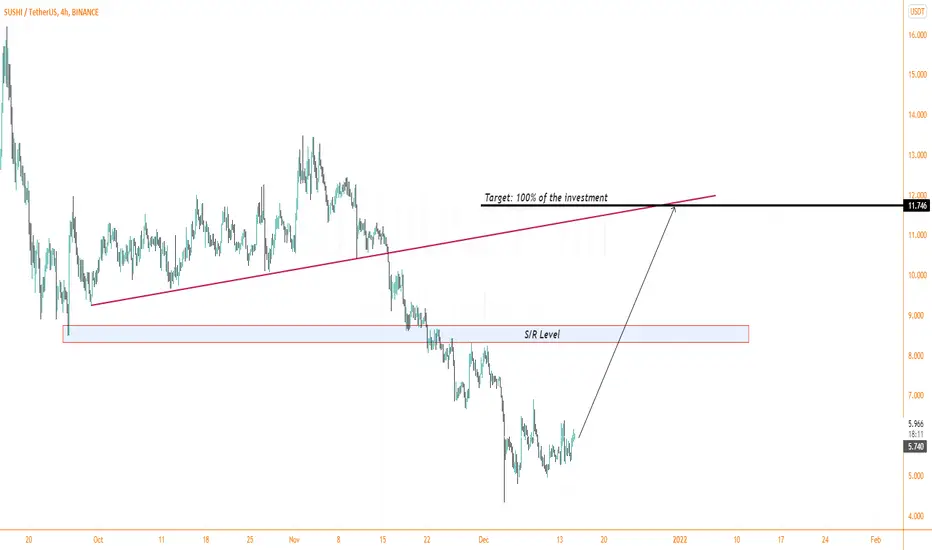
Good time to invest in SUSHIHello traders!
Sushi is forming Lower low>Lower High pattern since 3rd Nov, once it breaks any of the Lower High it will pump.
I am expecting at least 100% of the investment from Sushi within few weeks.
The S/R level in the middle will help the Sushi to push higher.
Don't forget to hit the like button and follow to stay conncted.
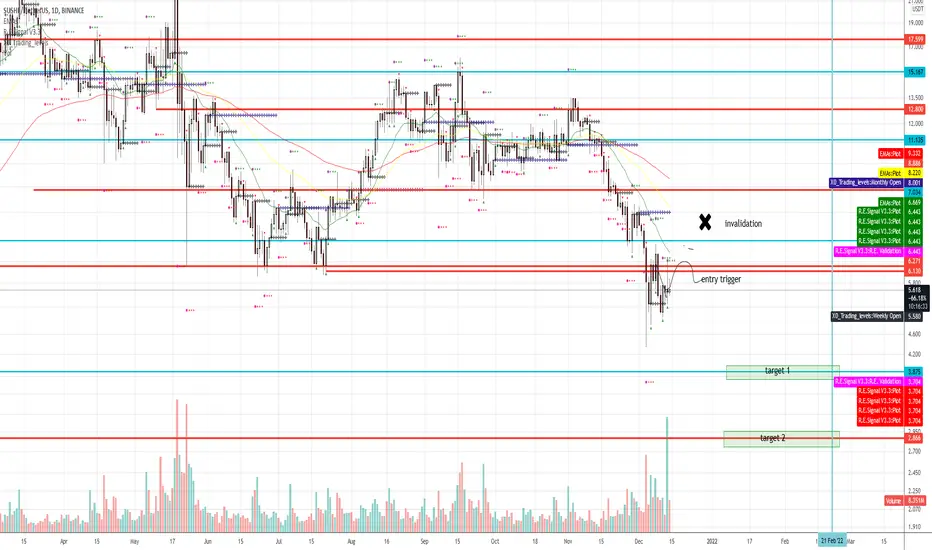
Short SUSHIUSDTShort SUSHIUSDT
I will entered this trade after a retest and break down of the previous support zone of and hold above resistance zone of the 6.30 area
Entry trigger 4H close below the 6.30
1st target 3.80 zone
2nd target 2.89 zone
Invalidation daily close above the 7.15
SUSHI - descending triangleclear descending triangle pattern and strong resistance at $5-$6, just looking at the price chart it feels like it won't go lower... well below its higher high and a strong triangle pattern, typical descending triangle breakout means UP
(don't trust me I'm n00b)

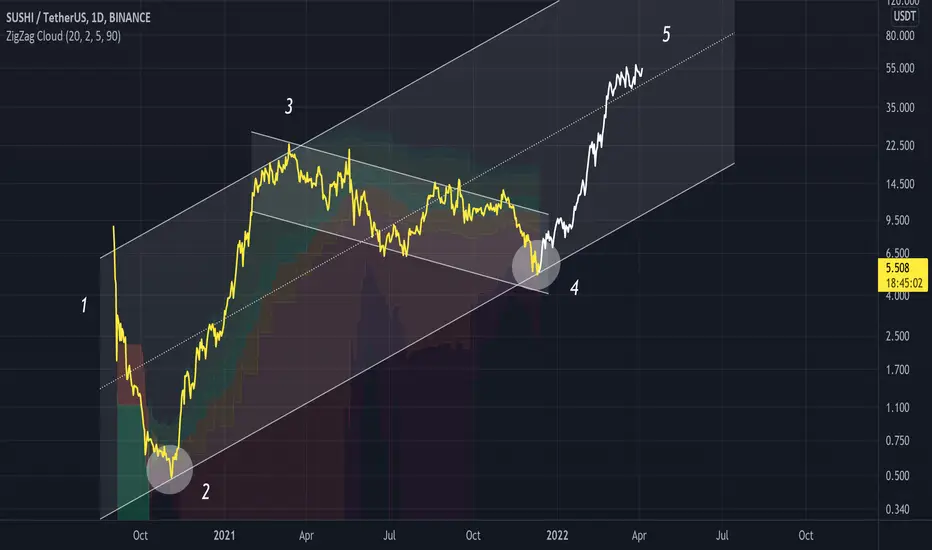
SUSHIUSD Potential Up Channel SUSHI has potentially bottomed, within the red zone of the cloud indicator
Using this we can plot an upward parallel channel with these two points
Im not sure if the 1,2,3,4,5 is correct Elliot wave, but it is a great way to visualise the price movement
Buy the dip scenario
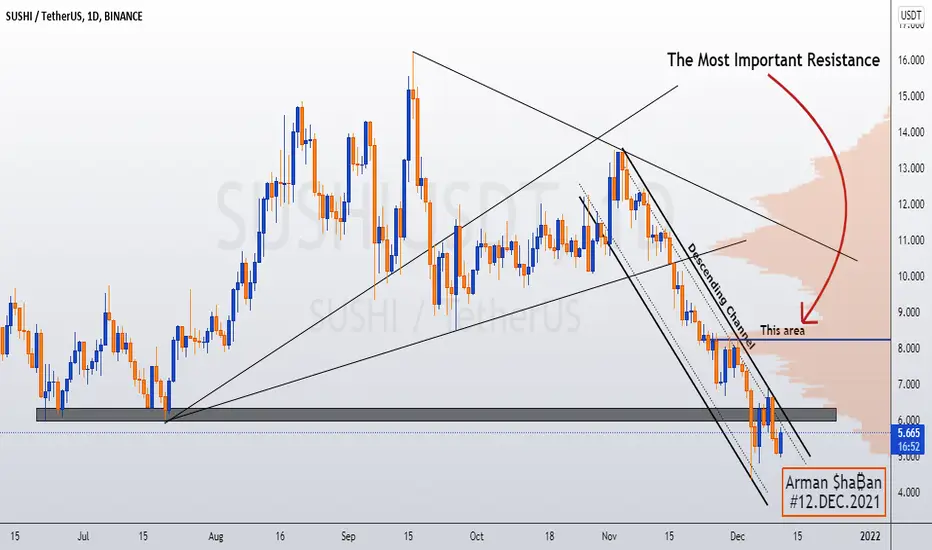
SUSHIUSDT : 12.12.2021 : $SUSHI The price is in an Potential Reversal Zone (PRZ) that we can enter the buying position if the downtrend breaks .
The targets will be as follows :
☑️ TP1 : 6.30$
☑️ TP2 : 6.91$
☑️ TP3 : 7.60$
☑️ TP4 : 8.25$ (Important Volumetric Resistance)
☑️ TP5 : 13.45$ (For Holders)
Follow our other analysis & Feel free to ask any questions you have, we are here to help.
⚠️ This Analysis will be updated ...
👤 Arman Shaban : @ArmanShabanTrading
📅 12.DEC.2021
⚠️(DYOR)
❤️ If you apperciate my work , Please like and comment , It Keeps me motivated to do better ❤️
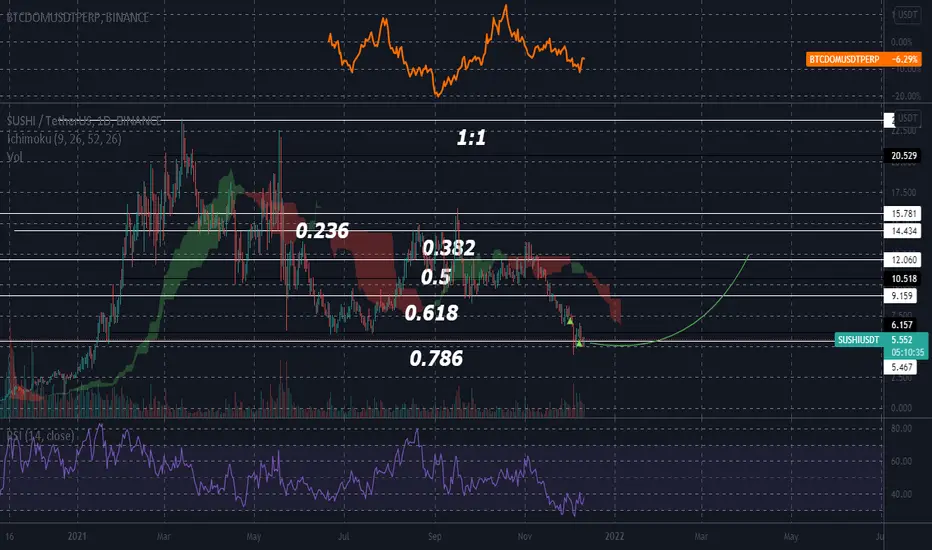
Sushi Update: Bear Greed will be PunishedSushi is still testing recent lows at the .786 fib retracement. BTC dom however is steadily decreasing meaning the chances of a breakout are better than ever. Altcoins have been getting absolutely destroyed recently and a relief rally is due to come.
SUSHIUSDT looks awsome in weekly chartbuy Sushi in two steps, one here one in 3.6 $ (most likely won't even come down to second step!)
the targets are on the chart (the last target and breaking ATH will take some weeks)
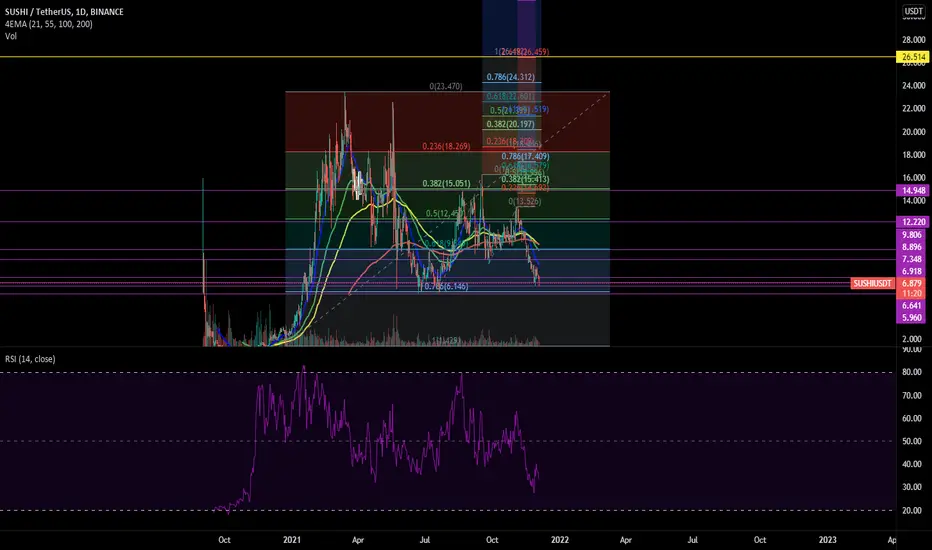
💡SUSHIUSDT ANALYSIS 💡Hello Friends
When we look at the chart in the daily, there is a shark bull formation formation.
It is very risky to enter the trade before the voluminous momentum comes. Risk money management is very important in such transactions.
There are technical levels on the chart.
TP1:9.8
TP2:11.73
TP3:15
Trading entry level: 6.46 (at the closing of the daily candle)
Stop loss: 4.86 (based on my own money management)
IT IS NOT INVESTMENT ADVICE. IF YOU
BENEFIT FROM ANALYSIS, DON'T FORGET
TO LIKE AND FOLLOW 👍👍👍👍 IF THERE IS SOMETHING WRONG WITH THE FORMATION, YOU CAN ALSO BE AWARE.
📗📗EDUCATIONAL PURPOSES📗📗
Bull Shark Pattern ( Bullish Shark Pattern)
EU foot, OX foot on the 113% - from 161.8%
prolong BC feet, OXI foot of extending to beyond the far 113'ü% OX foot
BCR foot of the AX 161.8% - is an extension 224'lük%
OTHER harmonic models on the contrary, transactions are entered as follows: Destinations can be 61.8% of BC with
incoming stops at 88.6% of entry OX and point C
SUSHIUSDTFrom this point now SUSHI can not go much more lower.
We are in a downtrend but could see some nice fast pullback even in this trend channel.
If it will break the channel upwards we can go much higher.
No financial advice.
Have a nice day!
SUSHI USDTTesting its lower support and Acting good there. We might see an bounce from here.
Target minimum is 12$
Expected TP HIT around 2-3 weeks.
Good point of entry below 7$
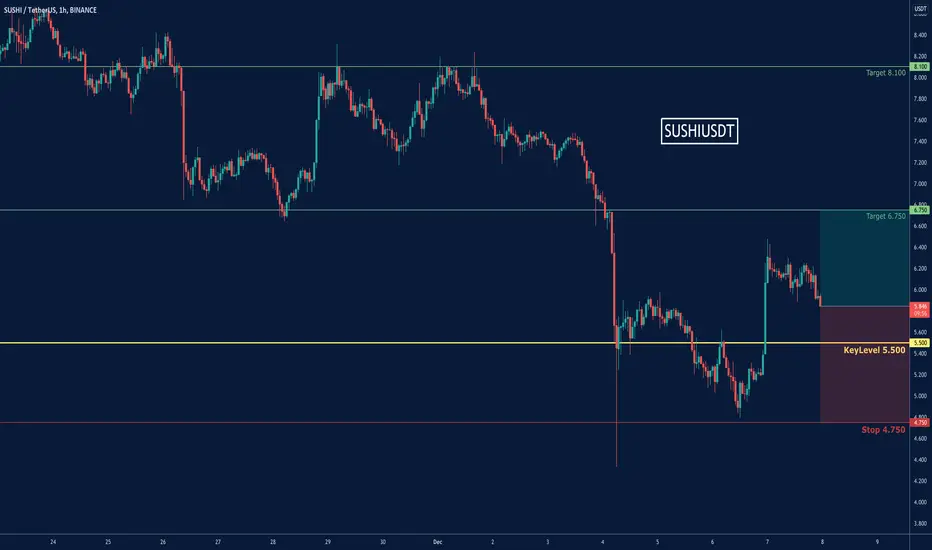
SUSHIUSDT-LONGThere is a long position in SUSHIUSDT Sushi Swap
SUSHIUSDT Sushi Swap
🔵Long Now or set on Key Level 5.500
🟢Target 1 6.750
🟢Target 2 8.100
❌Stop loss 4.750
#K_Level