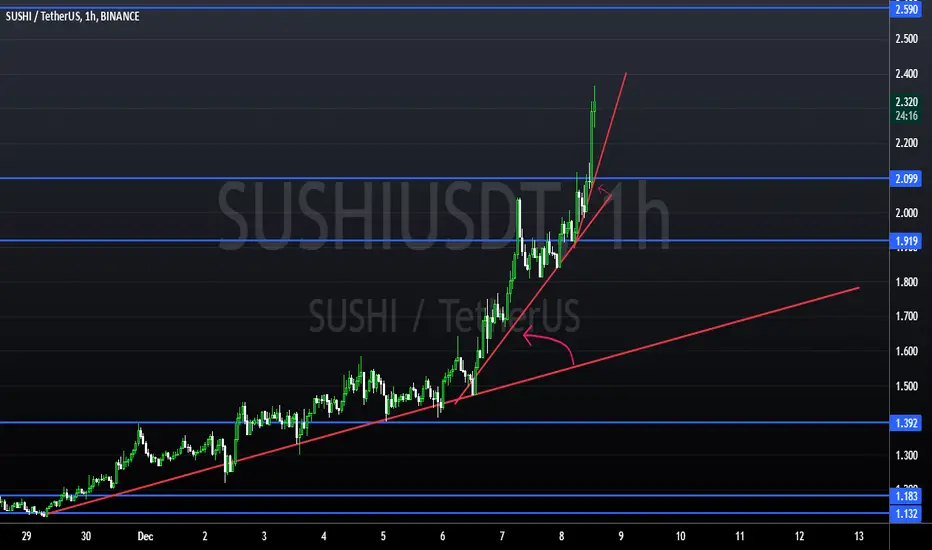
Break down of SUSHI on 1 hour candlesStructure and Price Action:
**Descending Triangle Resistance**:
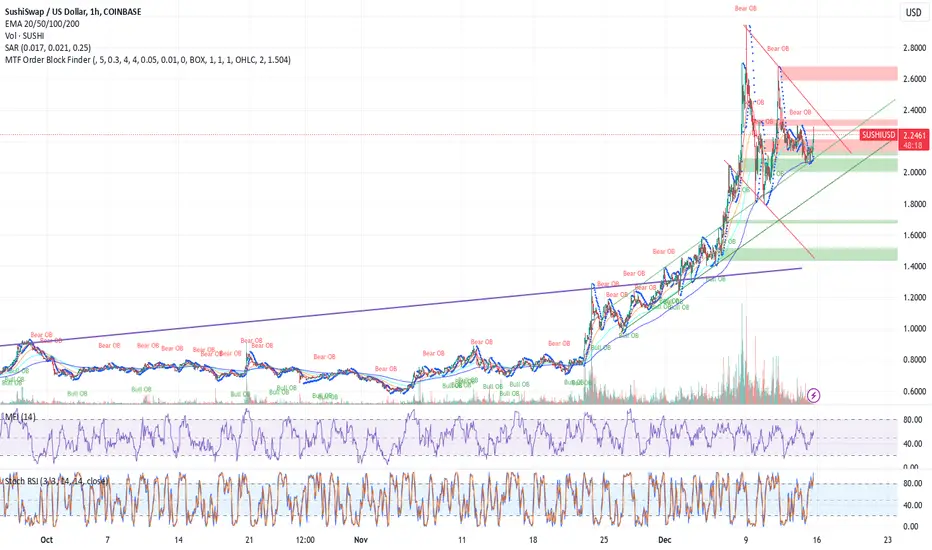
The chart shows price facing resistance along the **descending red trendline**, which forms the upper boundary of a **triangle pattern**. Sellers are consistently stepping in at lower highs.
**Ascending Support Line**:
The price is maintaining support along the green upward trendline, creating an **ascending triangle** structure. This suggests a potential breakout if buying pressure sustains.
**Key Consolidation Zone**:
Price is consolidating between **$2.10** and **$2.40**, with clear attempts to break resistance. The consolidation indicates indecision but also a build-up for a larger move.
**Retest of Order Blocks**:
Multiple **bullish order blocks** at $2.10–$2.00 have held as support, reinforcing buyer strength.
Support and Resistance:
**Immediate Resistance**: $2.40 (descending red trendline and prior swing high).
**Key Support Levels**:
$2.10: Primary ascending support line.
$2.00: Strong structural support aligned with bullish order blocks.
$1.80–$1.60: Secondary green support zone below the ascending trendline.
Indicators:
Moving Averages (EMA 20/50/100/200):
Price is above the **EMA 20** ($2.15) and **EMA 50** ($2.16), confirming short-term bullish bias.
The **EMA 100** ($2.08) and **EMA 200** ($2.07) are closely aligned, providing a strong support base if price pulls back.
Money Flow Index (MFI):
MFI is at **60.21**, showing moderate bullish momentum with room for price to move higher before overbought conditions are reached.
Stochastic RSI:
The Stochastic RSI is currently near **overbought territory** (100.00 and 99.89), suggesting a short-term pullback may occur if resistance holds.
However, sustained buying pressure could keep the Stochastic RSI elevated.
Volume:
Volume remains stable but has declined slightly during consolidation, suggesting indecision.
A volume spike on a breakout or breakdown will confirm the next move.
Pattern Analysis:
The **ascending triangle** pattern suggests bullish continuation, provided price breaks above the descending red trendline at $2.40.
Failure to break resistance could lead to a test of lower supports around $2.10 or $2.00.
Probabilistic Outlook:
Bullish Breakout (Primary Scenario):
If price breaks above $2.40 with strong volume, the ascending triangle confirms bullish continuation.
Key upside targets:
**First Target**: $2.60–$2.65 (next major resistance zone).
**Second Target**: $2.80–$3.00 (psychological and prior highs).
Bearish Breakdown (Alternate Scenario):
If price loses support at $2.10 and $2.00, bearish momentum could build.
Key downside targets:
**First Target**: $1.80 (green support zone).
**Second Target**: $1.60 (historical support and bullish order block).
Key Signals to Watch:
A breakout above $2.40 with rising volume = **Bullish continuation**.
A breakdown below $2.10 = **Bearish reversal confirmation**.
Monitor volume during any breakout or breakdown for validation.
Conclusion:
The chart is consolidating within an **ascending triangle**, with price facing resistance at $2.40. The overall structure remains bullish, and a breakout above $2.40 could lead to further upside toward $2.60–$2.80. However, failure to break resistance may result in a pullback toward $2.10 or $2.00 before the next directional move.
Sushi
sushi idea"🌟 Welcome to Golden Candle! 🌟
We're a team of 📈 passionate traders 📉 who love sharing our 🔍 technical analysis insights 🔎 with the TradingView community. 🌎
Our goal is to provide 💡 valuable perspectives 💡 on market trends and patterns, but 🚫 please note that our analyses are not intended as buy or sell recommendations. 🚫
Instead, they reflect our own 💭 personal attitudes and thoughts. 💭
Follow along and 📚 learn 📚 from our analyses! 📊💡"
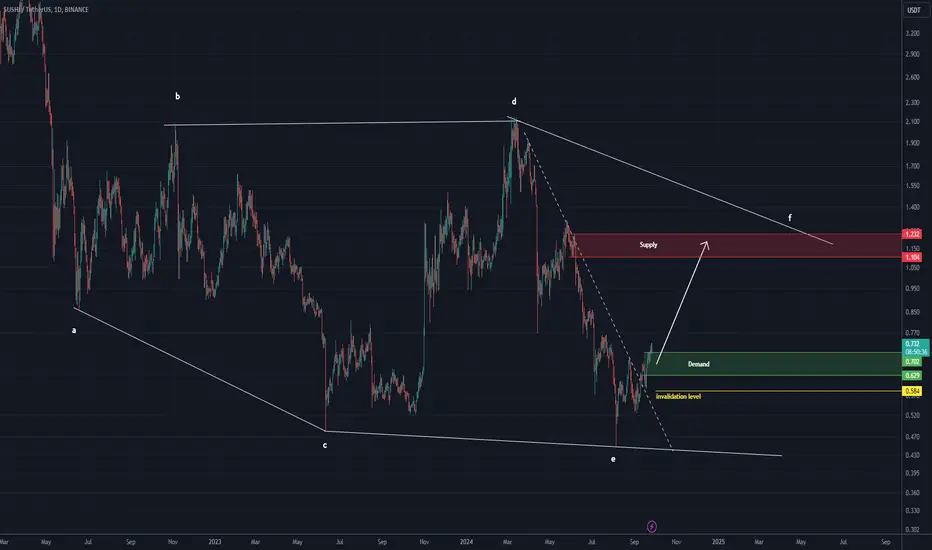
Alikze »» SUSHI | Reverse head and shoulders pattern🔍 Technical analysis: Reverse Head and Shoulders Pattern - Reversal Motivational Wave
- According to the analysis presented before , after filling the FVG gap, wave 3 continued up to the 0.47 range of the 100 Fibo zone.
- After creating demand in the range of 100 Fibo, it has encountered a motivational wave.
- It is currently in an uptrend, which has faced a temporary correction after breaking the supply zone.
Due to the upward trend, it can encounter the bottom of the channel and meet the demand again and continue its upward trend until the next supply area.
- This upward trend can continue in the range of 1.56.
💎 Therefore, by breaking the supply area (red box) and after pulling back to it, it can continue its ascent to the next supply area.
⚠️ Note: In addition, if this modification touches the "Invalidation LVL" area, the ascending scenario will be invalidated. ⚠️
»»»«««»»»«««»»»«««
Please support this idea with a LIKE and COMMENT if you find it useful and Click "Follow" on our profile if you'd like these trade ideas delivered straight to your email in the future.
Thanks for your continued support.
Best Regards,❤️
Alikze.
»»»«««»»»«««»»»«««
BINANCE:SUSHIUSDT

Sushiswap Sushi price analysis🍣 Fresh CRYPTOCAP:SUSHI has been brought to the market, but you need to buy it at a good price and more on that later!)
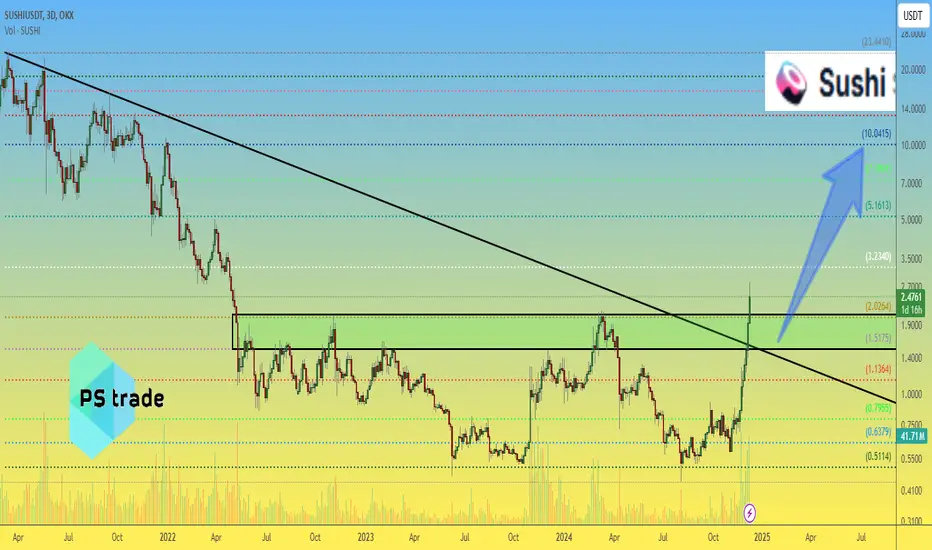
Only the 4th time, for the first time in 2.5 years, OKX:SUSHIUSDT price managed to break above $2
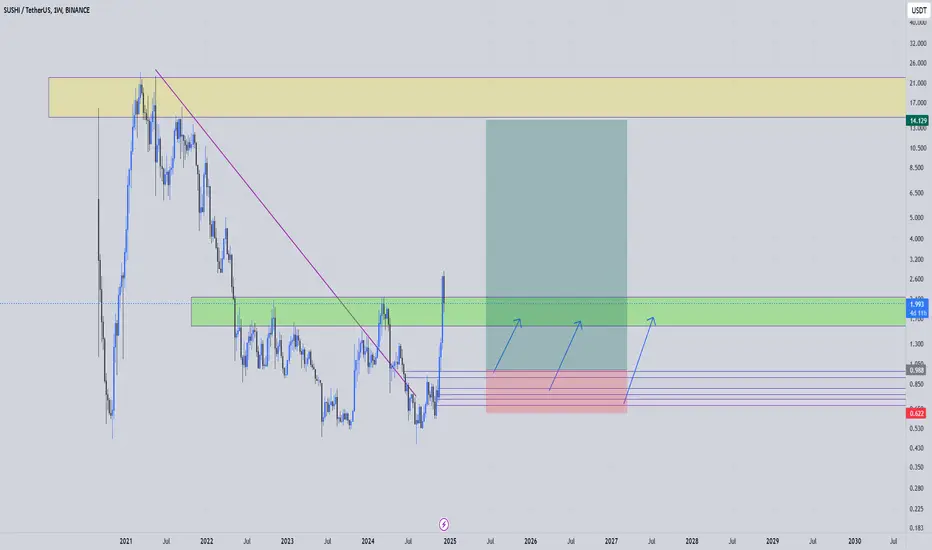
1️⃣Now the main thing is to wait for confirmation of the breakout and the strength of buyers. That is, we need to wait for the price of the #Sushiswap token to firmly establish itself in the range of $1.50-2 and not fall below it.
2️⃣If this condition is met, the prospects for continued growth to $10 will open up, where selling one #Sushi will allow you to buy a whole roll set :)
_____________________
Did you like our analysis? Leave a comment, like, and follow to get more
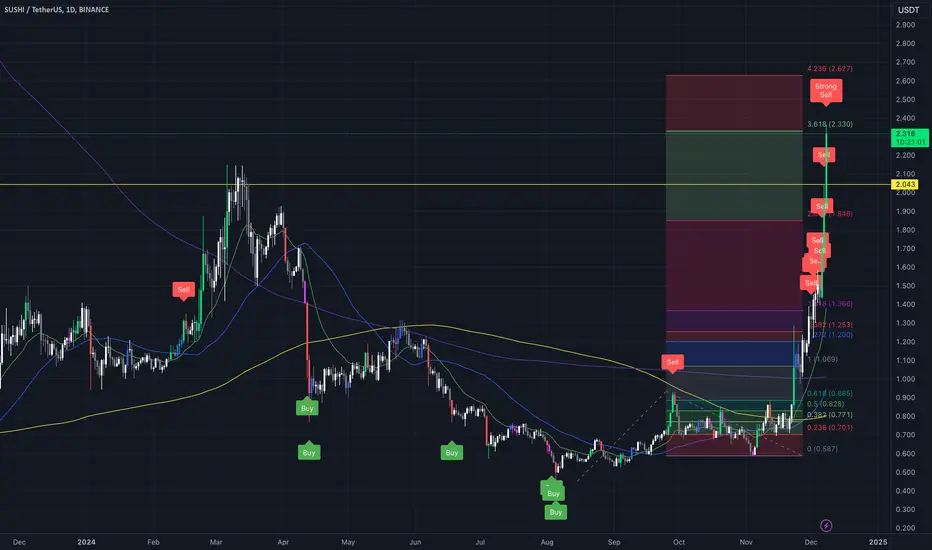
Sushi has reached my targetSushi has hit the target at the 3.618 Fibonacci level.
If you're in the trade, consider adjusting your stop loss to $2.239.
Should Sushi begin to retrace, it may find support around $2.05.
I remain bullish on Sushi, but we might see some downside or consolidation before it moves higher.
DYOR
SUSHI Ready for the big JUMP? SUSHI
Ready for a big move.
The momentum slope in the chart is increasing, indicating that the buying power is strengthening and effectively eliminating the sellers.
If you haven't been following SUSHI so far, you can monitor its progress after it breaks the resistance at 2.590 . For the short-term timeframe, a rise to the resistance box between 4.500 and 5 dollars is reasonable. However, for the long term, SUSHI needs to reach the range of 4 to 4.5.
Again, it is remembered that all trades that are opened are your responsibility
Don't forget to follow.
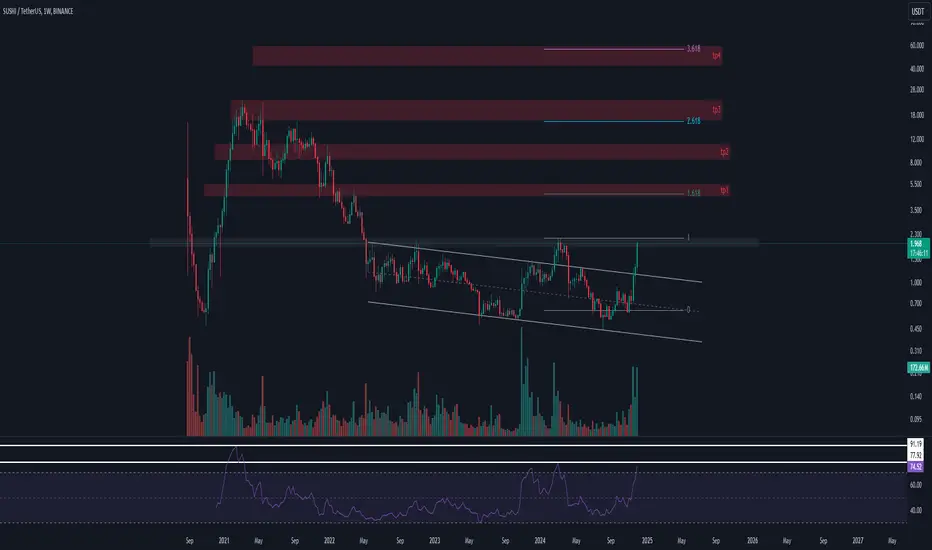
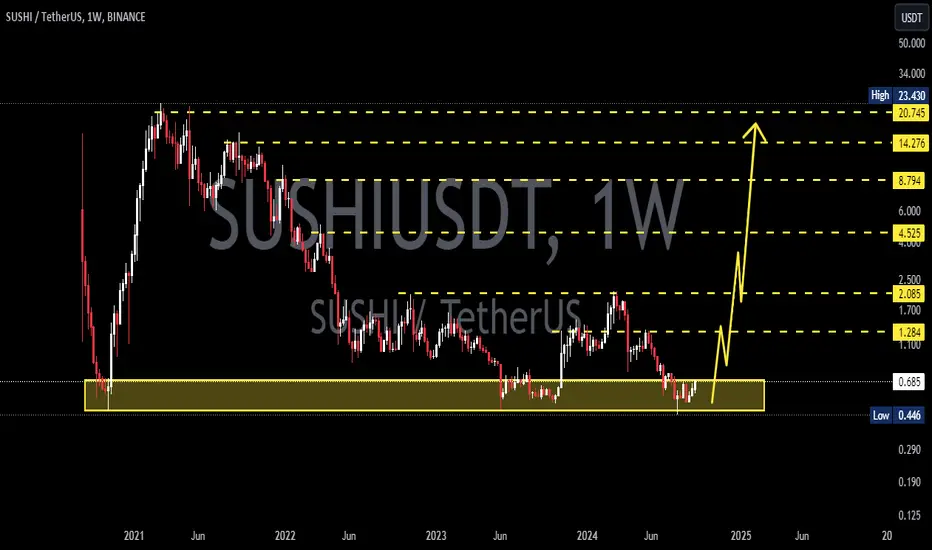
SushiSwap (SUSHI)📊 SUSHI Analysis
🔹 General Overview:
SUSHI coin managed to break out of its descending channel from the top and reach its weekly timeframe resistance. This resistance could lead to a price correction. The RSI has entered the overbought zone, but another significant resistance still lies ahead.
🔹 Weekly Timeframe Analysis:
If the price manages to break the white weekly resistance zone, it could trigger a sharp move towards the Fibonacci targets:
1.618
2.618
3.618
🔹 Investment Recommendation:
✅ We recommend a laddered entry strategy for investing in this cryptocurrency:
One entry at the current market price.
Another entry if the price corrects downward.
A final entry if the weekly resistance is broken.
🔹 Long-Term Outlook:
Given SUSHI's functionality and low market cap, it has the potential to revisit its previous all-time high. However, gradual profit-taking in the red zones is essential.
🔹 Additional Notes:
1️⃣ Volume Analysis:
An increase in trading volume near the weekly resistance could indicate strong buying pressure. If the breakout is accompanied by high volume, the likelihood of a sharp move increases.
2️⃣ Price Behavior During Correction:
During a correction, observe whether the price drops slowly with low volume or quickly with high volume. A slow correction often signals accumulation by buyers.
3️⃣ Impact of Overall Market (BTC & ETH):
The general market condition, especially Bitcoin and Ethereum trends, heavily influence smaller coins like SUSHI. Ensure the overall market trend is positive.
4️⃣ Timing Investments:
Given the likelihood of a correction near resistance, avoid rushing in. The proposed laddered entry strategy can help mitigate risks.
5️⃣ Monitoring SUSHI's Fundamentals:
Stay updated on SUSHI’s protocol upgrades, new partnerships, or management changes, as these can significantly influence price trends.
💡 Conclusion:
Stay in the game with proper risk and capital management.
#SUSHI/USDT#SUSHI
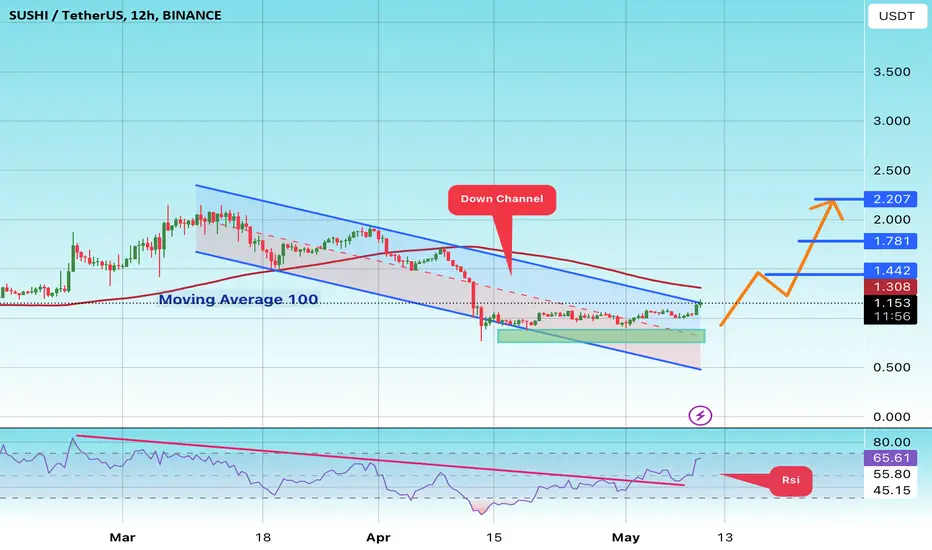
We have a bearish channel pattern on a 12-hour frame, the price moves within it, adheres to its limits well, and is expected to break it upwards strongly.
We have a support area at the lower border of the channel at $0.800 from which the price rebounded
We have a tendency to stabilize above moving average 100
We have a downtrend on the RSI indicator that is about to break higher, supporting the price higher
Entry price is 1.10
The first goal is 1.44
The second goal is 1.78
the third goal is 2.20
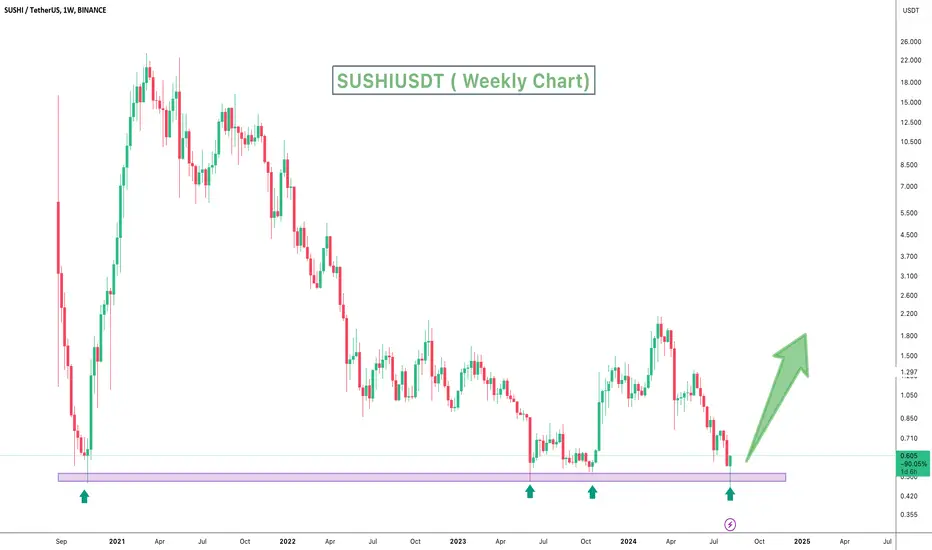
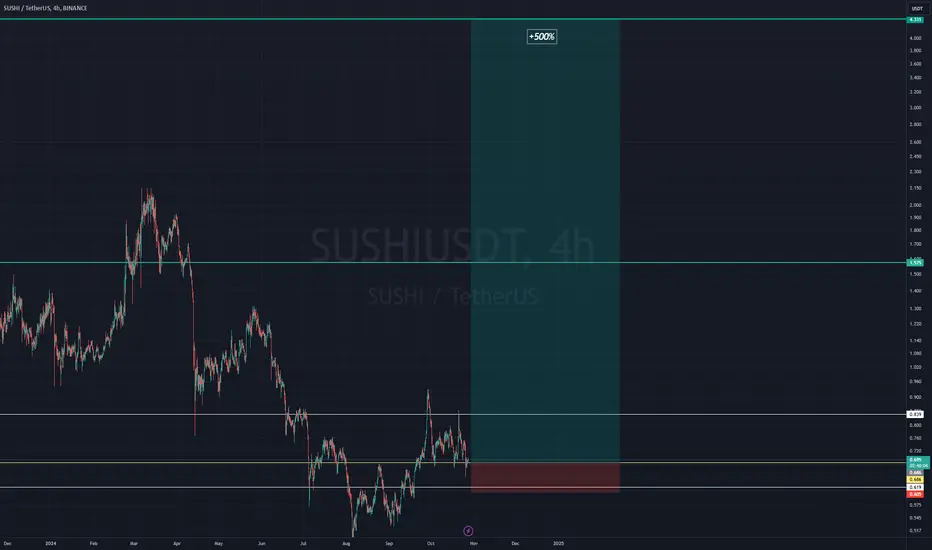
SUSHIUSDT Reversing from Major SupportSUSHIUSDT technical analysis update
SUSHI's price touched its major yearly support level this week, a zone it has bounced back from multiple times over the last four years. We can expect a bounce from this support level again.
Stop Loss: $0.45
Target :100%-300%
regards
Hexa
Alikze »» W | Ascending channel - 1D🔍 Technical analysis: Ascending channel - 1D
- It has been moving in a downward channel on the daily time frame
- After breaking the short-term downward channel, it is currently moving in an upward channel
- According to the momentum at the top of the channel, it can exit the channel with a pullback to the broken structure and continue its growth up to the first supply range as wide as the channel.
- In the future, it can continue its growth by breaking the first supply area to the second supply area.
💎 Alternative scenario: In addition, if the green box area is broken, it can go down with a pullback to the 0.1709 range.
»»»«««»»»«««»»»«««
Please support this idea with a LIKE and COMMENT if you find it useful and Click "Follow" on our profile if you'd like these trade ideas delivered straight to your email in the future.
Thanks for your continued support.
Best Regards,❤️
Alikze.
»»»«««»»»«««»»»«««
BINANCE:WUSDT

Buy now and lean into the trend. SushiAnticipation is building as resistance levels fade. This moment calls for action—buy now and lean into the trend. 📈 True progress in trading and in life is about making the right decisions, not just the quick ones. Let’s move forward with purpose and patience.
SUSHIAfter an impressive rise, sushi entered a corrective wave. Now, it seems the corrective wave ended at 0.786 Fibonacci retracement and price is oscillating in a consolidation box. Also notice the downtrend line. When these two break, the next uptrend impulse wave will start.
Alikze »»CAKE | Reverse head and shoulders pattern🔍 Technical analysis: Reverse head and shoulders pattern
- In the previous analysis , it was mentioned that a head and shoulders pattern was formed, that the last correction log can extend to the range of 1.17.
- As mentioned, it is moving in a descending channel.
- Demand was met at the bottom of the descending channel and the range, which experienced a growth up to the top of the channel and the broken zone.
- Currently, in weekly and daily time, in addition to the descending channel, it is in a concentration.
- In addition, it is suspected that the head and shoulder pattern is the opposite. Therefore, I expect it to advance to the supply zone after the last bearish leg and the right shoulder are completed, out of congestion.
💎 Note: It is necessary to explain that the right shoulder should not be extended to the previous area, in which case the alternative scenario should be checked and the post updated.
»»»«««»»»«««»»»«««
Please support this idea with a LIKE and COMMENT if you find it useful and Click "Follow" on our profile if you'd like these trade ideas delivered straight to your email in the future.
Thanks for your continued support.
Best Regards,❤️
Alikze.
»»»«««»»»«««»»»«««
BINANCE:CAKEUSDT

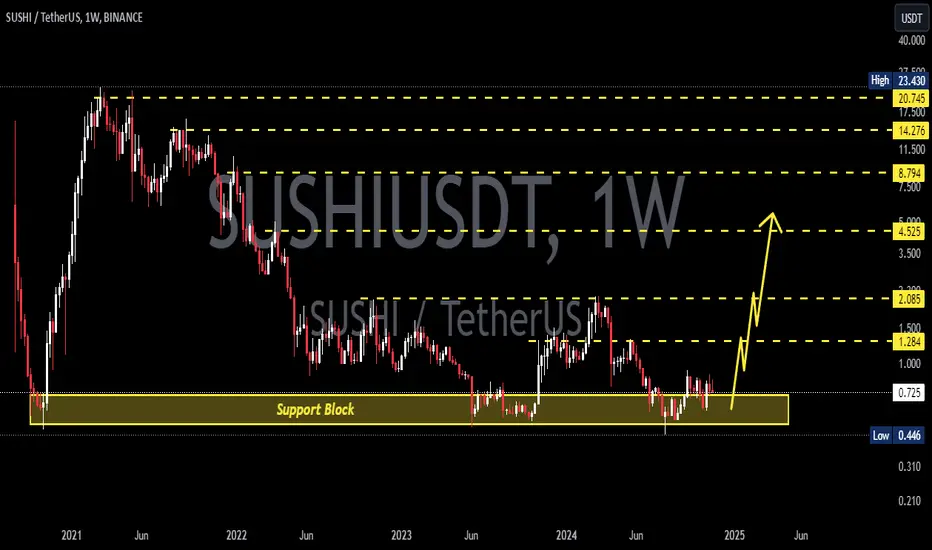
SUSHIUSDT 1WSUSHI ~ 1W
#SUSHI If you still have Conviction on the coin,. You need to pay attention to these support blocks,. So far this support Block continues to hold the price. Buy in stages and target at least 20%++
Alikze »» ARB | Expanded flat modification🔍 Technical analysis: Expanded flat modification
- It is moving in a downward channel in the weekly and daily time frame.
- The current corrective structure is completing a full 5-wave cycle.
- According to the structure, an expanded flat is being formed.
- This correction can enter an upward trend in the current area or a value lower in the range of 0.39 with the confirmation of the return, which can conquer and cross its previous major ceiling.
But in the short time frame of 12H, two behavioral scenarios can be considered to continue the process.
💎 Scenario 1: Keeping the green box, have a return to the neckline range.
💎 The second scenario: or if the green box area breaks, it will continue the downward correction to the range of 0.39.
»»»«««»»»«««»»»«««
Please support this idea with a LIKE and COMMENT if you find it useful and Click "Follow" on our profile if you'd like these trade ideas delivered straight to your email in the future.
Thanks for your continued support.
Best Regards,❤️
Alikze.
»»»«««»»»«««»»»«««
BINANCE:ARBUSDT

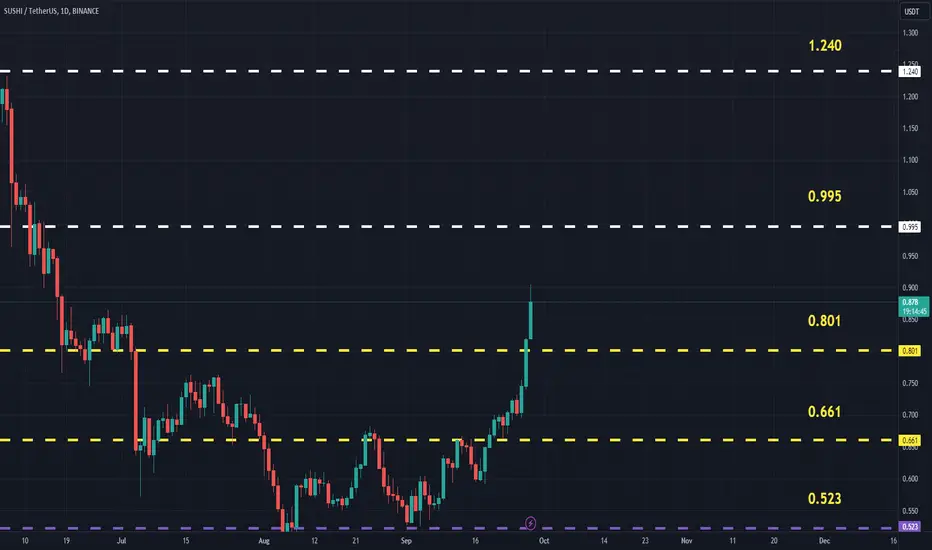
SUSHIUSDT (SushiSwap) Updated till 28-09-24SUSHIUSDT (SushiSwap) Daily timeframe range. we can see a smooth move here. within this volume its not hard to reach 0.995. even if there is a break staying above 0.801 will push it again but needs to stay above that. local support at 0.661.
SUSHI ROADMAP (1D)From where we placed the red arrow on the chart, it seems that the SUSHI correction has started.
Sahih seems to be a diametric that we are now at the beginning of wave E. Wave E is bullish.
It can move towards the targets on the chart while maintaining the green range.
The targets are listed on the chart.
Closing a daily candle below the invalidation level will violate the analysis.
For risk management, please don't forget stop loss and capital management
When we reach the first target, save some profit and then change the stop to entry
Comment if you have any questions
Thank You
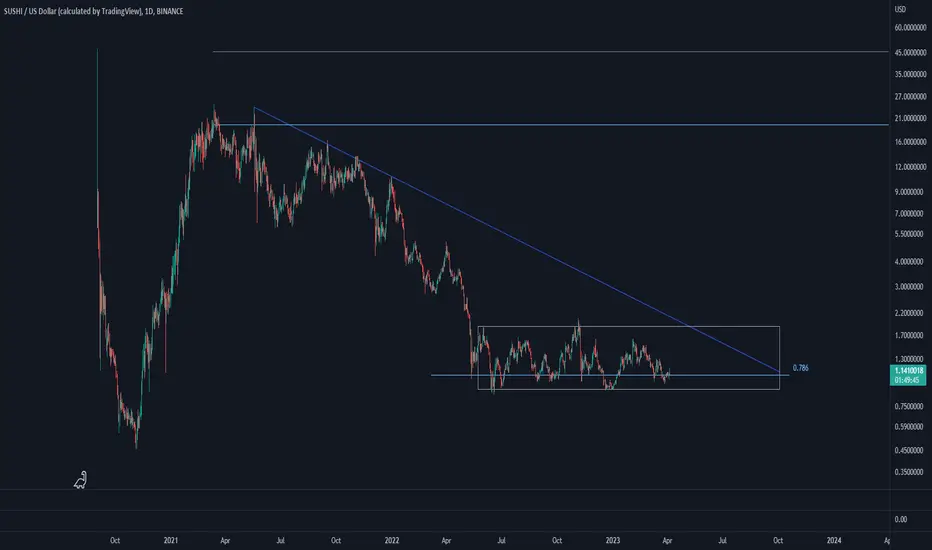
SUSHISWAP - On All Time Low SupportAnother coin that I have been keeping an eye on for some time is SUSHI, the risk reward is excellent as in very few other cases, the most important reversal point is about 20x from the current price, considering that it is one of the most important DEXs in the industry I think it is an excellent investment for the near future.

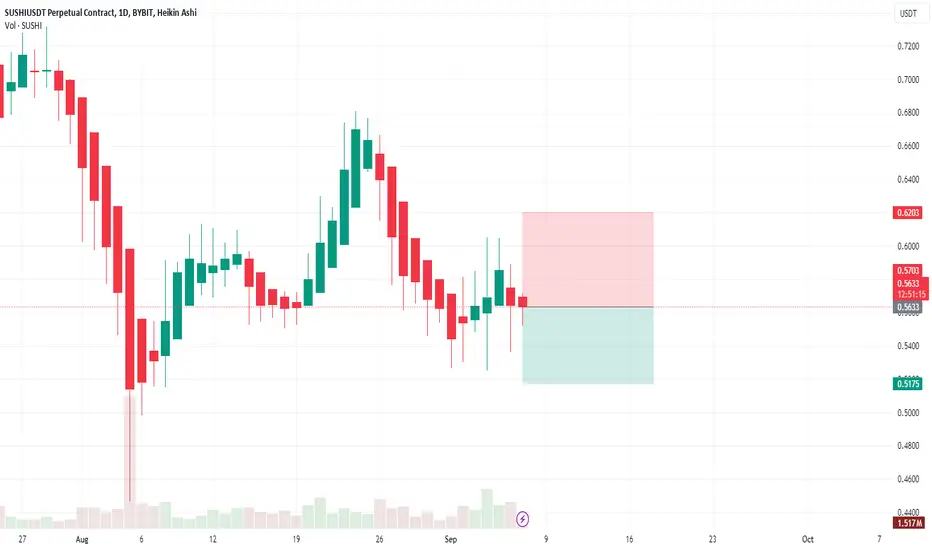
SUSHI (Crypto SUSHISWAP-USD) SELL TF H1 TP = 0.5175On the H1 chart the trend started on Aug. 27 (linear regression channel).
There is a high probability of profit taking. Possible take profit level is 0.5175
Using a trailing stop is also a good idea!
Please leave your feedback, your opinion. I am very interested in it. Thank you!
Good luck!
Regards, WeBelievelnTrading
Alikze »» TAO | Retest the bottom of the ascending channel🔍 Technical analysis: Retest the bottom of the ascending channel
- In the 4H time frame, after a price pump in the range of $162, it has been moving in an upward channel for some time.
- In this ascending channel, after hitting the ceiling of the channel 3 times and not being able to break the range, it has faced selling pressure.
- Currently, in the middle of the channel, after suffering for a while, it has again faced selling pressure.
- According to the behavior and structure of this correction, it can extend to the area of $278, which is in the range of the bottom of the channel. After that, it can have a retest to Fibo 1.618 and neck line, and then continue the correction to the $250 area.
- In addition, if the $250 range is broken, the correction should continue until the origin of the downward movement.
💎 Alternative scenario: If in this ascending channel it can stabilize above the neckline after the pullback to the broken structure, there will be a retest to the top of the channel.
»»»«««»»»«««»»»«««
Please support this idea with a LIKE and COMMENT if you find it useful and Click "Follow" on our profile if you'd like these trade ideas delivered straight to your email in the future.
Thanks for your continued support.
Best Regards,❤️
Alikze.
»»»«««»»»«««»»»«««
MEXC:TAOUSDT

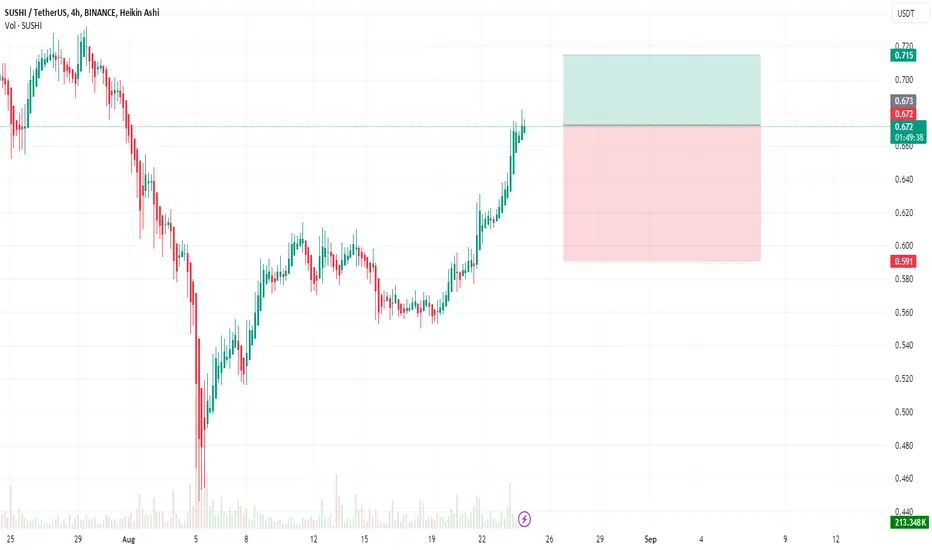
SUSHI (Crypto SUSHISWAP-USD) BUY TF H4 TP = 0.7142On the H4 chart the trend started on Aug. 07 (linear regression channel).
There is a high probability of profit taking. Possible take profit level is 0.7142
Using a trailing stop is also a good idea!
Please leave your feedback, your opinion. I am very interested in it. Thank you!
Good luck!
Regards, WeBelievelnTrading
Trade Setup: SUSHI Long PositionMarket Context:
CRYPTOCAP:SUSHI has reclaimed a key support zone at $0.548 and held above it for the past week, indicating strong acceptance. A potential break of the current trend could offer a medium-term trade opportunity.
Trade Setup:
Entry: Ladder into the position between $0.57 and $0.60.
Take Profit:
First target: $0.73
Second target: $0.86
Third target: $0.965
Stop Loss: Daily close below $0.495.
📊 This setup offers a favorable risk-reward ratio. Keep an eye on price action and adjust your position as needed. #SUSHI #CryptoTrading #RiskManagement 🎯
