SUSHIUSDT at a Critical Pivot Golden Pocket Retest or Bull Trap?📊 Full Daily Chart Analysis (1D) — KuCoin
After months of dull sideways movement, SUSHI is finally showing signs of life! A strong breakout above a long-term consolidation range has pushed price up to the key resistance at $1.03, raising the possibility of a mid-term trend reversal.
However, the price is now entering a pullback phase. The key question:
Is this just a healthy correction before the next leg up—or the beginning of another downward move?
---
🔍 Structure & Pattern Breakdown:
Rounded Bottom Formation:
Formed from April to July 2025, this pattern signals a shift from accumulation to potential bullish expansion.
Confirmed Breakout:
A breakout above the neckline at $0.80, supported by increasing volume, suggests this move is legitimate—not a fakeout.
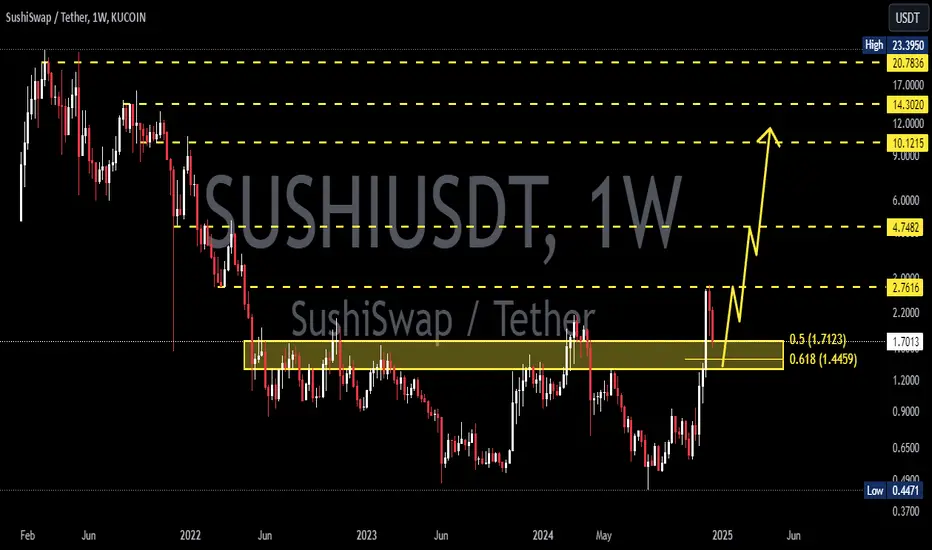
Golden Pocket Retest (Key Fibonacci Zone):
Price is currently pulling back into the Fibonacci Golden Pocket (0.5 at $0.7992 and 0.618 at $0.7295) — the most ideal technical zone for a bullish re-entry. This area also aligns with a strong historical demand zone.
---
📈 Bullish Scenario (Primary Case):
If daily candles hold above the $0.7295–$0.7992 zone and form a strong reversal signal (e.g. bullish engulfing or hammer):
Price is likely to retest $1.03 (minor resistance).
A successful breakout above $1.03 could lead to a rally toward:
🔸 $1.3374 – Previous horizontal resistance
🔸 $1.8307 – Key psychological level & March 2025 swing high
🔸 $2.6591 – Fibonacci extension target
🔸 $2.8195 – Major high from November 2024
This could mark the beginning of a mid-term bullish trend if volume continues to build.
---
📉 Bearish Scenario (Alternative Case):
If the price fails to hold above the Golden Pocket and breaks below $0.7295:
A deeper correction is likely, with price revisiting $0.60 or even retesting the bottom zone at $0.4515.
This would invalidate the bullish setup and confirm a bull trap.
---
🧠 Conclusion:
SUSHI is at a decisive moment. This retest of the Golden Pocket will determine whether this is simply a healthy pullback within a new uptrend, or the early sign of another bearish breakdown.
> Plan the trade, trade the plan. The $0.73–$0.80 zone is the battlefield for SUSHI’s next major move.
---
📌 Key Levels:
Level Description
$0.7295–$0.7992 Golden Pocket (Fibonacci Re-Entry Zone)
$1.03 Minor Resistance
$1.3374 Bullish Target 1
$1.8307 Bullish Target 2 (Mid Resistance)
$2.6591–$2.8195 Long-Term Bullish Targets
$0.60 / $0.4515 Bearish Supports if Breakdown Occurs
#SUSHIUSDT #CryptoBreakout #FibonacciTrading #GoldenPocket #AltcoinReversal #SushiSwap #CryptoSetup #TechnicalAnalysis #BullishScenario
Sushiusdtanalysis

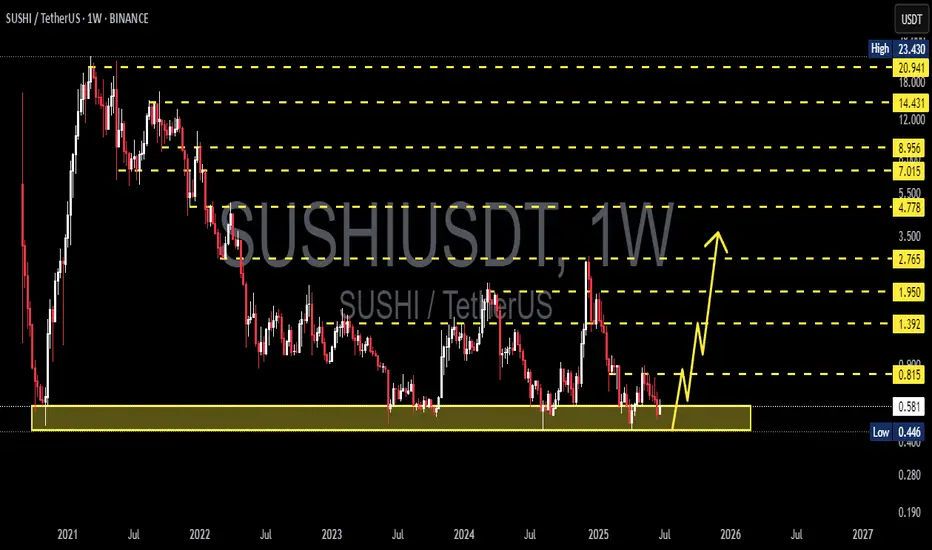
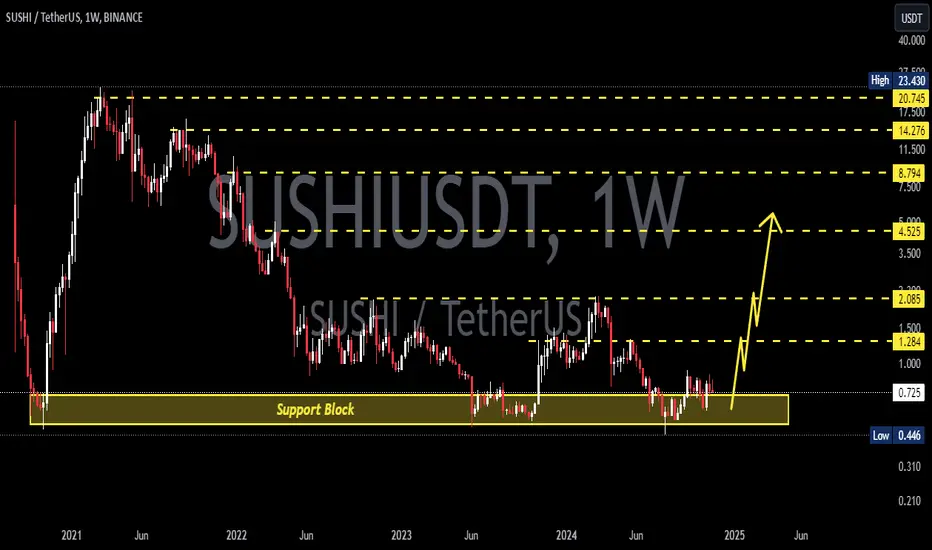
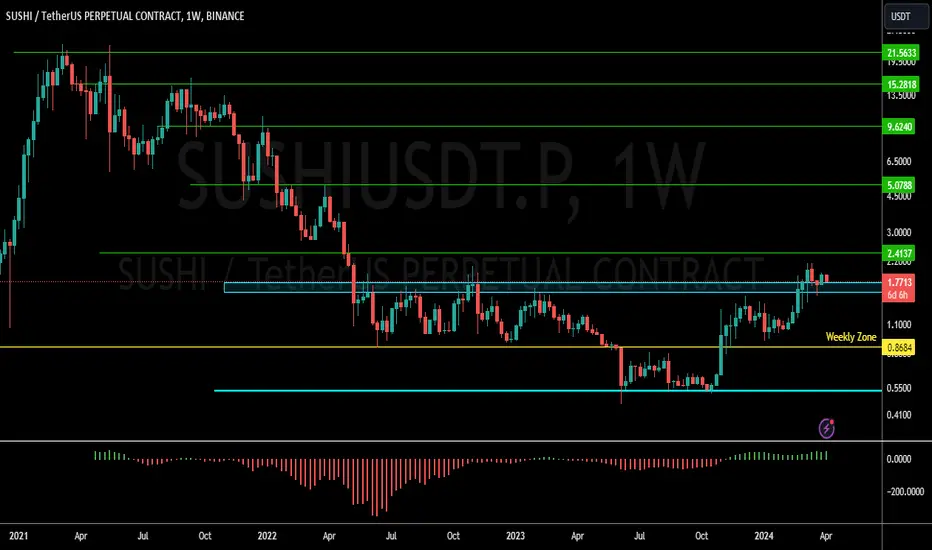
SUSHI/USDT Reversal from Historical Demand ZoneThe SUSHI/USDT pair is showing strong potential for a bullish reversal from the long-term demand zone between $0.44 - $0.58, which has historically acted as a solid support area since 2021. Price has tested this zone multiple times and has bounced back, indicating significant buying interest.
🔍 Technical Overview:
Timeframe: Weekly (1W)
Key Support Zone: $0.44 - $0.58 (strong accumulation area)
Key Resistance Levels (Potential Targets):
$0.815
$1.392
$1.950
$2.765
$3.500+
Price Structure: Currently forming a possible double bottom or sideways accumulation near the macro support, often seen before bullish markup phases.
Bullish Signal: The yellow arrow illustrates a projected upward movement over the coming weeks/months if the support holds.
After a prolonged downtrend, SUSHI/USDT is now at a critical turning point, bouncing from a multi-year support zone. This accumulation phase may be the early stage of a major bullish trend. Traders should keep an eye on this setup as a breakout toward higher resistance levels could be imminent.
#SUSHI #SUSHIUSDT #CryptoAnalysis #Altcoins #CryptoReversal #TechnicalAnalysis #CryptoSupportResistance
#BullishReversal #CryptoSignals #PriceAction #ChartPattern
SUSHIUSDT 1W AnalysisSUSHI ~ 1W Analysis
#SUSHI This is the lowest support for now, buy from here with a short term target of at least 15%+ from here.
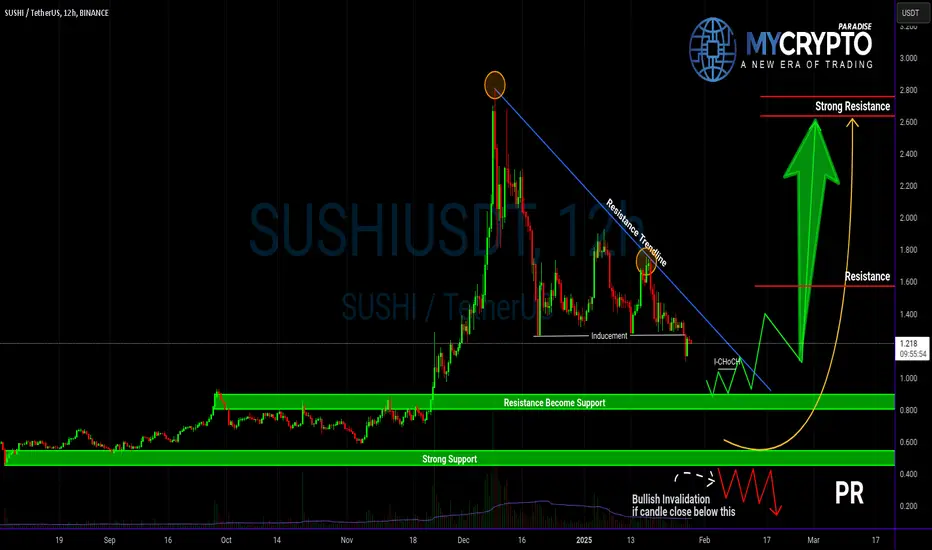
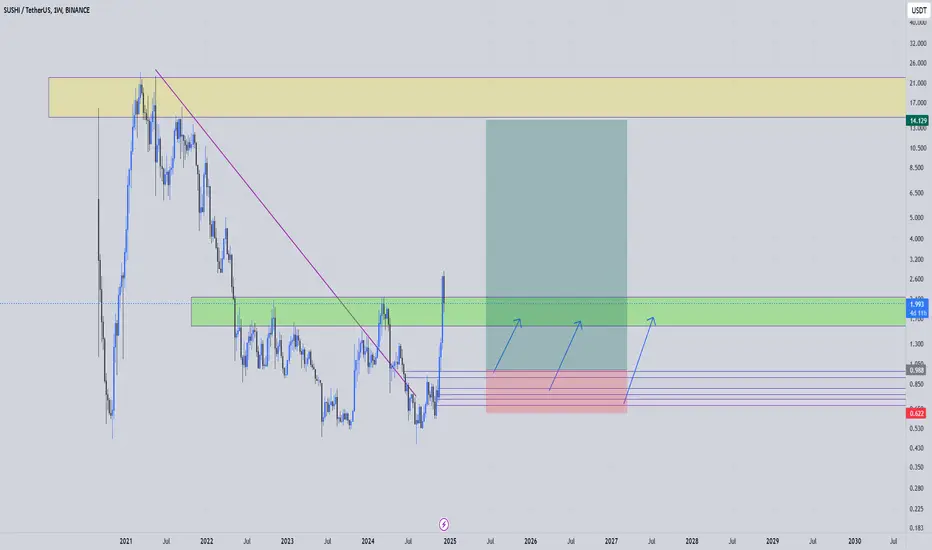
Is SUSHIUSDT About to Bounce or Break? Yello, Paradisers! SUSHIUSDT is setting up an intriguing scenario after reacting to a key resistance trendline. Let’s break this down:
💎If SUSHIUSDT shows a bullish I-CHoCH (Internal Change of Character) from the key support zone—previously a resistance level—it could signal a higher probability of a bounce. However, patience is key here; we need to wait for confirmation of a bullish I-CHoCH on lower timeframes to take action.
💎On the flip side, if the price experiences further drops or shows signs of panic selling, the best approach would be to wait for it to reach a stronger support zone. At that point, we’d need to look for bullish patterns such as A W formation or An Inverse Head and Shoulders on lower timeframes to stack the odds in our favor.
💎If the price breaks down and closes a candle below the strong support zone, it will invalidate the bullish thesis entirely. In that case, it’s smarter to wait for a clearer structure to develop before considering any entries.
🎖 Remember, Paradisers, disciplined trading is the only way to achieve long-term success. Avoid impulsive decisions and always prioritize confirmation over speculation. The market rewards patience and preparation—stay sharp, stay focused.
MyCryptoParadise
iFeel the success🌴
SUSHIUSDT Potentially BullishWe've seen some pretty significant move in the the crypto market in the last few days (maybe weeks) especially wiith BINANCE:BTCUSDT hitting the 104K area. It is more than expected that most coins will follow suit.
BINANCE:SUSHIUSDT is one of such coins and as it stands, it has broken a significant zone at the 0.7175 area and attempting a retest. If the zone holds as a new found support, we just might see another significant push phase targeting the 1.32 area. Until then, fingers crossed
Updates to follow!!!
Past results does not guarantee future results

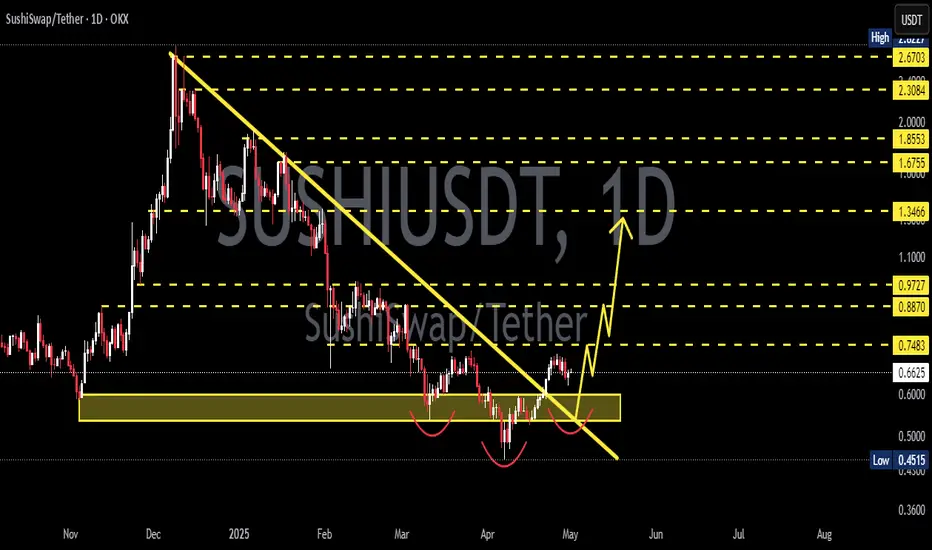
SUSHIUSDT 1D AnalysisSUSHI ~ 1D Analysis
#SUSHI Buy when re -testing this support block with a short -term target of at least 10%+ from here.
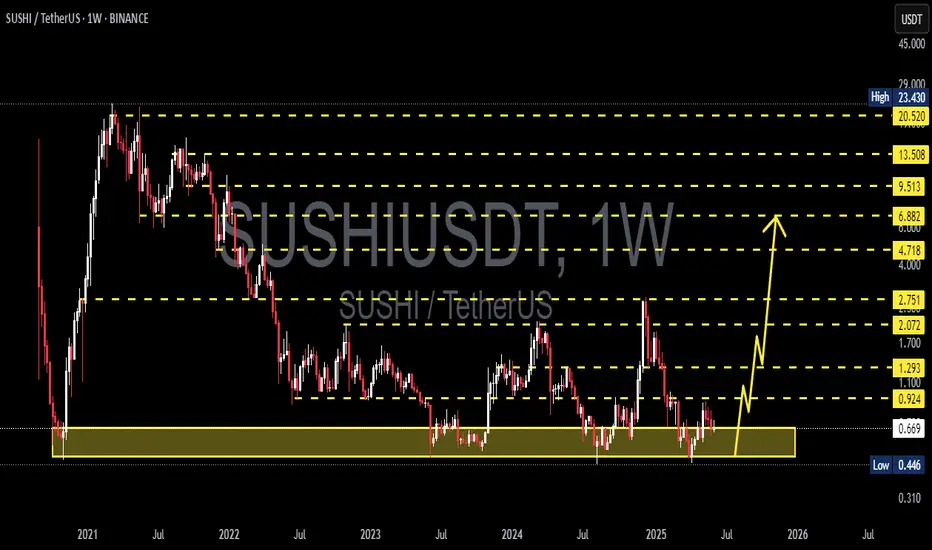
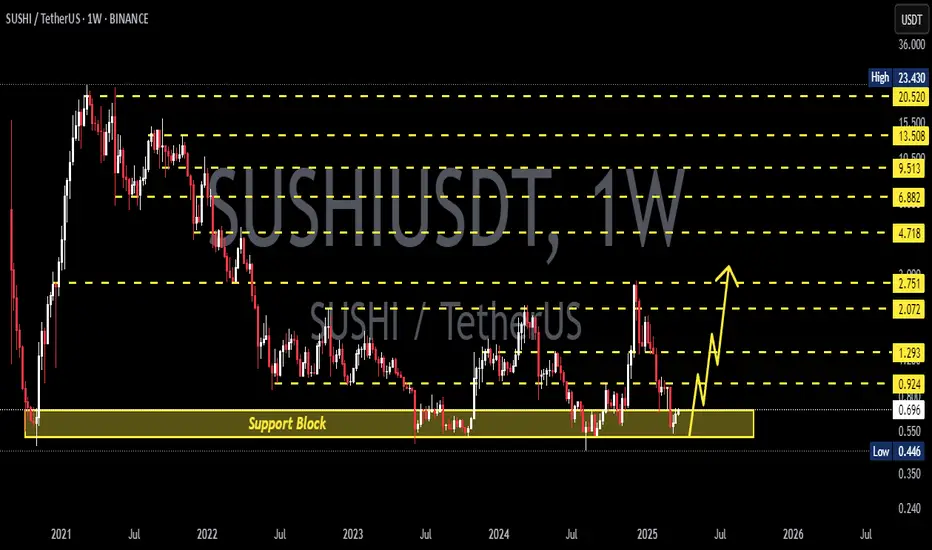
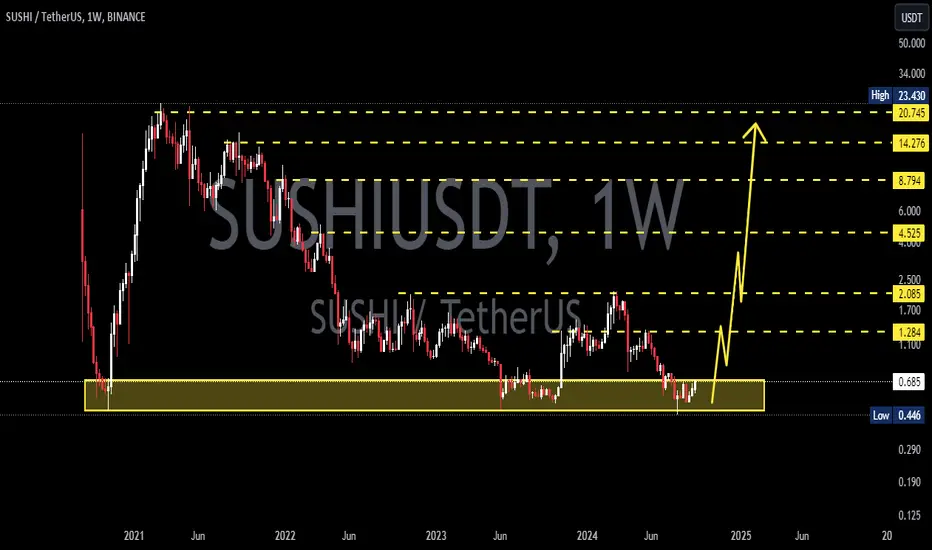
SUSHIUSDT 1WSUSHI ~ 1W Analysis
#SUSHI Buy gradually from here with a short -term target of at least 20%+. This is the lowest support for now.
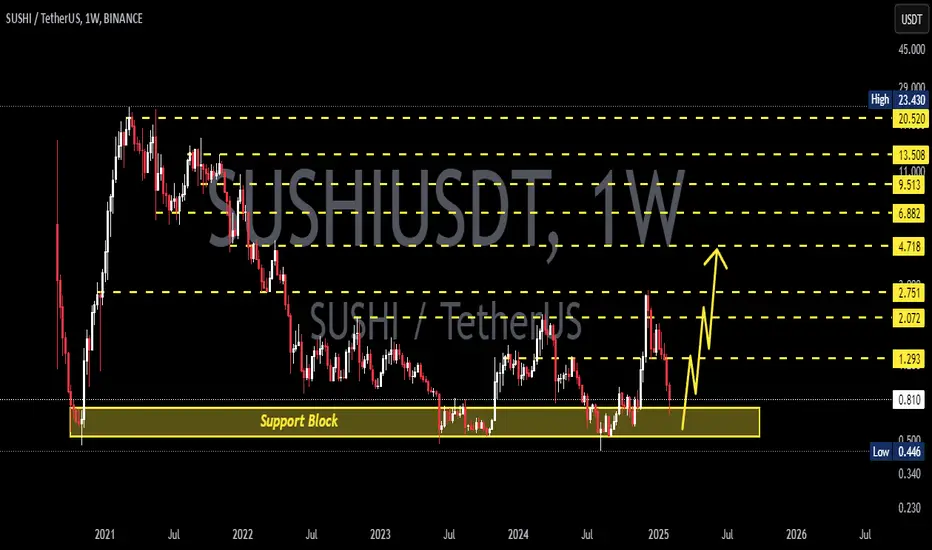
SUSHIUSDT 1WSUSHI ~ 1W Analysis
#SUSHI This is the lowest support for now. Buy from here if you still have a Conviction on this coin with a minimum target of 20%+.
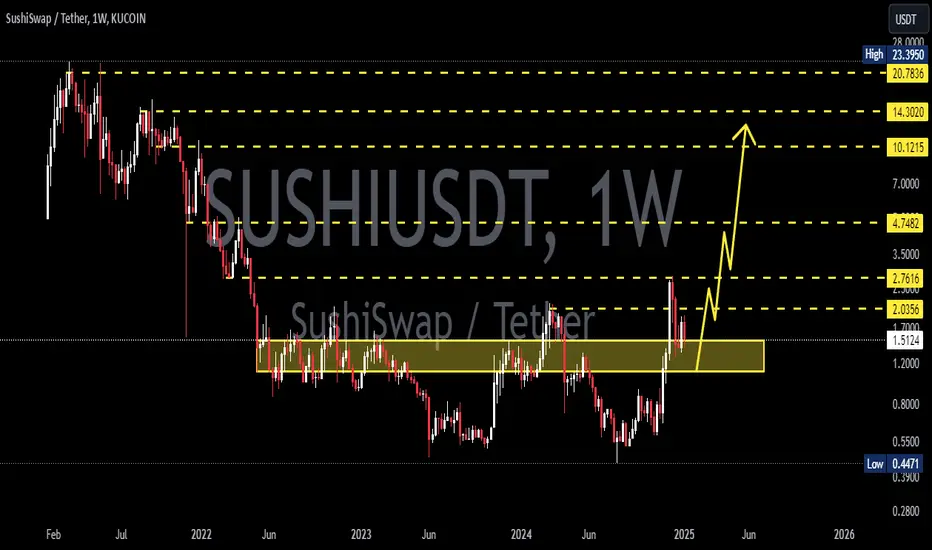
SUSHIUSDT 1WSUSHI ~ 1W
#SUSHI So far it continues to maintain its bullish structure. Buy in stages from here. with a minimum target of 20%++
SUSHIUSDT 1WSUSHI Update ~ 1W
#SUSHI Retesting this support block,. If you still have Conviction on this coin,. Buy in stages from here. with a minimum target of 20%++
sushi idea"🌟 Welcome to Golden Candle! 🌟
We're a team of 📈 passionate traders 📉 who love sharing our 🔍 technical analysis insights 🔎 with the TradingView community. 🌎
Our goal is to provide 💡 valuable perspectives 💡 on market trends and patterns, but 🚫 please note that our analyses are not intended as buy or sell recommendations. 🚫
Instead, they reflect our own 💭 personal attitudes and thoughts. 💭
Follow along and 📚 learn 📚 from our analyses! 📊💡"
SUSHIUSDT 1WSUSHI ~ 1W
#SUSHI If you still have Conviction on the coin,. You need to pay attention to these support blocks,. So far this support Block continues to hold the price. Buy in stages and target at least 20%++
#SUSHIUSD 1 DAYSUSHIUSD 1-Day Analysis: Uptrend & Buy Opportunity
The SUSHIUSD pair is currently showing a robust upward trend on the daily chart, indicating strong bullish momentum. Recent price action suggests a solid support level has formed, providing a favorable entry point for potential buyers. Key indicators, including moving averages and RSI, further reinforce the uptrend, signaling increasing buying interest.
Market sentiment appears positive, driven by recent developments in the DeFi space and increased user engagement on the SushiSwap platform. This favorable environment presents a compelling buy opportunity for traders looking to capitalize on potential price appreciation.
As always, it’s crucial to consider risk management strategies and stay updated on market news to make informed decisions.

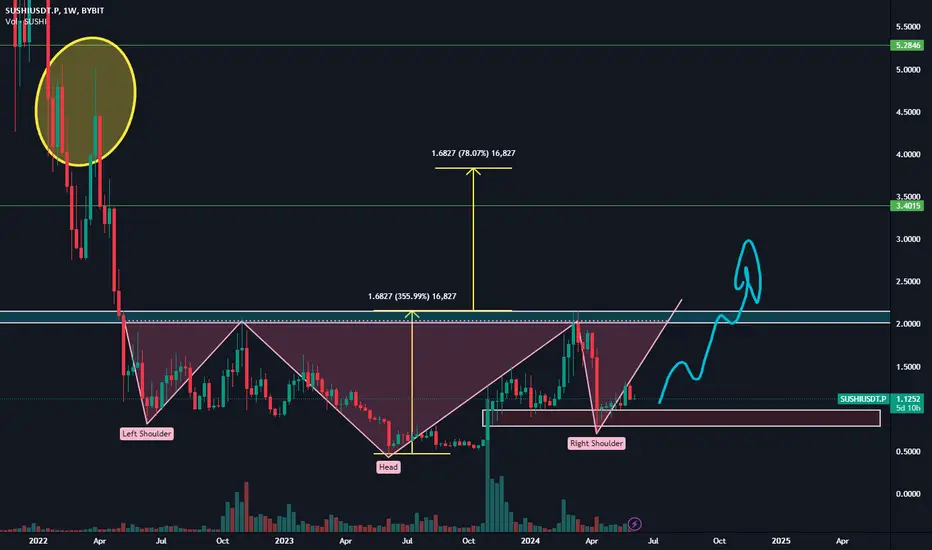
Is it time for make decent profit on SUSHI?0.8-1 area was beautiful opportunity enter, but don't worry we got another chance right here. Sushi couldn't break 1.1 area in last month. Fortunately we see big bull candle close above 1.1 area and consolidating over it. That is a great sign to go up and lovely to see it. And beautiful H&S pattern forming right now. If you don't want to take risks and wants to take it slow, I suggest you enter in long position after neck breaks.
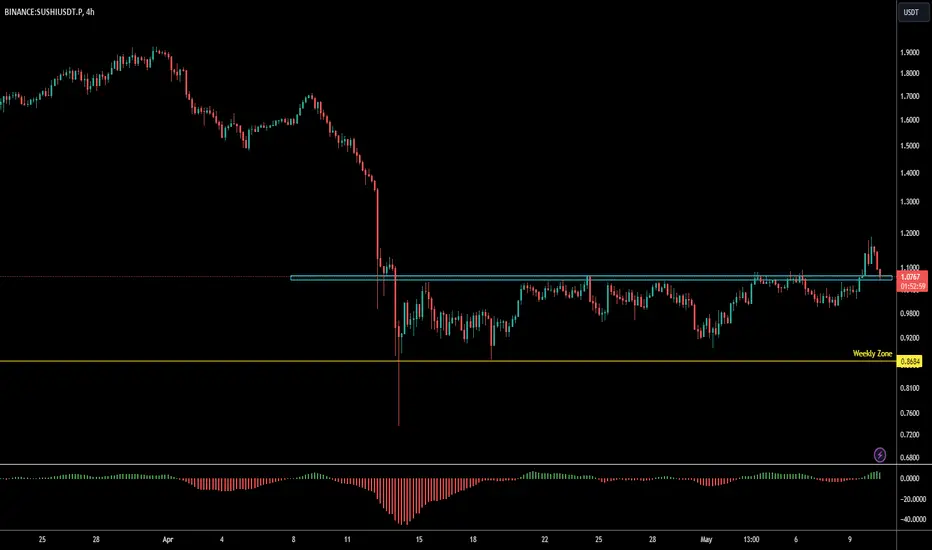
Potential Long on SUSHIUSDTBINANCE:SUSHIUSDT eventually broke through 1.0719 area and is doing a retest of that area. If the zone is maintained as a new found support, we just might see some new highs on #SUSHIUSDT.
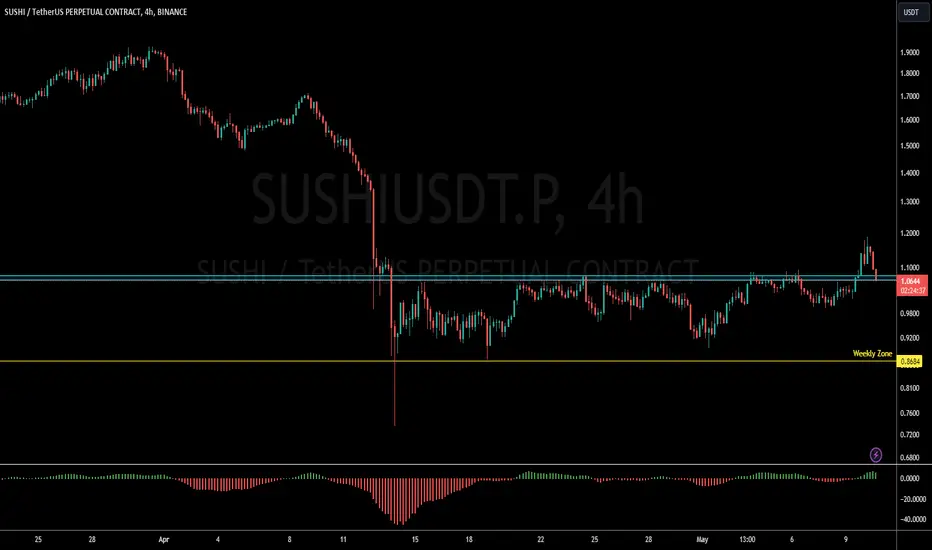
SUSHIUSDT Potentially BullishBINANCE:SUSHIUSDT breaks out of the immediate resistance at 1.0719 and is currently retesting the same area as a new found support. If the zone holds, we just might see new highs. However any further dip will present another opportunity to go long for me. #SUSHIUSDT
SUSHIUSDT Potentially for a LongBINANCE:SUSHIUSDT broke slightly above the 1.7283 area. With the reversal pattern taking formation, BINANCE:SUSHIUSDT will likely be in for a long position. This does not mean that there may not be some further dips, but with the dips comes an opportunity to buy more.
Past results does not guarantee future results, do your due diligence before taking any trade idea.
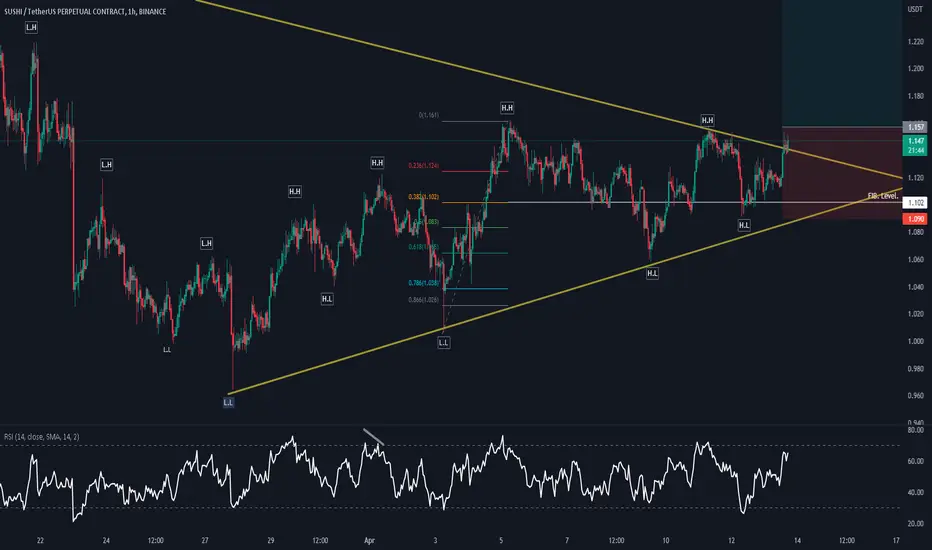
SUSHI USDT Triangle Break out in 4 Hr TF. BINANCE:SUSHIUSDT SUSHI USDT Triangle Break out in 4 Hr TF. Long Entry break the previous H.H. Risk / Reward 1:2
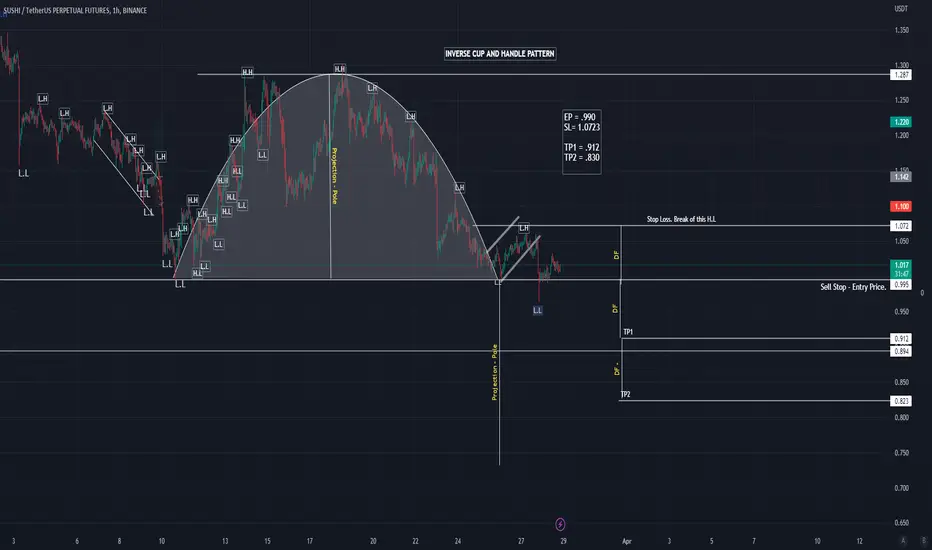
Sushi USDT Inverse Cup And Handle Pattern Formation in 1 HR TF. BINANCE:SUSHIUSDT Sushi USDT Inverse Cup And Handle Pattern is formed 1 HR Time Frame. This TA based on my analysis of the market and trading strategy.
Therefore, it is recommended that DYOR before any decision.
SUSHI/USDT SHORTER TF TRADE SETUP!! Hi guys, This is CryptoMojo, One of the most active trading view authors and fastest-growing communities.
Do consider following me for the latest updates and Long /Short calls on almost every exchange.
I post short mid and long-term trade setups too.
Let’s get to the chart!
I have tried my best to bring the best possible outcome in this chart, Do not consider it as financial advice.
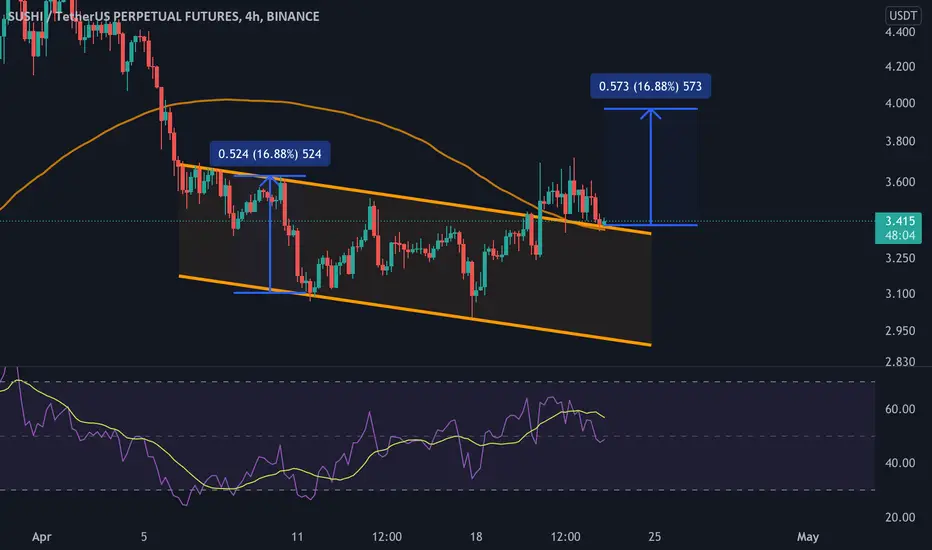
SUSHI is retesting this channel. Expecting a 10-15% pump from here.
Entry range:- $3.38-$3.44
Target:-10-15%
SL:- $3.30
Lev:- 10x to 20x
This chart is likely to help you in making better trade decisions if it did consider upvoting this chart.
Would also love to know your charts and views in the comment section.
Thank you
SUSHIUSDT AnalysisHello friends.
Please support my work by clicking the LIKE button(If you liked).Thank you!
Everything on the chart.
open pos: market and lower
target: 12.5 - 15.5 - 19.5
after first target reached move ur stop to breakeven
stop: ~im w/o stop (depending of ur risk). ALWAYS follow ur RM .
risk/reward 1 to 4
risk is justified
Good luck everyone!
Follow me on TRADINGView, if you don't want to miss my next analysis or signals.
It's not financial advice.
Dont Forget, always make your own research before to trade my ideas!
Open to your questions or suggestions.

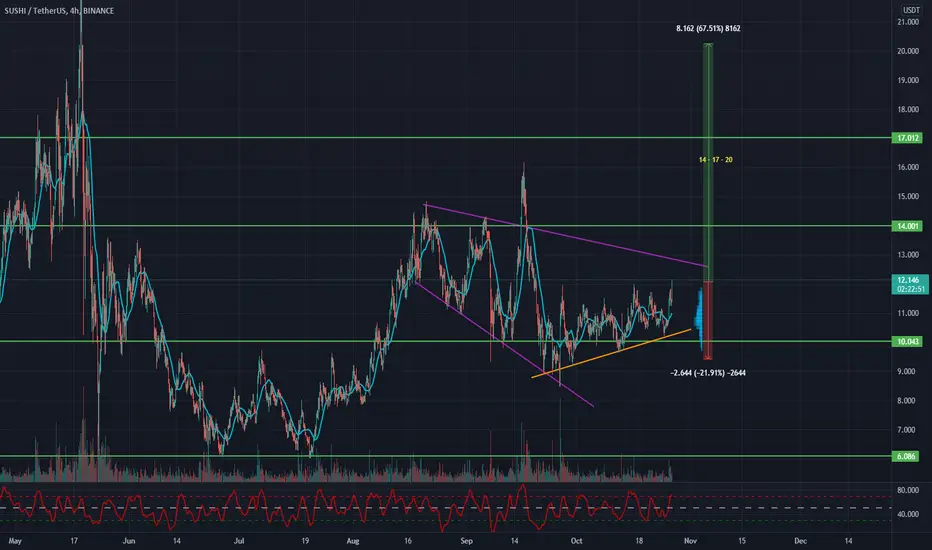
SUSHIUSDT AnalysisHello friends.
Please support my work by clicking the LIKE button(If you liked).Thank you!
Everything on the chart.
open pos: market
target: 14 - 17 - 20
after first target reached move ur stop to breakeven
stop: ~9.4(depending of ur risk). ALWAYS follow ur RM .
risk/reward 1 to 3
Good luck everyone!
Follow me on TRADINGView, if you don't want to miss my next analysis or signals.
It's not financial advice.
Dont Forget, always make your own research before to trade my ideas!
Will be very APPRECIATE FOR UR DONAT/coins :)
Open to your questions or suggestions(Looking for investors!).