Gold Price ActionHello Traders,
Hope you're all doing well. Here's the current setup I’m observing — and most importantly, remember to wait for the right moment.
As marked, there’s a clear supply zone, and price action is expected to move towards it. For entering a long position, there are a few approaches you can take:
Use the 50% level of the Fair Value Gap (FVG)
Look for breaker blocks
Identify order blocks
The method you choose should depend on current market conditions and price movement.
Once you spot the setup, aim for the top supply zone — that’s where the price is likely headed. Patience is key to catching the right entry. If you need assistance, my indicator can help pinpoint the move — but if you’re confident in your analysis, you may not need it.
Wishing you all the best and happy trading!
Suvashishfx

Gold Price ActionHello Traders,
As you can see, I’ve drawn a trendline based on the 4-hour timeframe. I’ve also marked the demand zone, and if you observe closely, the price has already broken past the inducement levels. This indicates a strong buying opportunity, provided proper risk management is in place.
You can aim for up to a 1:5 risk-to-reward ratio, but always remember to manage your risk carefully – the market has no mercy for complacency.
Wishing you all the best and happy trading.
Thank you!
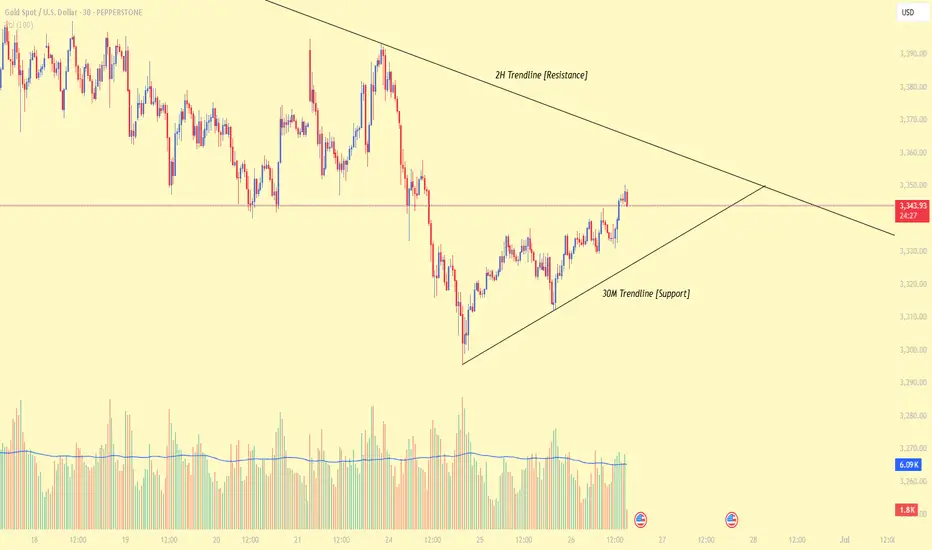
Gold Price ActionHello Traders,
There’s a potential Buy/Sell opportunity here based on the current price action. I’ve marked trendlines on two different timeframes, which highlight key Support and Resistance levels.
I've shared more detailed analysis on my channel, so feel free to check that out for deeper insights.
When the price reacts (rejects) from these support or resistance zones, we can look to confirm our entry by analyzing volume—this helps us avoid false signals.
For trade management, consider using a Risk-Reward ratio between 1:2 and 1:5, depending on your personal trading style. Most importantly, avoid trading blindly—always wait for confirmation.
Wishing you all the best and happy trading!
Thank you!
Gold Price ActionHello Traders, I've observed that gold is currently respecting the trendline in both directions. However, there's still a valid Fair Value Gap (FVG) in play. If the trendline fails to hold, there's a good chance that price could reverse from that FVG zone.
So, keep a close watch on both the trendlines and the FVG area, and don’t forget to monitor volume for confirmation.
Wishing you all the best — happy trading, and thank you!

BTCUSD Price ActionHello Traders,
The market is closing soon, but for those following BTC — here's a setup I’ve spotted. Our previous setup successfully hit the take-profit target.
Now, we can clearly see that price initially respected the trendline, followed by a breakout. It has now returned for a retest, again respecting the trendline. This presents a valid short opportunity, provided you apply proper risk management.
Also, take a moment to reflect on any trading mistakes you made this week — not with regret, but as a learning experience. That’s how progress happens.
Wishing you all the best — happy weekend and good trades ahead!

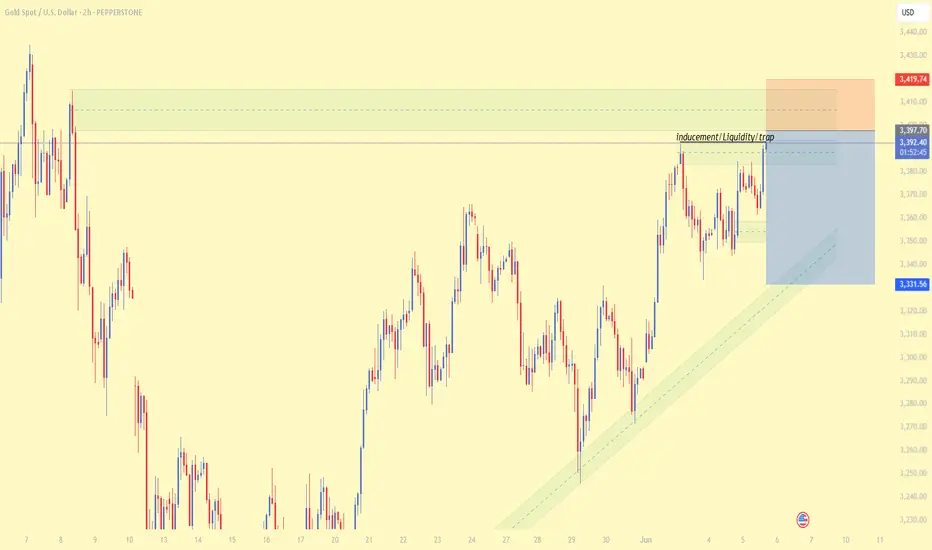
Gold Price ActionHello traders, hope you're all doing well!
Here's a straightforward setup that could yield 100–200 pips with ease.
Price has entered the inducement or "trap" area, but the true sell zone lies just above.
Look to enter short positions from that higher level and aim to capture some solid pips.
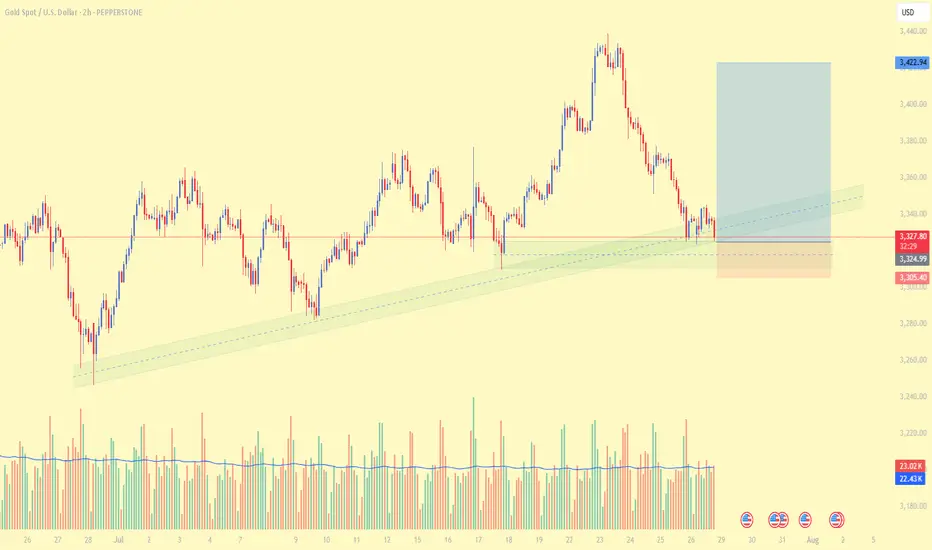
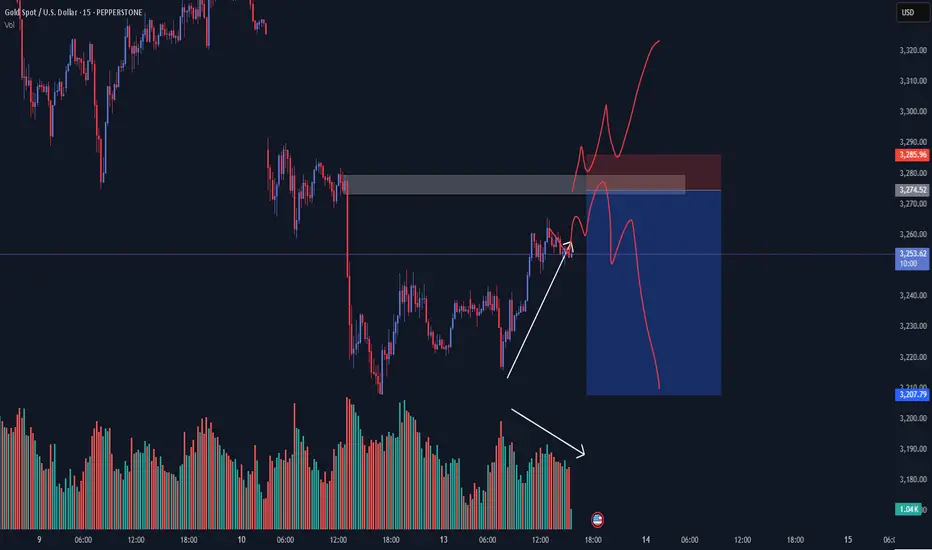
Gold Price ActionHello everyone,
As you can see, I've marked a fresh Supply Zone along with a Volume observation. Notice how price is rising while volume is falling — this typically indicates a lack of buying interest or that buyers are stepping back.
From here, we could see two possible scenarios:
Price rejects the supply zone and begins to drop
Price breaks above the zone, signaling a potential continuation to the upside
⚠️ Don't forget: CPI news is scheduled for today, so be extra cautious.
Make sure you manage your risk, trade smart, and stay focused.
Wishing you all the best — happy trading! 📊💼
Gold Price Action (TRAP)Gold has been respecting a clear descending channel on the 1H timeframe. After a strong bullish impulse, price has been consolidating within this structured decline, showing lower highs and lower lows. But something interesting is happening now...
🔍 Current Observations:
Price remains within the lower boundary of the descending channel — showing signs of compression.
Volume spike detected near recent lows while candles remain relatively small in range.
This is a classic “Volume > Price” divergence, often associated with smart money absorption or hidden accumulation.
💡 What This May Mean:
Despite the bearish structure:
The increase in volume without new strong lows could indicate that institutional players (smart money) are absorbing sell orders from retail traders.
These setups can often lead to a sharp upward breakout, especially if the price closes above the channel midline or recent swing high.
📌 What to Watch:
A confirmed break above the channel (preferably with strong volume) would validate a potential reversal.
Support remains fragile around the lower boundary. Failure to hold may trigger a final flush or fake-out before reversal.
🔔 Strategy Ideas:
⚠️ Don't jump in early — wait for a clean breakout candle with follow-through.
✅ Look for confirmation like:
Bullish engulfing at key support
Volume spike + breakout of last 1–2 candle highs
Break of descending trendline with a close
🧠 Final Thought:
This may be a smart money trap setup — where institutions accumulate just before the trend turns. Keep your eyes on volume + structure for the clearest signals.

Gold Price ActionHello traders! This is almost same setup or pattern as BTCUSD
If you look closely at the left side of the chart, you’ll notice multiple rejections from the same zone — forming a head-and-shoulders-style distribution. This area has now become a strong supply zone.
📌 What to Expect:
This is a high-probability short setup. If price taps into the supply zone again, it could trigger a strong move down, especially with liquidity already swept.

BTCUSD Price ActionHello traders!
If you look closely at the left side of the chart, you’ll notice multiple rejections from the same zone — forming a head-and-shoulders-style distribution. This area has now become a strong supply zone.
Key Observations:
Price respected the trendline and formed a base just beneath the supply zone.
We saw a base breakout followed by a liquidity grab, which likely cleared out early buyers.
Price is now heading back into the supply zone with imbalance, aligning with the trendline and previous rejection area.
📌 What to Expect:
This is a high-probability short setup. If price taps into the supply zone again, it could trigger a strong move down, especially with liquidity already swept.
🎯 Idea: Wait for confirmation around the supply zone and consider shorting with a target near the support level below.

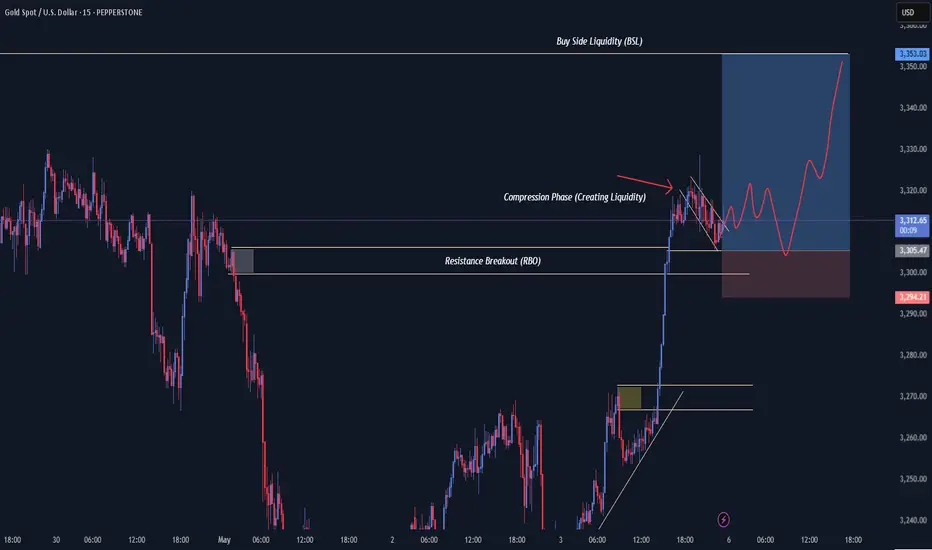
Gold Price ActionHello, Currently, price is in a Compression Phase after a strong Resistance Breakout (RBO). This tight consolidation is creating liquidity on both sides—setting up for a potential breakout.
What to Watch:
Compression Phase = Liquidity Building
Price is moving within a narrow range, trapping traders and stacking orders above and below.
We're waiting for a clean breakout of this range.
After the breakout, price is likely to retrace back toward the base (marked zone) before making a strong move toward the Buy Side Liquidity (BSL).
🎯 Trade Plan:
Wait for the compression to break. A return to the base zone could offer an entry, with BSL as the target (TP).
⚠️ Stay patient and avoid early entries—let the breakout confirm the move.
✅ Patience is key—wait for confirmation and manage risk smartly.
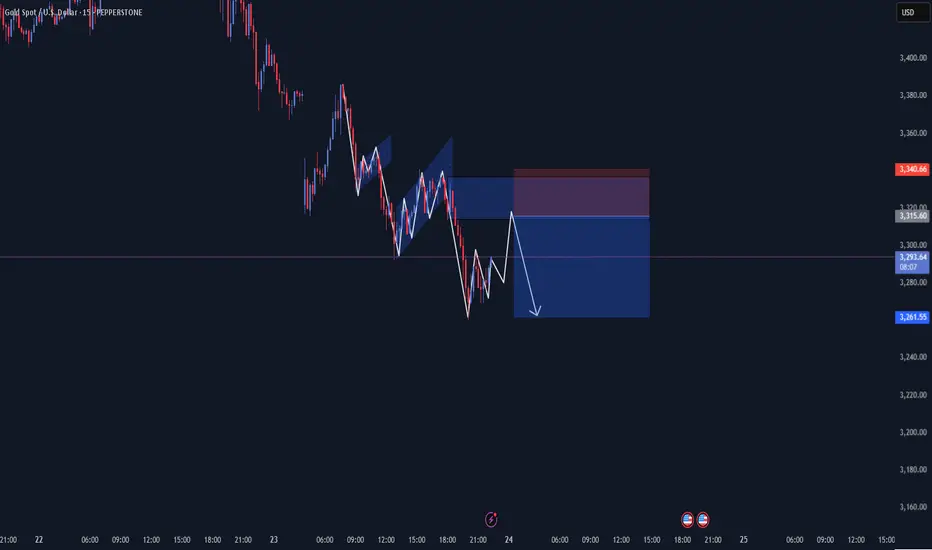
Gold Price ActionHey traders! 👋 Looking at the current structure, gold has been respecting the bearish trend perfectly — with each flag pattern breaking down as expected.
🔴 We're now seeing a pullback into a key supply zone and the setup is shaping up for a potential short opportunity.
Let the market come to you, no need to chase 🙌
Manage your risk wisely 📊
Wishing you all green pips and solid setups! 💰✨
Happy Trading! 🔥
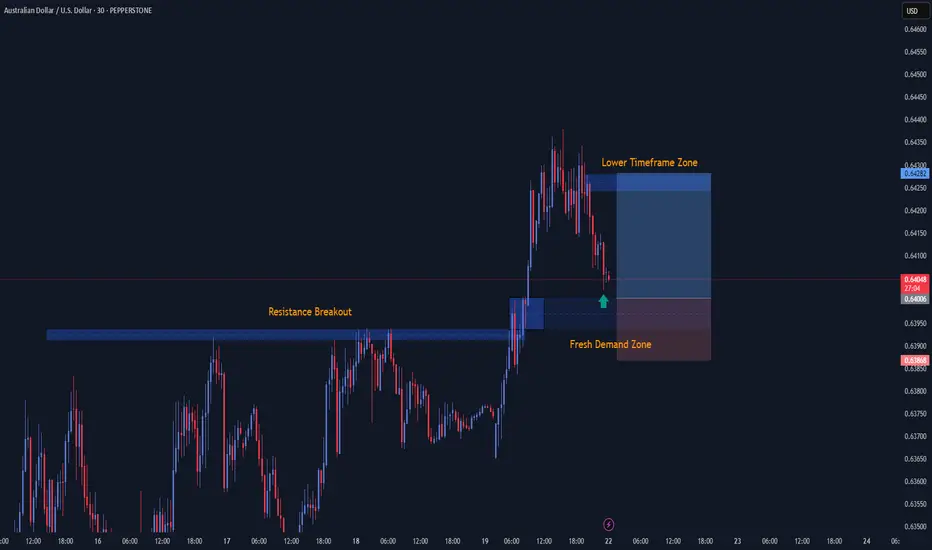
AUDUSD Price Action🛑Hello Traders, Stop overthinking — take action! 💥
In this chart, you can clearly see a resistance breakout, and I’ve also marked a fresh demand zone. Do we know if it’s going to hold? Nope — and that’s why we use a stop loss 🛡️.
But I noticed the USD weakening 💸 and AUD gaining strength 💪, which gave me more confidence in the setup. Before price even reached the demand zone, we already saw signs of rejection 🚫. Jump into a lower timeframe ⏱️, and you’ll see the picture even clearer.
🎯 Trading is a patience game. Let the market come to you.
I’ve built tools to accurately detect these zones 🧰 — yet some of you still rely on signals 📲, and that’s exactly what’s holding you back.
Stay focused. Trust the process. 💯
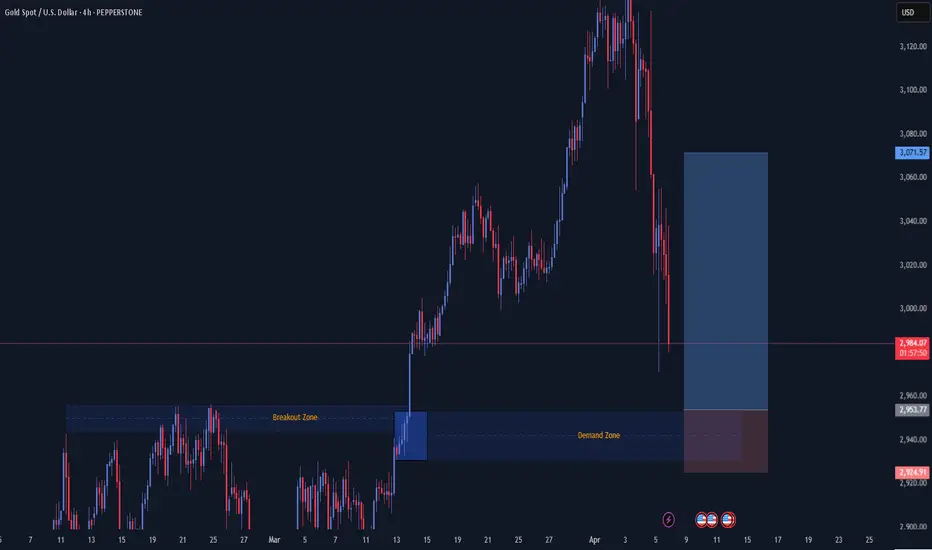
Gold Price ActionHey everyone!
We all saw what went down last week 👀 — now, if you’re looking for an entry, here’s a little tip: keep an eye on the breakout zones + demand zones .
To boost your confidence in the setup, use correlation pair analysis 🔗 and always drop down to a lower timeframe for cleaner entries.
Just a reminder — don’t trade blindly 🙈. Risk management is everything!
Wishing you all the best and happy trading!
Thanks!
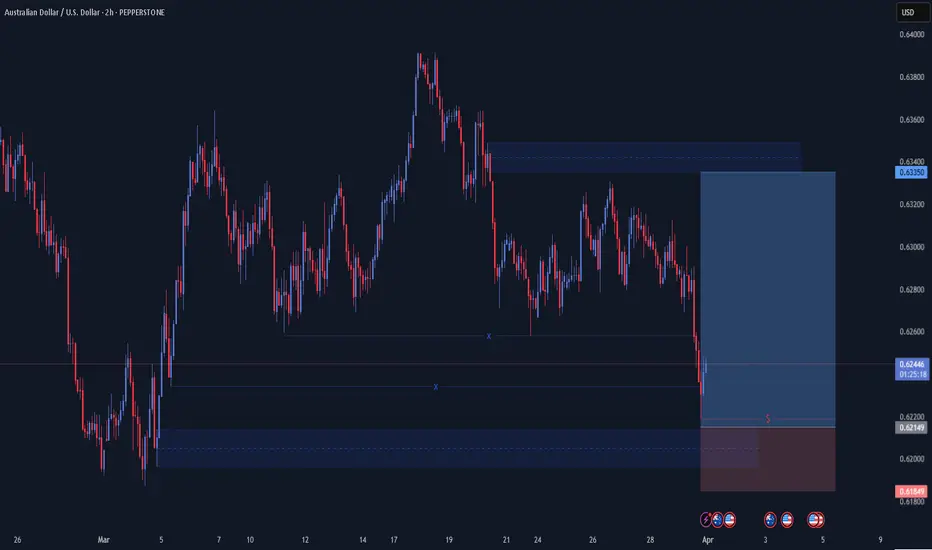
AUDUSD Price ActionHello Traders,
Liquidity is what makes supply and demand zones truly powerful. As you can see, I've marked both the supply and demand areas—each supported by clear liquidity levels on both sides.
With that structure in place, we can now look for long opportunities, but always with proper risk management in mind.
Just remember: No Liquidity = No Zone Confirmation.
Keep it simple, stick to the rules.
Good luck and happy trading!
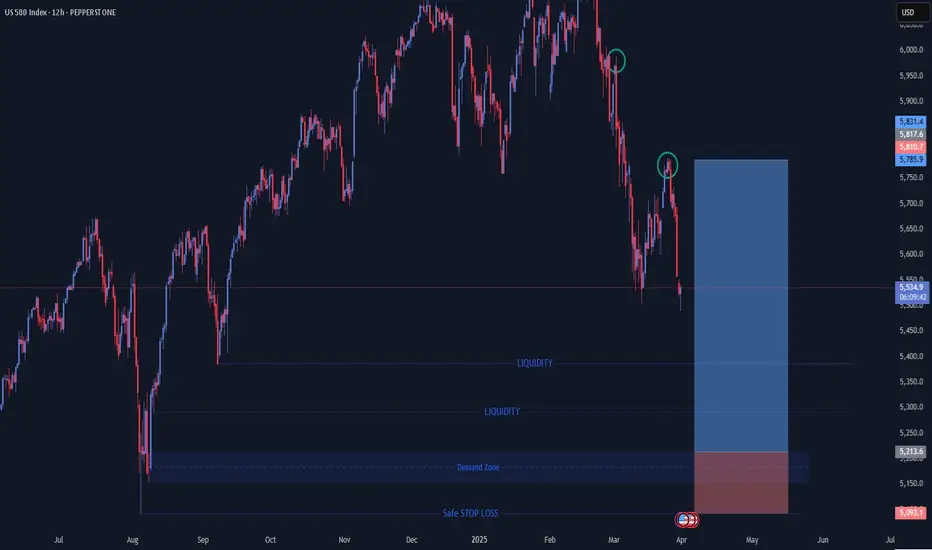
US500 Price ActionHello Trader,
As you can see, the market is currently moving to the downside, approaching a clearly identified Demand Zone. Remember, as I always emphasize: no liquidity, no valid zone. Therefore, I've also marked liquidity levels located just above this Demand Zone, along with a suggested safe Stop Loss (SL) placement. However, please keep in mind that no level is truly "safe" in trading, which is precisely why we always use stop losses and actively manage risk on every trade.
Additionally, I've highlighted two potential Take Profit (TP) areas: one where you might consider closing your trade early for safety, and another where you could hold your position if price action continues to move favorably.
As always, avoid greed, prioritize risk management, and trade responsibly.
Wishing you all the best and happy trading!
Thank you.
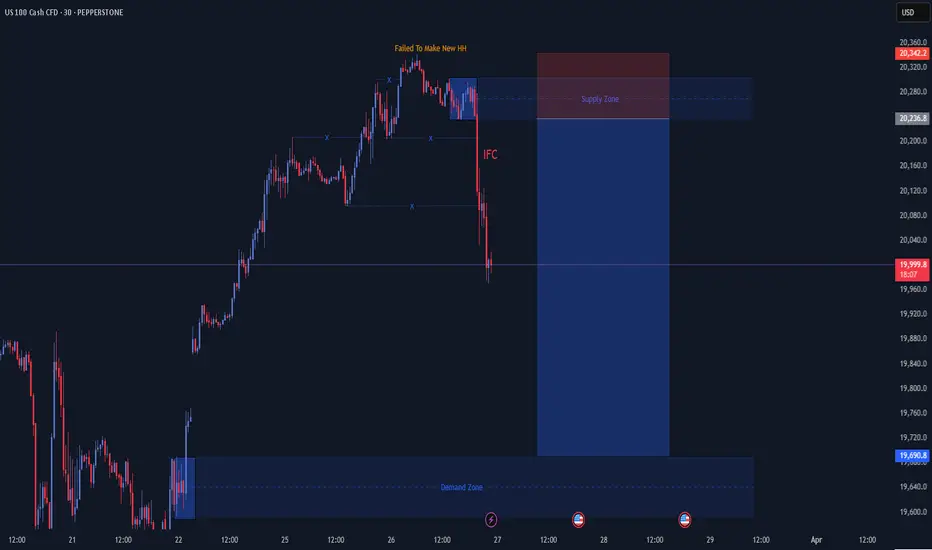
NAS100 Price ActionHey traders!
Looking at the current market structure, we can see that the price failed to make a new higher high , which is often the first sign of a potential trend reversal. This was followed by a break of two key structure levels, confirming a shift in momentum from bullish to bearish.
Interestingly, a supply zone was formed during this shift, but price didn’t even retest it — instead, it dropped right after its creation, showing strong bearish pressure. There's also an internal candle (IFC) marking the transition point.
With this kind of price action, it’s likely that the market is heading toward the next demand zone below. This could present a solid short opportunity, but always remember to manage your risk wisely and wait for clean confirmations.
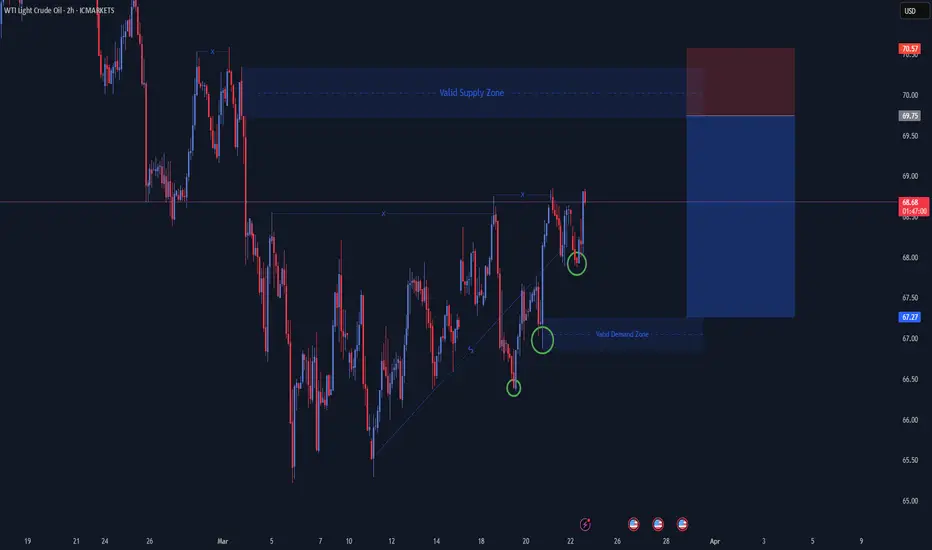
XTIUSD Price ActionHello traders!
As you can see, I've highlighted two valid Supply and Demand zones on the chart. Notice that the previous trendline liquidity has already been swept, and the market grabbed liquidity at the top before forming the supply zone.
This presents a good opportunity to enter a trade targeting the next valid demand zone below. Remember, always pay close attention to risk management—protect your balance first, then aim for profits. If you can manage risk effectively, you'll thrive in the market.
Wishing you all successful trades—happy trading!
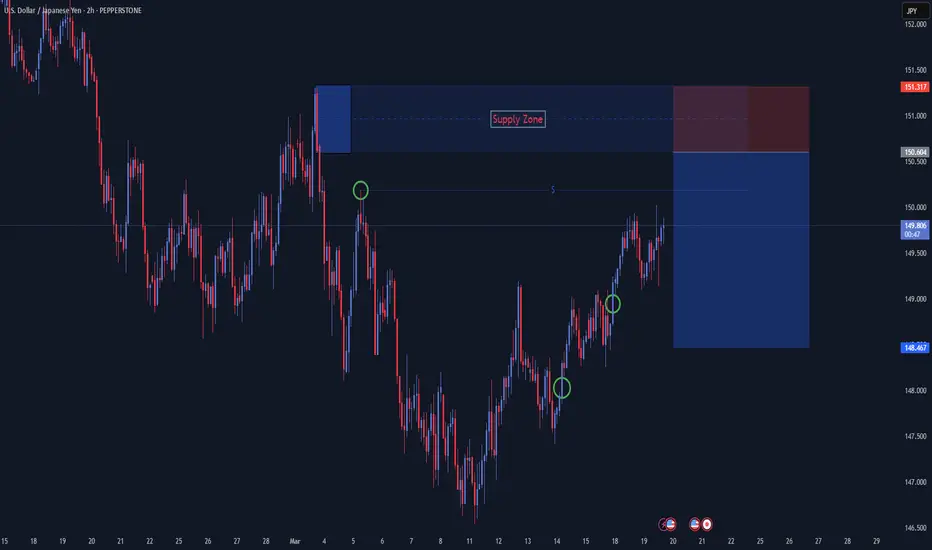
USDJPY Price ActionHello Traders,
Due to USD weakness, this pair presents a potential short opportunity. We have a valid supply zone, strengthened by liquidity presence.
🔹 Trade Plan:
1️⃣ Wait for a liquidity sweep before entering.
2️⃣ Let the price tap into the supply zone.
3️⃣ Switch to a lower timeframe (5M or 15M) for precise entry confirmation.
4️⃣ Look for a Mitigation Block or Fair Value Gap (FVG) as an entry trigger.
⚠️ Risk Management is Key:
Always manage risk, avoid greed, and never trade blindly.
Stick to your plan, and let the market come to you.
Wishing you all the best & happy trading! 🚀📊 Thank you!
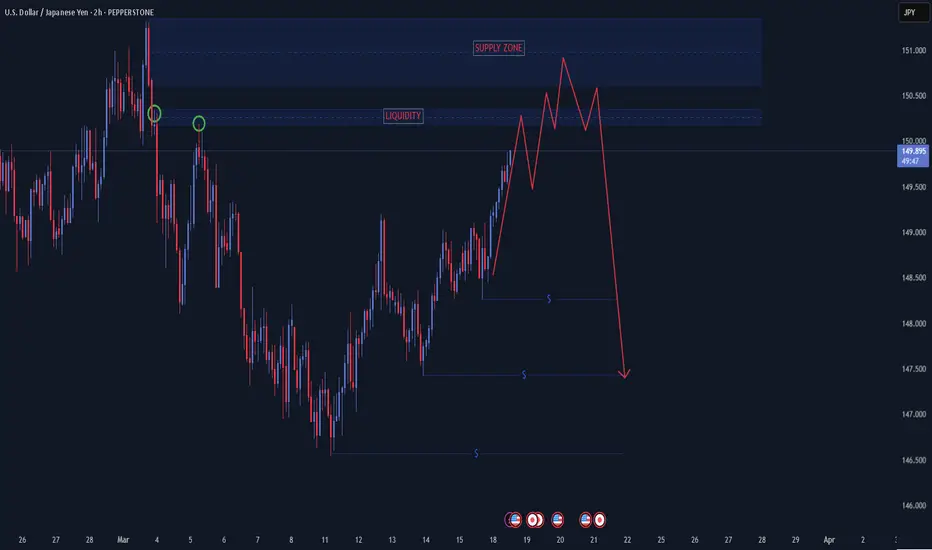
USDJPY Price ActionHello Traders,
I've marked a Liquidity Area and another Supply Zone on the chart. Here's what might happen next: after sweeping the liquidity, the price could touch the Supply Zone and then drop. Before acting on this, make sure you switch to either the 5-minute or 15-minute timeframe and clearly mark a Demand Zone there.
Wait patiently for the breakout. When the price breaks through that Demand Zone on the lower timeframe, set a pending order. Place your stop-loss at the recent swing high, and set your take profit at the next targeted Liquidity Level.
Many traders often wait for Fair Value Gaps (FVG), but this causes them to miss opportunities. Especially if you're struggling to pass trading challenges, give this method a try. Managing your risk carefully is the key to success.
Good luck and happy trading!
Thank you!
GBPCAD Price ActionHello Traders,
As you can see, I've marked the Demand Zone, based on the 2-hour timeframe. Additionally, I've highlighted Liquidity Levels, clearly distinguishing between those already swept and the valid ones remaining.
On the 15M timeframe, you'll notice I've marked the Breakout Block, also identified as the Supply Zone. If the price breaks this Supply Zone, you should set a pending order. There are two effective ways to enter this market: either through an FVG (Fair Value Gap) or a Breaker Block entry.
Your trade can be held for up to one day, with the stop-loss positioned at the recent swing low. Remember, it's crucial to manage your risk responsibly and avoid greed. This structure repeats itself consistently.
Wishing you the best and happy trading!
Thank you.

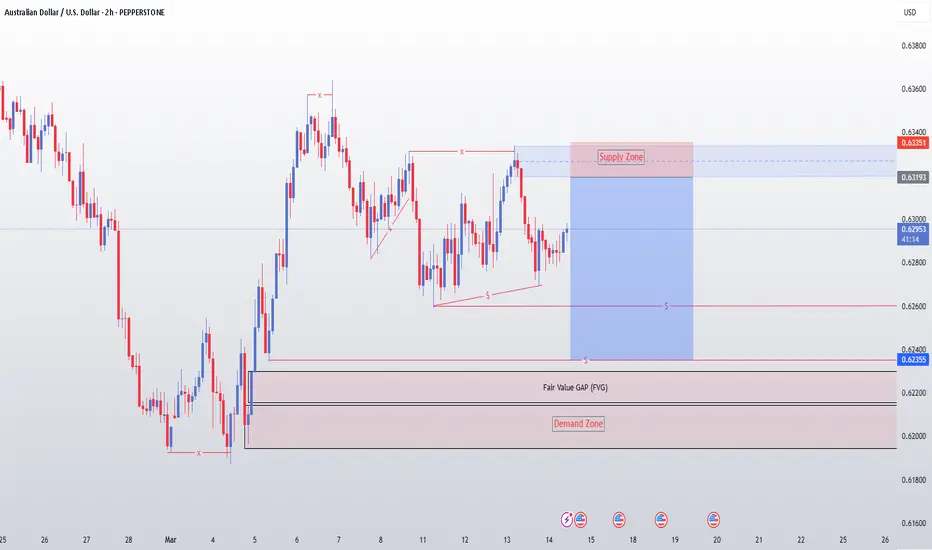
AUDUSD Price ActionHey traders! It's the last trading day of the week, so let's dive into some analysis on this pair.
We can see that price has grabbed liquidity on both the upside and downside. At the top, a new supply zone has formed, sweeping liquidity from the previous supply zone. On the flip side, there's also a demand zone where liquidity has been collected.
Right now, we’ve got internal liquidity on both sides, making this a solid area to look for trade opportunities. Aim for a 1:3 to 1:5 risk-to-reward ratio—stay disciplined and don't get greedy! Risk management is key.
Wishing you all a profitable day and a great weekend—use it to refine your analysis and come back stronger next week! 📊🔥 Happy trading! 🚀
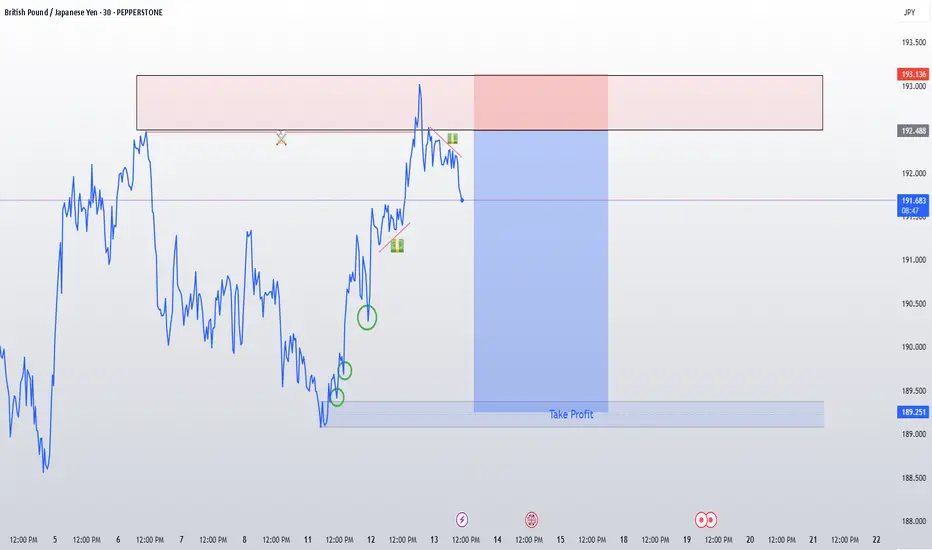
GBPJPY Price ActionHello Traders,
As you can see, I have marked the liquidity levels on the left-hand side where a liquidity sweep has already occurred. Additionally, I have identified a new liquidity area where the price is expected to sweep next. I have also marked the take profit area.
Furthermore, you can see other liquidity levels, which I have highlighted with circles. This pattern is also known as the QM Pattern or Head & Shoulders (HS) Pattern .
Don't forget to manage your risk and protect your balance. Market structure repeats itself over and over again.
Wishing you all the best and happy trading!
Thank you.