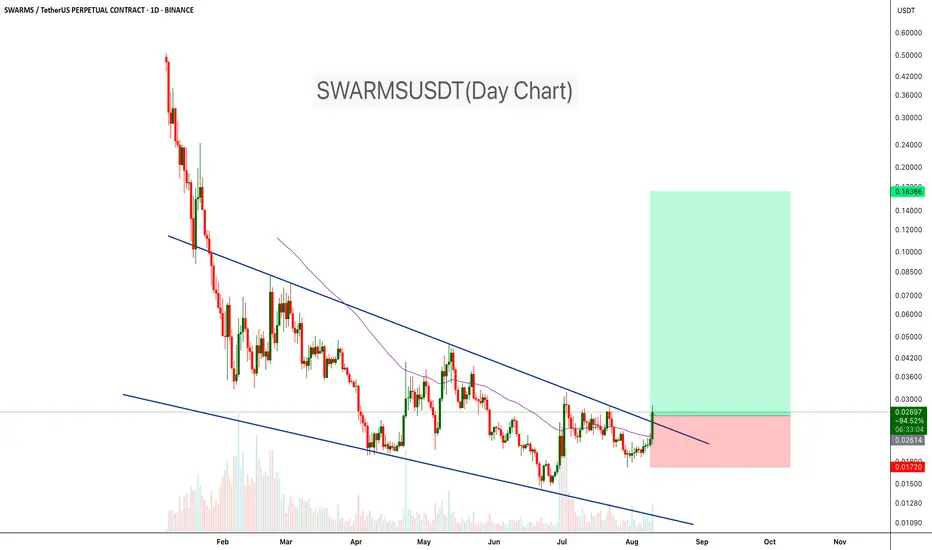
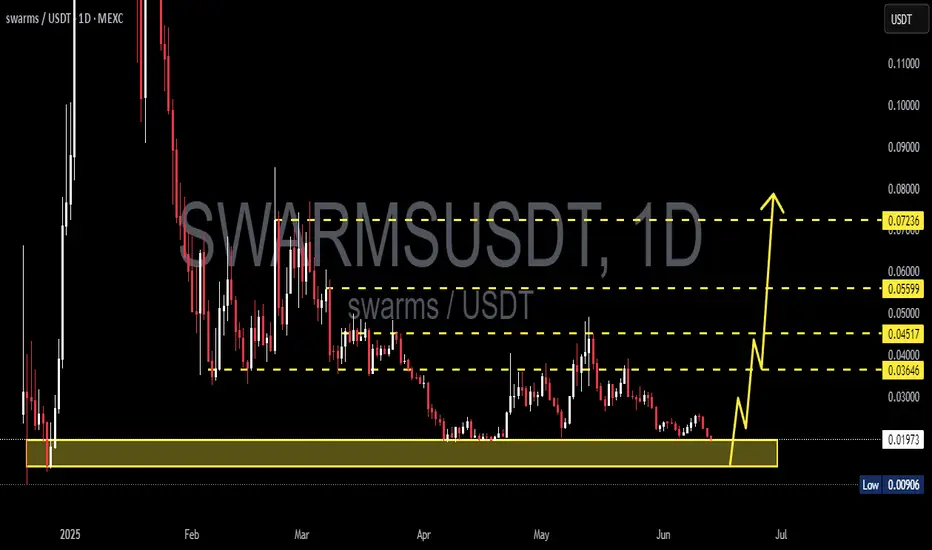
SWARMS Breaks Out of Descending ChannelSWARMSUSDT has been trading within a descending channel since February, with price consistently respecting both the upper resistance and lower support trendlines. Recently, the market broke above the channel’s resistance with a strong bullish candle, backed by a noticeable increase in buying volume. Once the breakout confirms, we can expect a 150%- 500% move in the coming weeks.
Resistance 1: $0.040
Resistance 2: $0.075
Resistance 3: $0.16
Support level: $0.017
Cheers
Hexa
Swarms
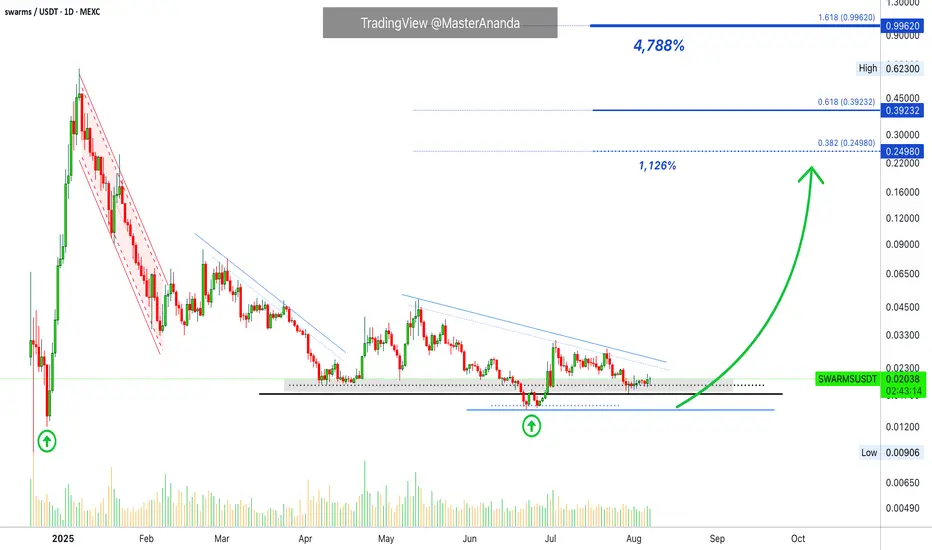
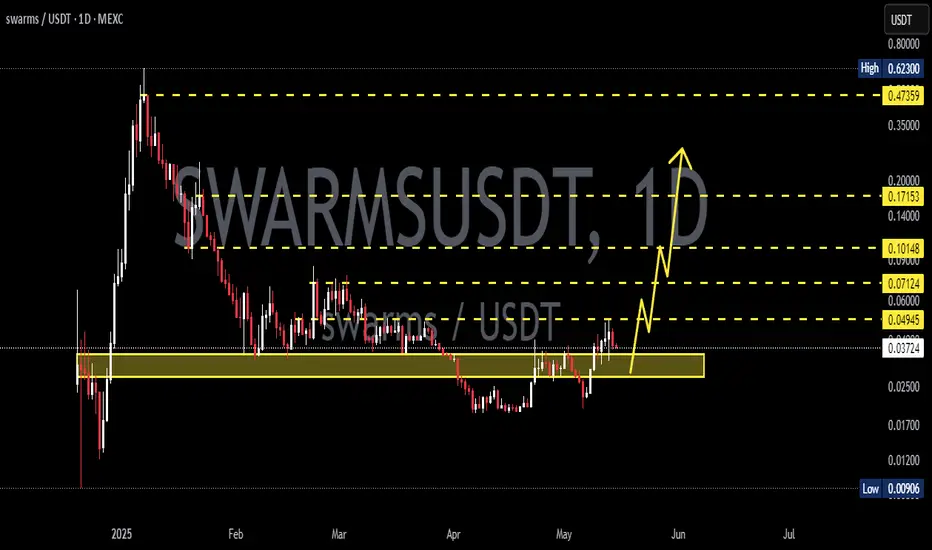
swarms · Opportunity Buy Zone · 1,100% - 4,700% Growth PotentialI like it. It might not look like it but this is a great chart. SWARMSUSDT is trading at bottom prices within the accumulation zone but with the possibility that the bottom is already gone. That is, no new shakeouts or lows. From here on, growth.
There was a low in April followed by a lower low in June. The lower low in June was nothing more than a liquidity hunt event. There is no real depth on that last low. Seeing how SWARMSUSDT is now trading back above support (the April low), opens up many bullish signals.
As long as SWARMS trades above 0.01900 you can be extremely bullish, the bulls are in control and have the upper-hand. Can start moving anytime.
Patience is key though.
Growth potential is huge because this is a small cap project. The numbers might seen big now but once the bullish euphoria is turned on, it will look and feel like an easy job. An easy job to grow 4,000%. Can be more but also less.
Namaste.
SWARMS can be a double digit crypto again.Low risk entry level --- if we assume the bull still has legs.
SWARMSUSDT 1D AnalysisSWARMS ~ 1D Analysis
#SWARMS , This trade is very high risk. Buy here with a short term target of at least 20%+ from this lowest support.
SWARMSUSDT 1D Analysis SWARMS ~ 1D Analysis
#SWARMS This trade is very high risk
Buy from here if you still have confidence in this coin with a short term target of at least 15%+ from here.
SWARMS Is Bulish (12H)A key flip zone on the SWARMS chart has been reclaimed.
The trigger line has been broken, and we have a bullish CH (Change of Character) on the chart.
As long as the flip zone holds, price may move toward the identified targets.
A daily candle close below the invalidation level would invalidate this analysis
Do not enter the position without capital management and stop setting
Comment if you have any questions
thank you

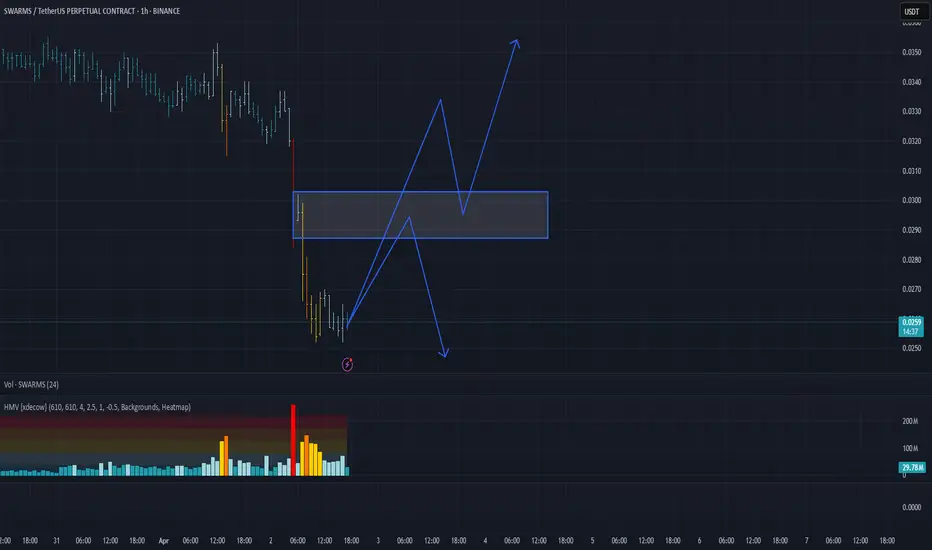
SWARMS/USDT Analysis: Continued DeclineThis asset continues its downward movement. A strong volume cluster has now formed, allowing for position building and participation in further movement.
We consider the $0.0287–$0.0302 zone as a short opportunity upon its retest, provided there is a seller reaction.
If no reaction occurs and price consolidates above this zone, we will view it as a mirror support level.
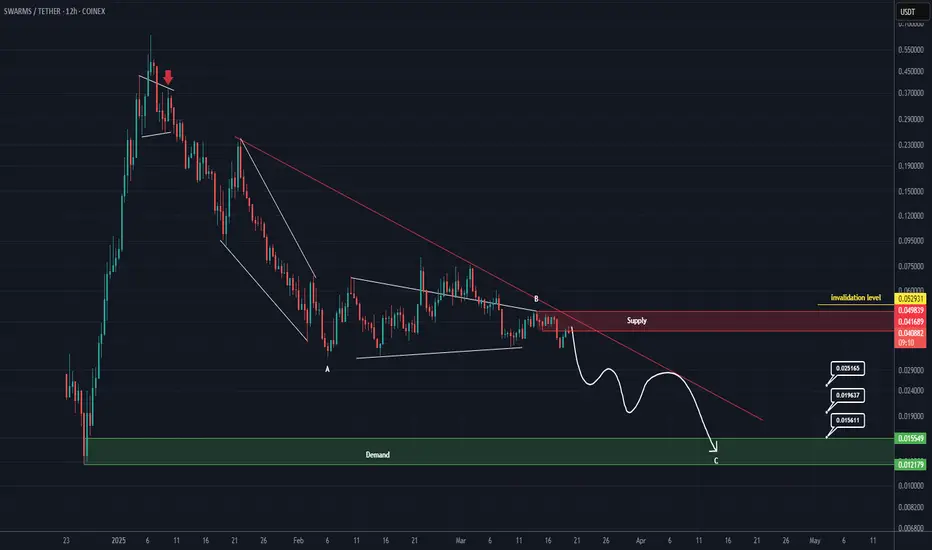
Short opportunity for SWARMS (8H)The correction of SWARM has started from the point where we placed the red arrow on the chart.
It appears that wave B has just completed, and the price is currently forming a pivot for another drop.
We expect to enter wave C soon, with the price moving towards the targets.
The closure of a daily candle above the invalidation level will invalidate this analysis.
For risk management, please don't forget stop loss and capital management
When we reach the first target, save some profit and then change the stop to entry
Comment if you have any questions
Thank You
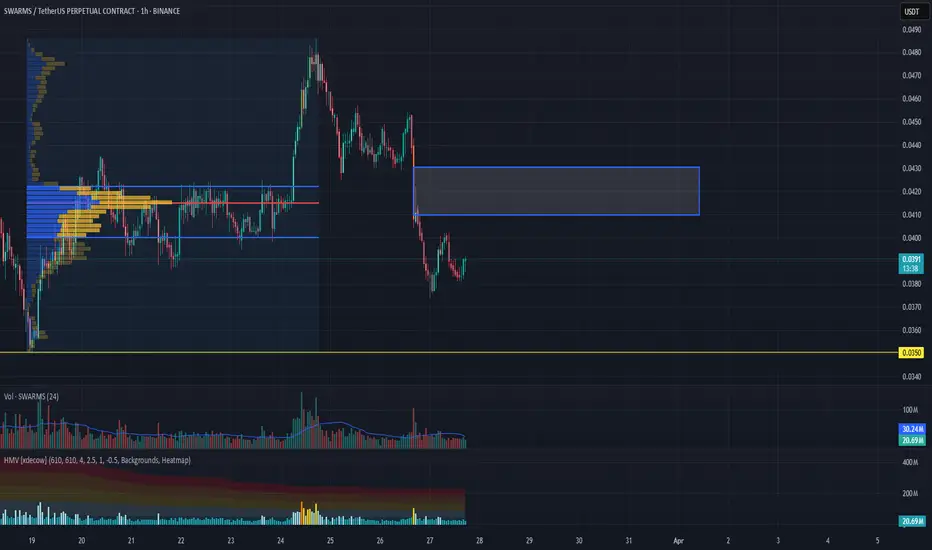
SWARMS/USDT Analysis. Short Toward the Current LowFor this asset, we are considering a speculative short position. We have tested a key volume zone but observed no bullish reaction. Instead, selling pressure has increased.
If the $0.41-$0.43 zone is retested and a reaction occurs, we will enter a short position with a target at the $0.35 level.
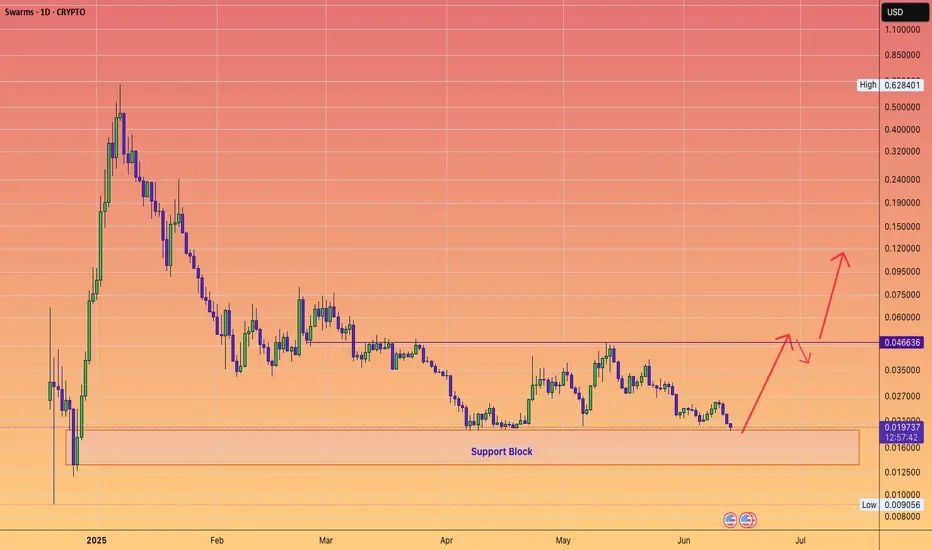
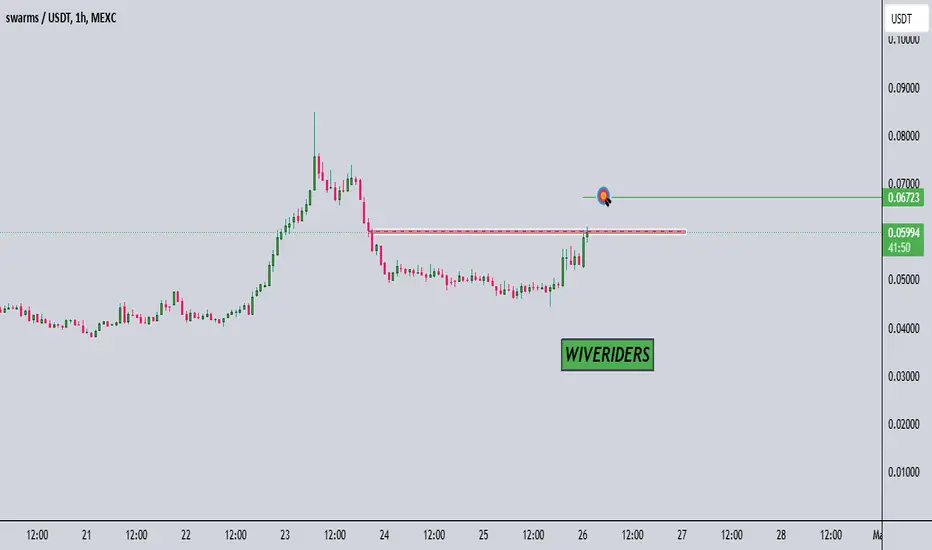
$SWARMS ANALYSIS! $SWARMS is testing the red resistance zone 🟥.
✅ If breakout is successful, the first target is the green line level 🟩.
SWARMS ANALYSIS! SWARMS is testing the red resistance zone 🟥. If it breaks out, the first target is the green line level 🟩.
📢 Join me for more trade setups!

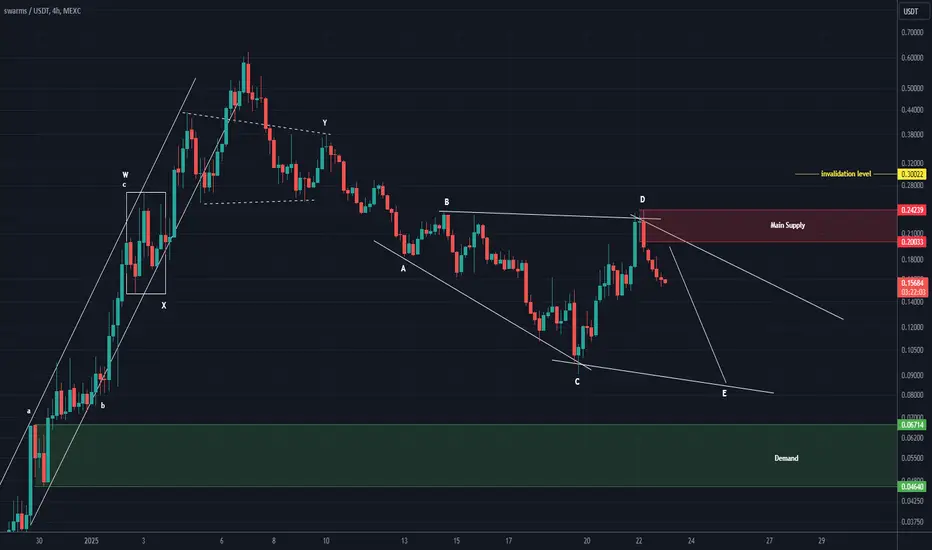
SWARM looks bearish (4H)It appears to be forming a diamond-shaped diametric pattern and is currently in wave E of this diametric.
The main supply zone has been marked on the chart.
Wave E is expected to drop to the lower areas.
A daily candle closing above the invalidation level will invalidate this analysis.
For risk management, please don't forget stop loss and capital management
Comment if you have any questions
Thank You