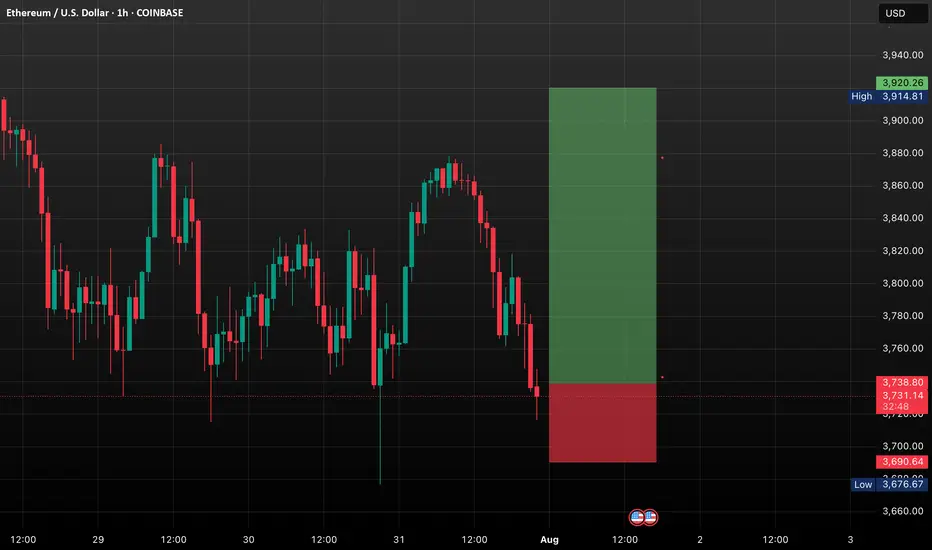
ETH BREAKOUT IMMINENT?Ethereum is currently trading around $3,726, holding just above key support levels, including the 50-day SMA and the psychological $3,700 zone. Despite a minor pullback, ETH continues to show signs of bullish strength and remains in a healthy uptrend.
Momentum indicators like RSI and volume show signs of recovery, and ETH is forming a bullish continuation pattern near resistance. If Ethereum can break above the $3,820–$3,850 zone, we are likely to see a quick push toward higher levels.
Ethereum is showing solid strength after consolidating above $3,700. The breakout attempt toward $3,850 will be critical. If bulls push through this level with volume confirmation, a move toward $3,900 and then $4000 becomes highly probable.
The market structure is constructive, and the presence of ETF-driven institutional demand adds further bullish pressure. While short-term volatility may create minor pullbacks, the medium-term setup favors upward continuation.
Swingtrading
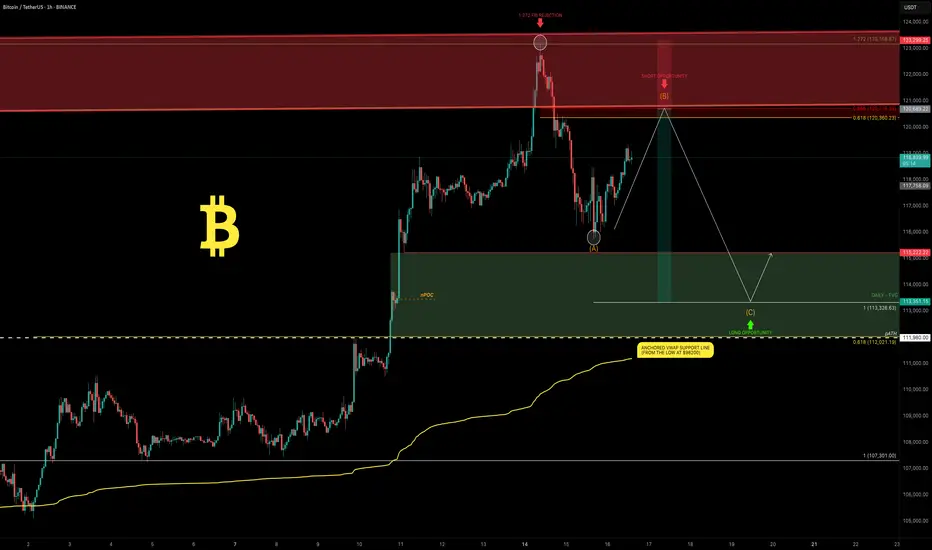
Bitcoin: New All-Time High — What’s Next?Bitcoin had an incredible run, breaking the old all-time high ($111,980) with strong bullish momentum and setting a fresh ATH at $123,218 (Binance). We just witnessed the first major corrective move of ~6% and a decent bounce so far — but the big question is:
What’s next? Will Bitcoin break higher over the summer or form a trading range here?
Let’s dive into the technicals.
🧩 Higher Timeframe Structure
May–June Range:
BTC was stuck between $110K–$100K, forming an ABC corrective pattern. Using trend-based Fib extension (TBFE) from A–B–C:
✅ C wave completed at $98,922 (1.0 TBFE)
✅ Upside target hit at $122,137 (-1 TBFE)
Full Bull Market TBFE:
➡️ 1.0 → $107,301 → previously rejected
➡️ 1.272 → $123,158 → recent rejection zone
Pitchfork (log scale):
➡️ Tapped the upper resistance edge before rejecting.
Previous Bear Market Fib Extension:
➡️ 2.0 extension at $122,524 hit.
2018–2022 Cycle TBFE:
➡️ 1.618 at $122,011 tapped.
Macro Fibonacci Channel:
➡️ Connecting 2018 low ($3,782), 2021 ATH ($69K), 2022 low ($15,476) →
1.618–1.666 resistance band: $121K–$123.5K.
✅ Conclusion: Multiple fib confluences mark the $122K–$123K zone as critical resistance.
Daily Timeframe
➡️ FVG / Imbalance:
Big daily Fair Value Gap between the prior ATH and $115,222 swing low.
BTC broke the prior ATH (pATH) without retest → a pullback to this zone is likely.
Lower Timeframe / Short-Term Outlook
We likely saw a completed 5-wave impulse up → now correcting.
The -6% move was probably wave A, current bounce = wave B, next leg = wave C.
➡ Wave B short zone: $120K–$121K
➡ Wave C target (1.0 TBFE projection): ~$113,326
➡ Confluence at mid-FVG + nPOC
Trade Setups
🔴 Short Setup:
Entry: $120,300–$121,000
Stop: Above current ATH (~$123,300)
Target: $113,500
R:R ≈ 1:2.3
🟢 Long Setup:
Entry: Between Prior ATH and $113,000
Stop: Below anchored VWAP (~$110,500)
Target: Higher, depending on bounce confirmation.
🧠 Educational Insight: Why Fibs Matter at Market Extremes
When markets push into new all-time highs, most classic support/resistance levels disappear — there’s simply no historical price action to lean on. That’s where Fibonacci extensions, channels, and projections become powerful tools.
Here’s why:
➡ Fibonacci extensions (like the 1.272, 1.618, 2.0) help estimate where trend exhaustion or profit-taking zones may appear. They are based on the psychology of crowd behavior, as traders anchor expectations to proportional moves from previous swings.
➡ Trend-Based Fib Extensions (TBFE) project potential reversal or continuation zones using not just price levels, but also the symmetry of prior wave moves.
➡ Fibonacci channels align trend angles across multiple market cycles, giving macro context — like how the 2018 low, 2021 ATH, and 2022 low project the current 1.618–1.666 resistance zone.
In short:
When you don’t have left-hand price history, you lean on right-hand geometry.
That’s why the $122K–123K zone wasn’t just random — it’s a convergence of multiple fib levels, cycle projections, and technical structures across timeframes.
⚡ Final Thoughts
Bitcoin faces major resistance around $122K–$123K backed by multiple fib and structural levels. A retest of the prior ATH zone (~$112K–$113K) looks probable before the next big directional move. Watch lower timeframe structure for signs of completion in this corrective phase.
_________________________________
💬 If you found this helpful, drop a like and comment!
Want breakdowns of other charts? Leave your requests below.
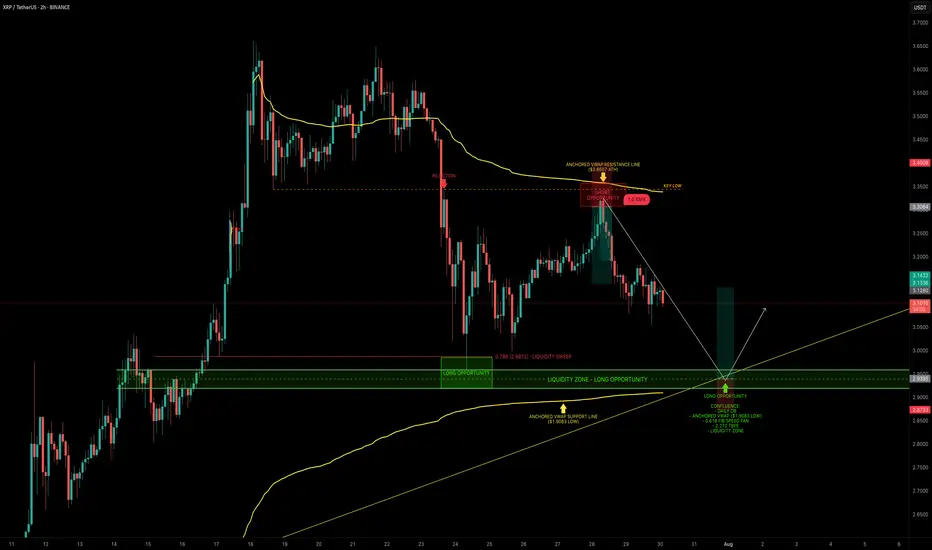
XRP — Mapping Out the Next High-Probability Long SetupXRP continues to respect key levels, delivering clean setups and strong technical reactions.
📉 Recent Price Action Recap
After the flush from $3.65 into the $3.00 support zone, XRP printed a solid bounce back toward the $3.30 resistance area, forming a clean short setup between $3.30–$3.35.
Price is now trading mid-range within the 6-day consolidation.
🟢 Next High-Probability Long Setup
A prime long opportunity lies between $2.96 and $2.9175 sitting within a key daily order block.
Confluence at this zone includes:
Liquidity pool just below the $2.9555 swing low
Anchored VWAP from the $1.9083 swing low resting just under the block
0.618 Fib Speed Fan lining up as dynamic support (July 30 – Aug 2)
2.272 Trend-Based Fib Extension at $2.9297
📈 Long Trade Setup
Entry Zone: $2.96 – $2.9175
Stop Loss: Below anchored VWAP (clear invalidation)
Target: $3.1/$3.13+
R:R: ~1:3+
💡 Educational Insight
This setup is a great example of how multiple tools layered together (like Fibonacci levels, VWAPs, order blocks and liquidity zones) can significantly increase the probability of a trade playing out.
When structure, volume-based tools and time alignment all point to the same area, it creates a high-confluence trade zone. These are the areas where risk is most defined and reward is most favourable, a principle every technical trader should anchor their strategy around.
_________________________________
💬 If you found this helpful, drop a like and comment!
Want breakdowns of other charts? Leave your requests below.
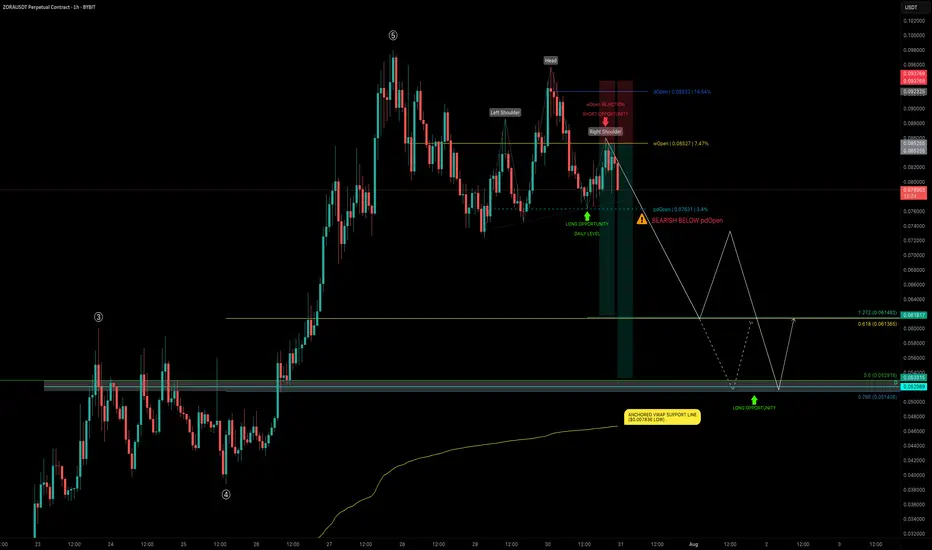
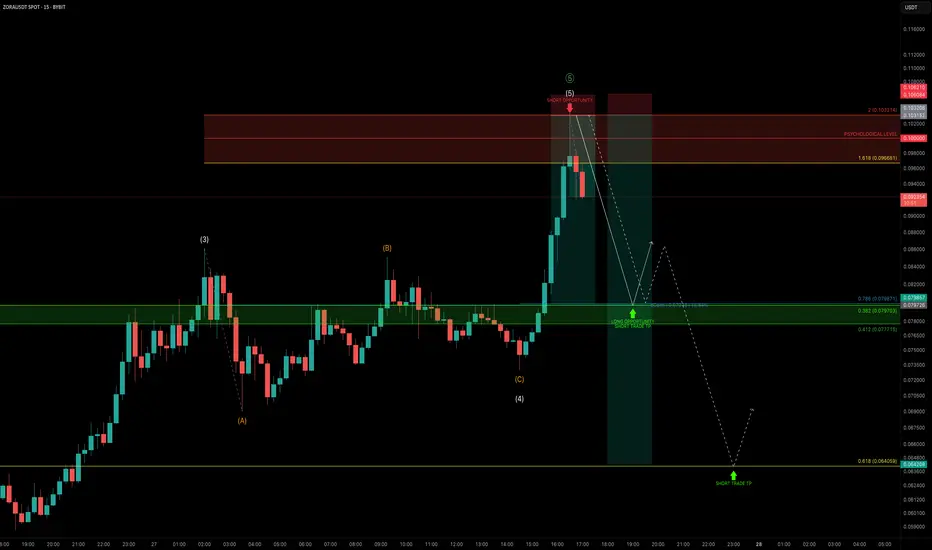
ZORA 5-Wave Completion — 30% Crash Incoming?After exploding +1150% in just 20 days and completing all 5 waves, ZORA is now consolidating — trading sideways just under the $0.10 psychological level for the past 4 days.
📉 Current Market Structure
The current structure shows signs of a developing Head & Shoulders pattern, with price:
Trading below the daily open (dOpen) and weekly open (wOpen) → Bearish signs
Hovering near the prior daily open (pdOpen) → a breakdown here would confirm bearish continuation
🔴 Short Setup - Bearish Scenario
If ZORA breaks below pdOpen, we’re likely heading for:
0.618 Fib retracement at $0.06137 of the final wave 5
Confluence with 1.272 Trend-Based Fib Extension (TBFE) at $0.06148
This zone marks the next high-probability reaction point and a potential long opportunity if price shows a bounce or reversal.
📉 Overall Short Trade Target
The full retracement target sits between $0.0529 and $0.0514, offering multiple layers of confluence:
0.5 Fib retracement of the full 1150% move
0.786 Fib retracement of the final wave 5
Aligned with an old trading range and daily level
This makes it an ideal demand zone for patient bulls but only once price confirms.
💡 Educational Insight
This setup highlights an example of Elliott Wave Theory in action — after a strong 5-wave impulse move, markets often enter a corrective phase. The completion of wave 5, especially near key psychological levels like $0.10, often marks a local top, where price corrects toward key Fibonacci retracement zones.
Combining wave structure with confluence factors like Fib levels, VWAP, and prior trading ranges helps traders identify high-probability reversal zones — allowing for better timing, risk management, and trade planning. Always wait for confirmation before jumping into any trades.
Summary
Bearish continuation confirmed on pdOpen breakdown
First support zone: $0.0613–$0.0614
Final downside target: $0.0529–$0.0514
Look for long opportunities only on reaction + confirmation
_________________________________
💬 If you found this helpful, drop a like and comment!
Want breakdowns of other charts? Leave your requests below.
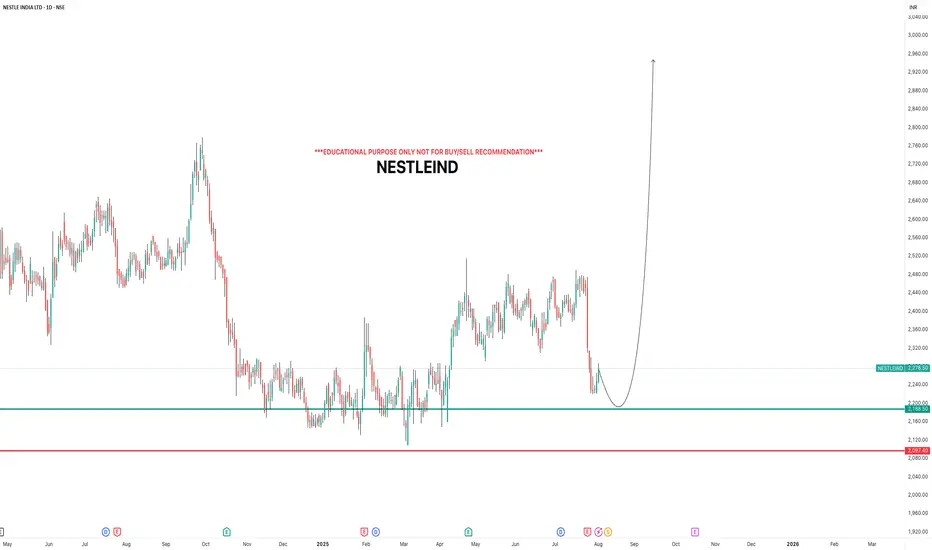
NESTLEINDIAi Observed these Levels based on Price Action and Demand & Supply which is my own Concept "PENDAM CONCEPTS"... Please don't take any trades based on this chart/post... Because this chart is for educational purpose only not for Buy or Sell Recommendation... Thank Q
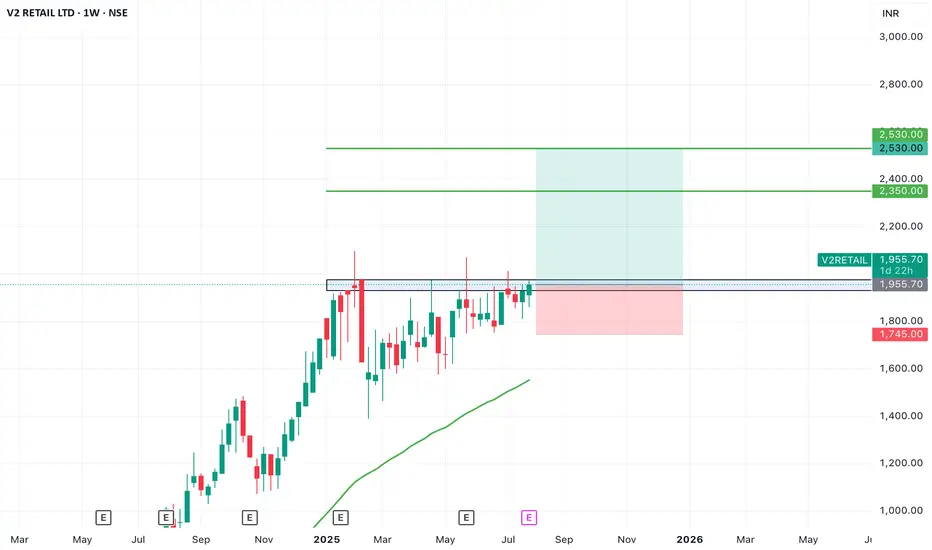
SWING IDEA - V2 RETAILV2 Retail , a small-cap value fashion retailer with a pan-India presence, is showing strong bullish momentum and a textbook swing trade setup backed by multiple breakout signals.
Reasons are listed below :
Breakout from a VCP (Volatility Contraction Pattern) – indicating accumulation and strength
Ascending triangle breakout – classic continuation pattern
Cleared major resistance zone, confirming bullish intent
Maintains a clear uptrend with higher highs and higher lows
Target - 2350 // 2530
Stoploss - weekly close below 1745
DISCLAIMER -
Decisions to buy, sell, hold or trade in securities, commodities and other investments involve risk and are best made based on the advice of qualified financial professionals. Any trading in securities or other investments involves a risk of substantial losses. The practice of "Day Trading" involves particularly high risks and can cause you to lose substantial sums of money. Before undertaking any trading program, you should consult a qualified financial professional. Please consider carefully whether such trading is suitable for you in light of your financial condition and ability to bear financial risks. Under no circumstances shall we be liable for any loss or damage you or anyone else incurs as a result of any trading or investment activity that you or anyone else engages in based on any information or material you receive through TradingView or our services.
@visionary.growth.insights
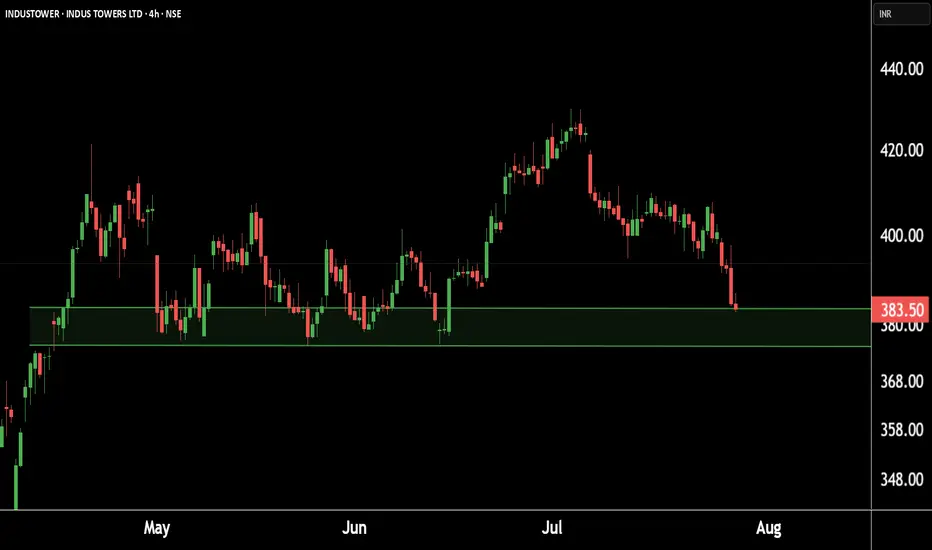
Indus Towers showing strength at key levels!Eyes on a potential.This is the 4 hour chart of INDUSTOWER.
INDUSTOWER having a good Support level near at 370-375.
if this level is sustain , then we may see higher prices in INDUSTOWER.
Thank You !!
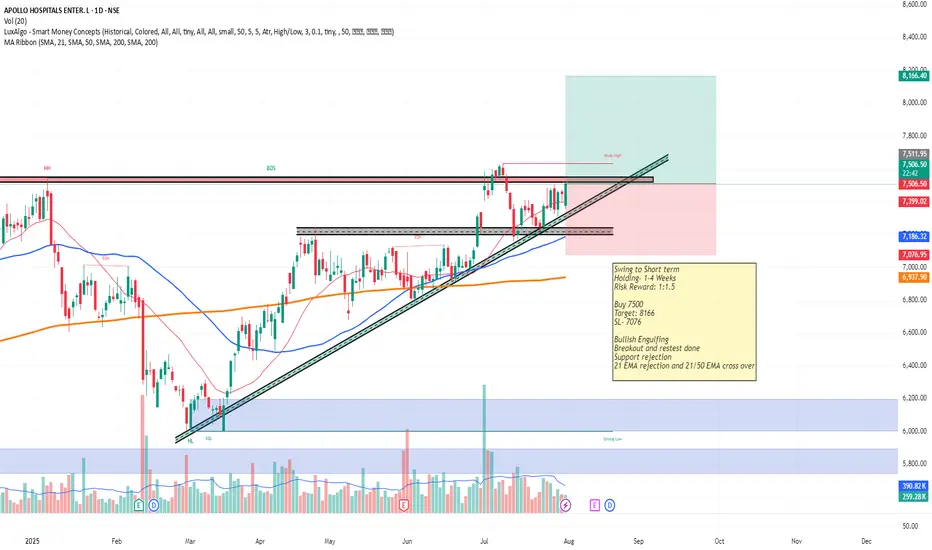
Apollo Hospital- Bullish Swing-Short, Breakout expected!!Swing to Short term
Holding- 1-4 Weeks
Risk Reward: 1:1.5
Buy 7500
Target: 8166
SL- 7076
Bullish Engulfing
Breakout and restest done
Support rejection
21 EMA rejection and 21/50 EMA cross over
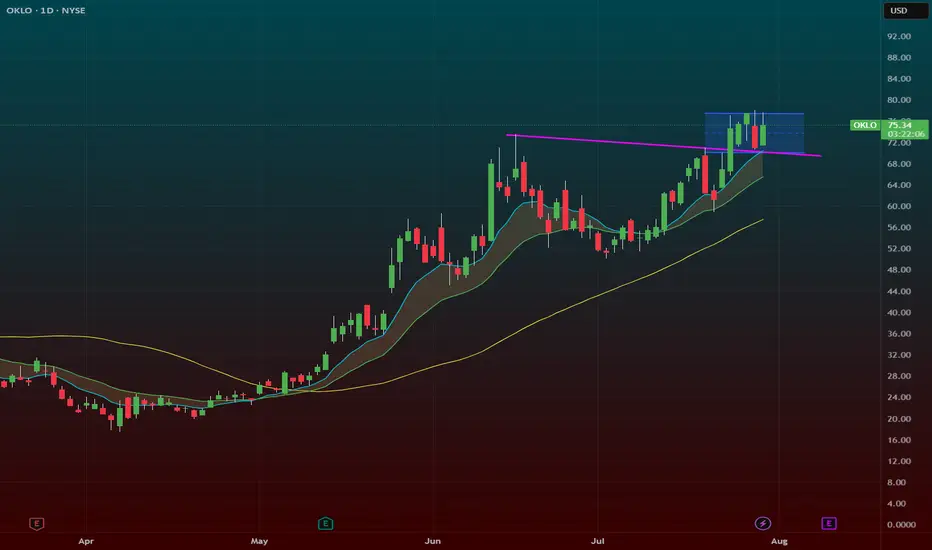
$OKLO – Back to the Moneymaker: HTF + C&H Combo at $77.50NYSE:OKLO – Back to the Moneymaker: HTF + C&H Combo at $77.50
Back to my bread and butter setup — NYSE:OKLO is setting up again, and it’s 🔥. We’ve got a high tight flag forming right above the 9 EMA, and to sweeten the deal, there’s a cup and handle structure layered in too.
🔹 The Setup:
After a strong breakout, NYSE:OKLO has spent the past week consolidating tightly above the 9 EMA.
Price action is coiled, volume has dried up — exactly what I want to see before a power move.
This is a high tight flag + cup and handle combo, one of my favorite high-probability setups.
🔹 Trigger Level:
Watching the $77.50 breakout zone — that’s the line in the sand. If you get a good intraday dip to support you can pre-empt the play i like to often scale in a half in anticipation if the market is in a runup phase
A clean push through with volume, and this can speed up fast.
🔹 My Trade Plan:
1️⃣ Entry: Either starter near 9 EMA support or confirmation on breakout over $77.50.
2️⃣ Stop: Under the 9 EMA — no reason to stay if it breaks down.
3️⃣ Target: Measured move extension if it clears $77.50 with juice.
Why I Love This Setup:
HTF + C&H = momentum fuel
This name has already proven itself — we’ve made money here before
The structure, the consolidation, and the setup are all textbook
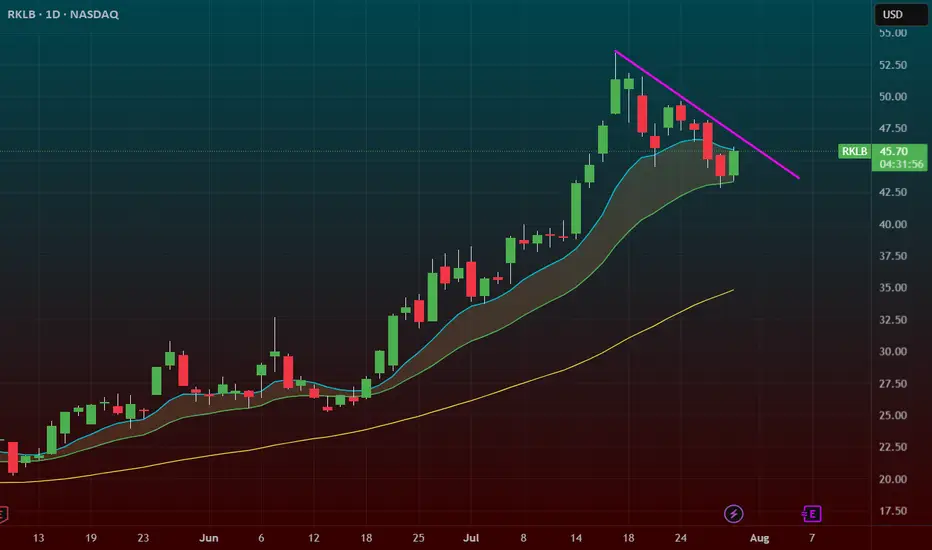
$RKLB – Momentum Pullback to 20 SMA with Trendline Break IncominRocket Lab ( NASDAQ:RKLB ) is setting up for a classic trend continuation move after a strong run. It just pulled back to the 20 SMA for the first time since breaking out over $35 — and it’s holding like a champ.
🔹 The Setup:
After peaking near $55, price pulled back in an orderly fashion on lower volume — a healthy correction.
Now we’ve got a hold at the 20 SMA, with a close back over the 9 EMA and a trendline break in progress.
This is where momentum tends to re-ignite.
🔹 Why It’s Powerful:
First 20 SMA test since the breakout = high probability bounce zone.
Lower volume on the pullback signals no panic selling.
A close over the 9 EMA + trendline = potential speed-up candle.
🔹 My Trade Plan:
1️⃣ Entry: Looking for confirmation over the 9 EMA and trendline.
2️⃣ Stop: Under the 20 SMA — tight structure, defined risk.
3️⃣ Target: Retest of highs near $55 with potential extension on breakout.
Why I Love This Chart:
NASDAQ:RKLB is a momentum name — when it moves, it moves fast.
The trend is intact, the pullback was clean, and now we have structure + volume setup.
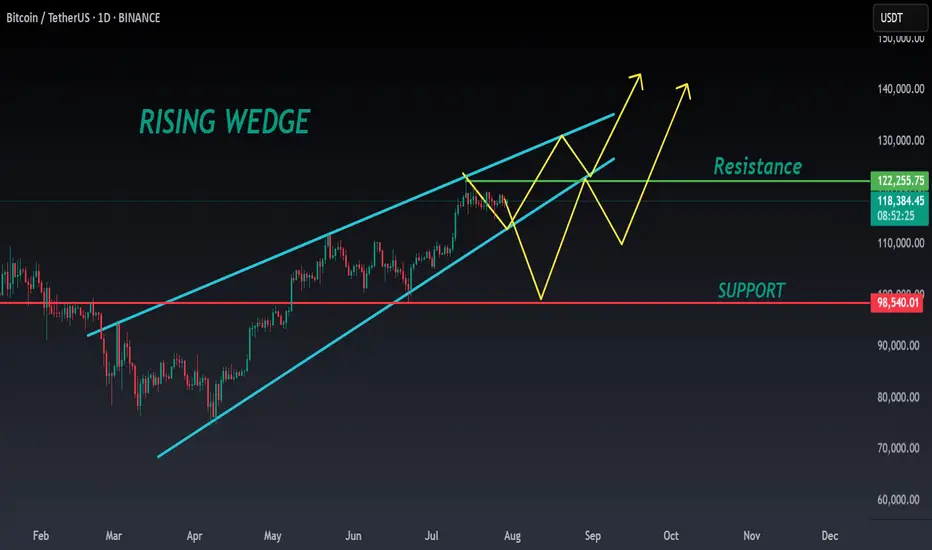
BTC ANALYSIS🔮 #BTC Analysis 💰💰
🌟🚀As we said #BTC performed same. Now, In daily chart we can see a formation "Rising Wedge Pattern in #BTC. There is a strong resistance zone and we could see a rejection from that level but if the price breaks the resistance zone then we would see a bullish move 💲💲
🔖 Current Price: $1,18,590
⁉️ What to do?
- We have marked some crucial levels in the chart. We can trade according to the chart and make some profits in #BTC. 🚀💸
#BTC #Cryptocurrency #DYOR #PotentialBreakout
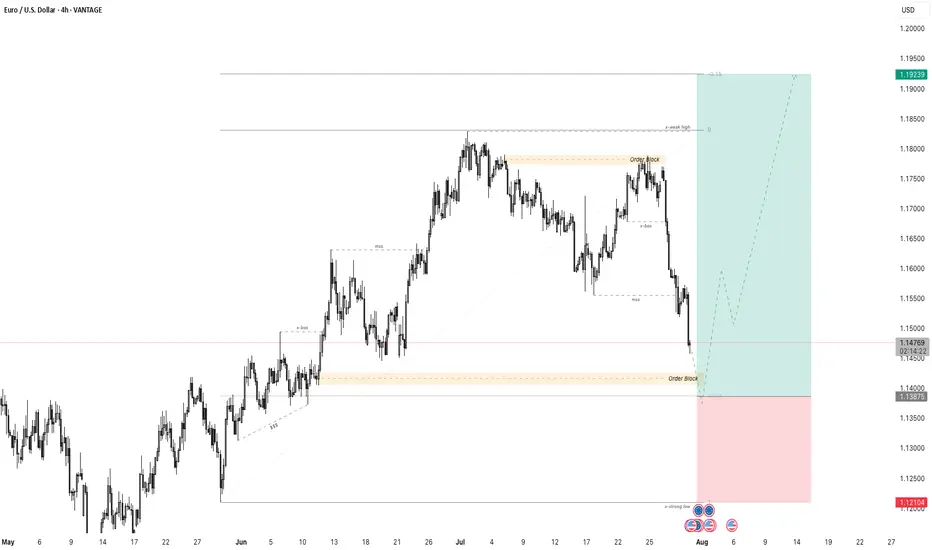
EURUSD - 4-Hour Chart with Order Block Reversal StrategyThe EUR/USD 4-hour chart shows a significant bearish retracement approaching a well-defined order block zone, which represents a potential strong support area where major buyers may step in.
Price has experienced a clear downtrend following a break of structure (BOS) from the recent high near 1.18000 into the order block area around 1.13900 - 1.14150. This order block acts as a demand zone where smart money is anticipated to accumulate buy orders, making it a critical level to watch for potential market reversal.
The trading plan anticipates price will test this order block support and generate bullish reversal signals such as price rejection candlesticks or increased buying volume. Confirmation at this zone sets up a potential long trade aiming for a significant retracement to the previous weak high near 1.19200, targeting a strong risk-to-reward opportunity.
Risk management is vital, placing stop losses just below the lower boundary of the order block to protect against false breakouts or further downside continuation.
This plan combines market structure analysis, smart money concepts of order blocks, and technical confirmation to capture a high-probability reversal trade. Traders should patiently wait for clear reversal signals before entry and monitor price action closely within the order block for optimal trade timing.
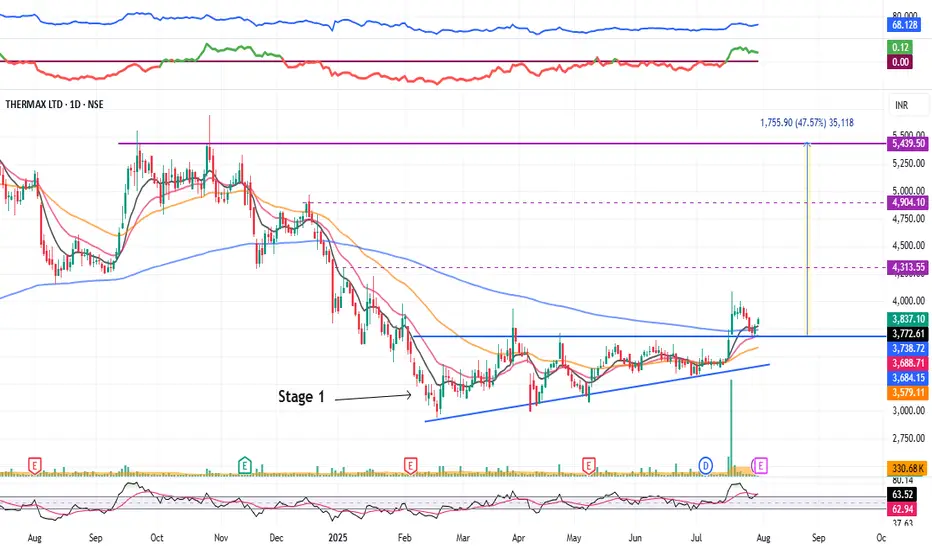
Thermax : Stage 1 Breakout (1-3 Months)#Thermax #stage1nreakout #ascendingtrianglepattern #patternbreakout #trendingstock #swingTrading
Thermax : Swing Trading
>> Stage 1 Breakout + Retest done
>> Ascending Triangle @ bottom of Downtrend
>> Trending setup in stock
>> Good strength & Recent Volume Buildup
>> Low Risk High Reward Trade
Swing Traders can lock profit at 10% and keep trailing
Pls Boost, comment & Follow for more Analysis
Disc : Charts Shared are for Learning Purpose & not a Trade recommendation. Pls consult a SEBI Registered Advisor before taking position in it
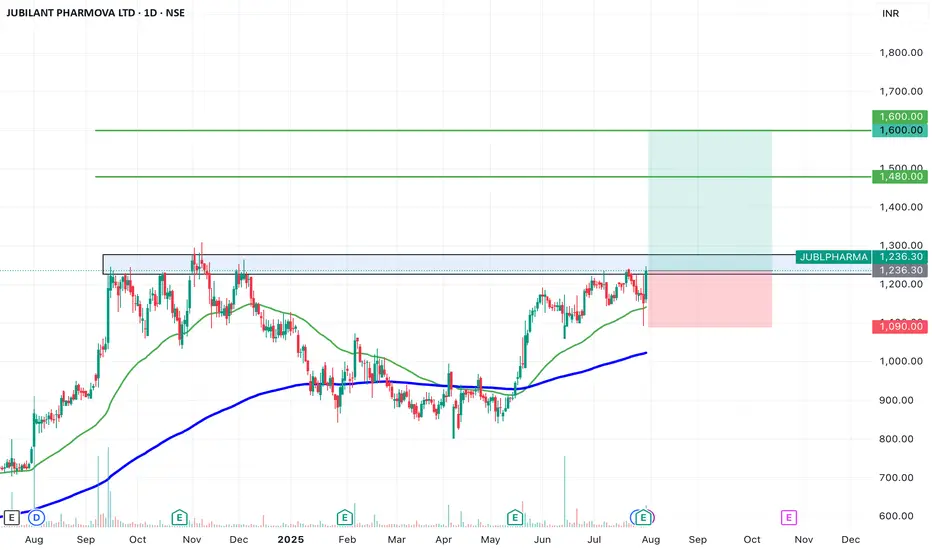
SWING IDEA - JUBILANT PHARMOVAJubilant Pharmova , a diversified pharmaceutical company focused on CRAMS and specialty pharma, is presenting a strong swing opportunity backed by a major pattern breakout and volume confirmation.
Reasons are listed below :
Breakout from an Inverted Head & Shoulders pattern after over a year of consolidation
Attempting breakout above 1250, a key resistance zone with multiple rejections in the past
Strong marubozu candle on the daily chart with a notable volume spike, signaling conviction
Trading near all-time highs, and comfortably above key EMAs, reinforcing trend strength
Target : 1480 // 1600
Stoploss : weekly close below 1090
DISCLAIMER -
Decisions to buy, sell, hold or trade in securities, commodities and other investments involve risk and are best made based on the advice of qualified financial professionals. Any trading in securities or other investments involves a risk of substantial losses. The practice of "Day Trading" involves particularly high risks and can cause you to lose substantial sums of money. Before undertaking any trading program, you should consult a qualified financial professional. Please consider carefully whether such trading is suitable for you in light of your financial condition and ability to bear financial risks. Under no circumstances shall we be liable for any loss or damage you or anyone else incurs as a result of any trading or investment activity that you or anyone else engages in based on any information or material you receive through TradingView or our services.
@visionary.growth.insights
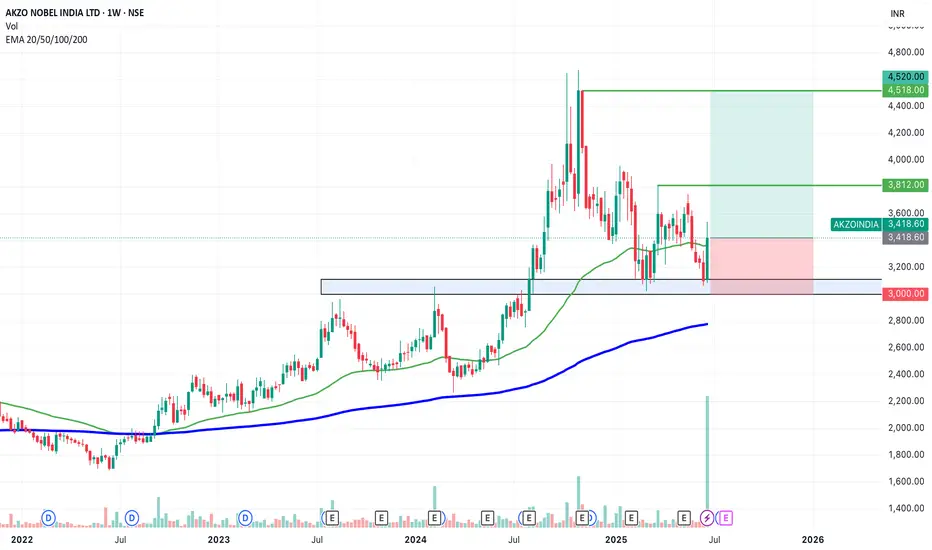
SWING IDEA - AKZO NOBEL INDIA Akzo Nobel India , a subsidiary of the global paints and coatings giant AkzoNobel N.V., is a leading player in India’s decorative and industrial paints market. Known for its premium brand Dulux , the company has strong brand recall, a wide distribution network, and consistent profitability.A strong brand, steady margins, and a bullish chart make this a candidate to watch for a short- to medium-term swing trade.
Reasons are listed below :
Bullish engulfing candle spotted on the weekly timeframe, signaling a potential trend reversal.
Accompanied by the highest-ever volume spike, adding strong conviction to the move.
Price is bouncing off the golden Fibonacci support (0.618), a classic retracement zone where strong reversals often occur.
The level of 3100 acted as a solid support.
The stock is trading above its 50 & 200 EMA on the weekly chart — a sign of long-term strength.
Target - 3812 // 4520
Stoploss - weekly close below 3000
DISCLAIMER -
Decisions to buy, sell, hold or trade in securities, commodities and other investments involve risk and are best made based on the advice of qualified financial professionals. Any trading in securities or other investments involves a risk of substantial losses. The practice of "Day Trading" involves particularly high risks and can cause you to lose substantial sums of money. Before undertaking any trading program, you should consult a qualified financial professional. Please consider carefully whether such trading is suitable for you in light of your financial condition and ability to bear financial risks. Under no circumstances shall we be liable for any loss or damage you or anyone else incurs as a result of any trading or investment activity that you or anyone else engages in based on any information or material you receive through TradingView or our services.
@visionary.growth.insights
Market Outlook: Bulls are still in control, but be defensive.At theses levels don't let your guard down. I could see us pulling back next week, meanwhile we may continue to stay above the 10-EMA for now.

ZORA — Parabolic Rally Nearing ExhaustionZORA has been on an explosive run, pumping +1239% in just 20 days. But after such a vertical move, the question is:
Is this rally nearing exhaustion?
Let’s dive into the technicals 👇
🧩 Elliott Wave Structure
Looking at price action through the lens of Elliott Wave Theory, ZORA appears to be completing its 5th wave:
➡️ Wave 3–4 zone: Held around the $0.05 trading range
➡️ Wave 5: Now pushing into the $0.097–$0.103 zone
This area aligns with:
The 1.618–2.0 Fib extension pocket — a typical exhaustion zone for wave 5s
The $0.10 psychological level
🔴 Short Trade Setup
This zone between $0.097–$0.103 is the ideal reversal area to consider shorting, with clearly defined targets and confluence:
Entry: $0.097 – $0.103
Stop-Loss: Above the 2.0 Fib Extension
TP1: Around $0.08
TP2: Around $0.064
Confluence: TP1
Daily Open (dOpen)
0.786 Fib of the local move
0.382 Fib of the 5-wave structure
TP2 (Lower Target):
0.618 Fib retracement of the 5-wave move at $0.064
Risk-to-Reward:
TP1 gives an R:R of 1:8
TP2 offers potential 1:13+
Watch for signs of weakness.
_________________________________
💬 If you found this helpful, drop a like and comment!
Want breakdowns of other charts? Leave your requests below.
AMD coiling to $148-160 range by post-earnings- NASDAQ:AMD is one of the beaten down names. It's not too cheap at the current valuation but it's growth for upcoming 2-3 years are promising which deserves a higher multiple.
- 25%+ growth rate when revenue is in billions is a big deal unlike NASDAQ:PLTR which has high 20s % growth rate on a revenue of 250 mil a quarter.
- Technical supports strong rebound to 148-160 range to test 200 SMA. Good setup for Q1 2025.
- Downside risk is to 94-105 if it continues to meltdown.

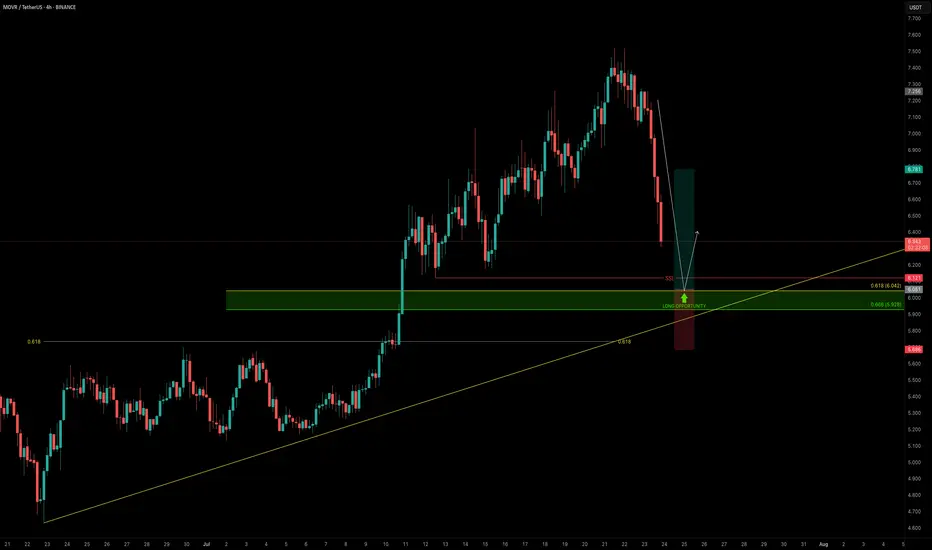
MOVR — Buying the Dip Into Confluence SupportAs the broader market pulls back, it’s the perfect time to scan for high-conviction long setups — and MOVR stands out.
Price is approaching a strong confluence support zone, offering a solid long opportunity.
🧩 Key Technicals
➡️ Liquidity Pool Below the Low:
There’s a visible liquidity pocket just beneath the swing low at $6.121 — an area where stop hunts and reversals are likely.
➡️ Fib & Speed Fan Confluence:
0.618 Fib retracement from the recent move aligns at $6.042
0.618 Speed Fan level also intersects the zone
Together, they form a technical floor right at the $6 psychological level
🟢 Long Trade Setup
Entry: $6.042
Stop-loss: $5.685 (below structure & liquidity sweep)
Target (TP): $6.78
R:R: ≈ 1:2+
Plan: Wait for price to fill into the zone and monitor for a bullish reaction (e.g., SFP, bullish structure reclaim)
💡 Why It Matters: Confluence Builds Confidence
When multiple tools — fib retracement, speed fan, liquidity pools, and psychological round numbers — all line up, it increases the probability of a strong reaction.
This is how smart money builds positions — not by chasing pumps, but by entering where others panic.
Final Thoughts
MOVR is approaching a clean, high-probability buy zone just below $6.00.
If the level holds and confirms with price action, this setup offers a solid R:R and a clear invalidation point.
📌 Mark the zone, set your alert, and let price come to you.
_________________________________
💬 If you found this helpful, drop a like and comment!
Want breakdowns of other charts? Leave your requests below.
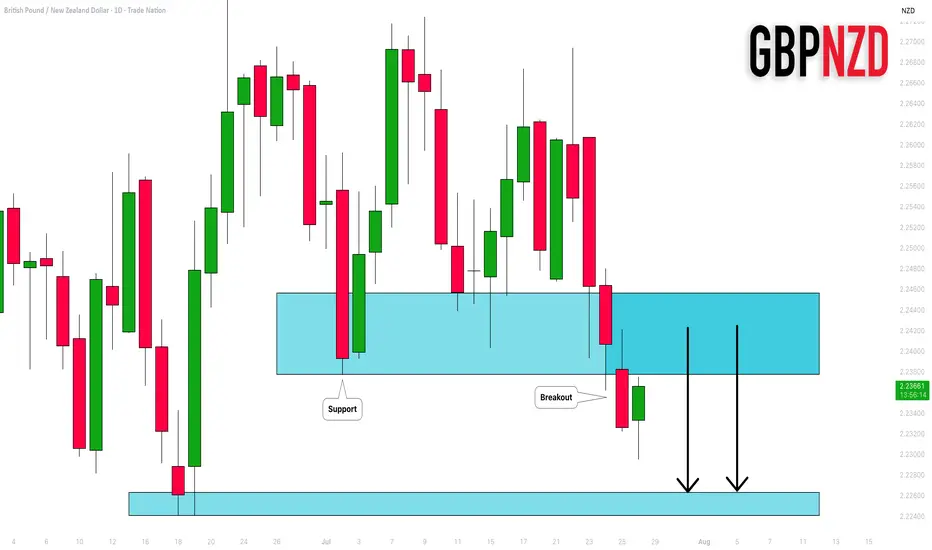
GBPNZD: Important Breakout 🇬🇧🇳🇿
GBPNZD broke and closed below a significant support cluster on a daily.
The broken structure turned into a strong resistance.
I will expect a bearish move from that.
Next support - 2.2264
❤️Please, support my work with like, thank you!❤️
I am part of Trade Nation's Influencer program and receive a monthly fee for using their TradingView charts in my analysis.
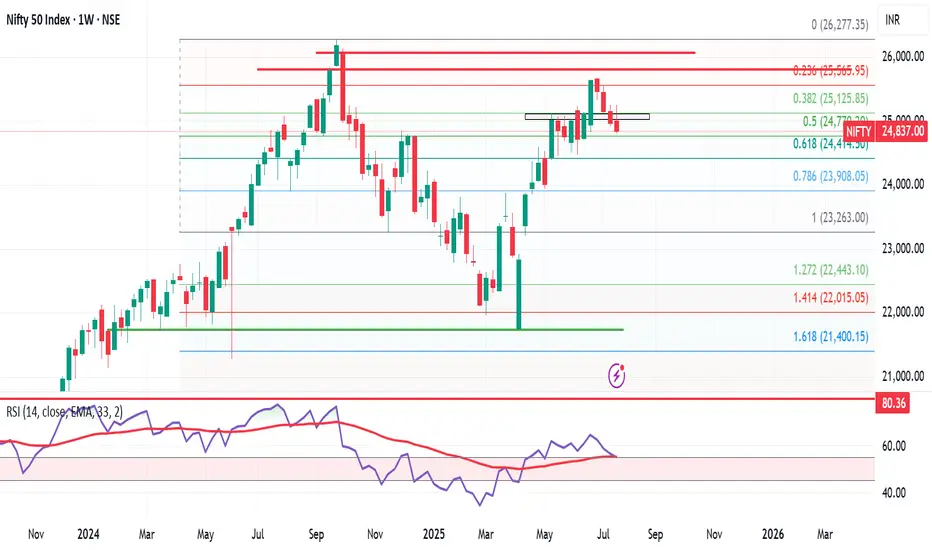
Nifty Weekly Market Update – Brace for Bearish Momentum? Nifty ended the week at 24,837, down 131 points from last week’s close. It made a high of 25,246 and a low of 24,806, staying perfectly within my projected range of 25,400–24,500.
As highlighted earlier, Nifty has now formed an inverted hammer on the weekly chart — a classic bearish reversal candlestick. 🔍
📅 Flashback: On 6th July, I mentioned giving bulls 10–15 days of playtime. That phase seems to be ending. The monthly time frame remains bearish, and now the weekly chart is aligning, indicating a stronger downside risk.
🔮 What’s Next?
👉 Expect Nifty to trade between 25,300–24,400 in the coming week.
👉 A break below 24,400 could open doors to 23,900.
👉 If 24,400 holds, bulls may still have a chance to regroup.
🧠 Pro Tip: Only Nifty Pharma is showing resilience. Those looking for long trades should focus on strong pharma stocks — the rest of the sectors are showing bearish signs.
Meanwhile in the US:
S&P 500 hits another all-time high, closing at 6,388, up 90 points from last week. My long-standing target of 6,568 now looks well within reach.
But here’s the catch — despite US strength, it’s not supporting Indian markets. If US markets correct, expect intensified selling pressure in India.
🎯 Strategy for Indian investors:
Let the bears rule till 7–8 August. Stay alert, and be ready to grab high-quality stocks at bargain prices. This is not the time to panic, but to prepare smartly.
MKR ANALYSIS🔮 #MKR Analysis
🌟🚀 As we said earlier #MKR moved around 48%. Right now #MKR is trading in an Ascending Triangle Pattern and here we can see that #MKR moving again towards its neckline. We see see more bullish move in upcoming days
🔖 Current Price: $2260
⏳ Target Price: $2664
⁉️ What to do?
- We have marked crucial levels in the chart . We can trade according to the chart and make some profits. 🚀
#MKR #Cryptocurrency #Breakout #DYOR

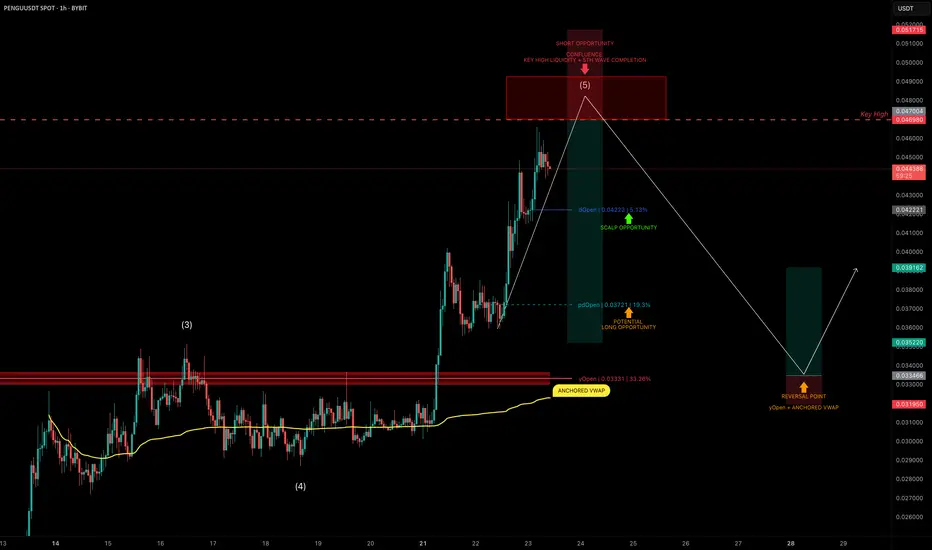
PENGU Topping Out? Targeting 30% Downside After Liquidity SweepPENGU has had an explosive run, but it now looks to be nearing completion of wave 5 of its current Elliott impulse.
We’re approaching a key high at $0.04698, a likely liquidity grab zone — and potentially a great area to position for a short trade.
🧩 Short Setup Overview
➡️ Wave 5 Completion Incoming:
Price is showing signs of exhaustion as it approaches $0.04698, where liquidity is likely stacked above the previous high.
➡️ SFP Trigger Zone:
Watch for a swing failure pattern (SFP) at $0.04698 — confirmation for a potential short entry.
➡️ Psychological Resistance:
The $0.05 level also sits just above — a classic psychological barrier that may get tapped or wicked into.
🔴 Short Trade Setup
Entry: After a confirmed SFP at $0.04698–$0.05
Target (TP): Yearly Open (yOpen) — potential move of ~30%
Stop-loss: Above post-SFP high
R:R: Excellent asymmetry if setup confirms
🛠 Indicator Note
In this analysis I'm using my own indicator called "DriftLine - Pivot Open Zones ", which I recently published.
✅ It helps highlight key open levels, support/resistance zones, and price structure shifts — all critical for confluence-based trade planning.
Feel free to check it out — you can use it for free by heading to my profile under the “Scripts” tab.
💡 Educational Insight: How to Trade Wave 5 Liquidity Sweeps
Wave 5 tops often trap late longs, especially when paired with psychological levels and key highs.
➡️ Patience is key — wait for a rejection pattern or SFP before entering.
➡️ Liquidity sweeps first — then the move.
Final Thoughts
PENGU is pushing toward $0.04698–$0.05, but this may be its final move up before correction.
With the yearly open as a logical target, and clear confluence via DriftLine, this setup offers a clean short opportunity — if confirmation comes.
Stay sharp, let price lead, and trade the reaction — not the prediction.
_________________________________
💬 If you found this helpful, drop a like and comment!
Want breakdowns of other charts? Leave your requests below.