Meta Platforms - This stock tastes sooo good!Meta Platforms - NASDAQ:META - will print a new all time high:
(click chart above to see the in depth analysis👆🏻)
Over the course of the past two months, Meta has been rallying +40%. This recent behaviour was not unexpected at all but rather the consequence of the all time high break and retest. Now - back at the previous all time high - Meta will most likely break out higher again.
Levels to watch: $700, $900
Keep your long term vision!
Philip (BasicTrading)
Swingtrading

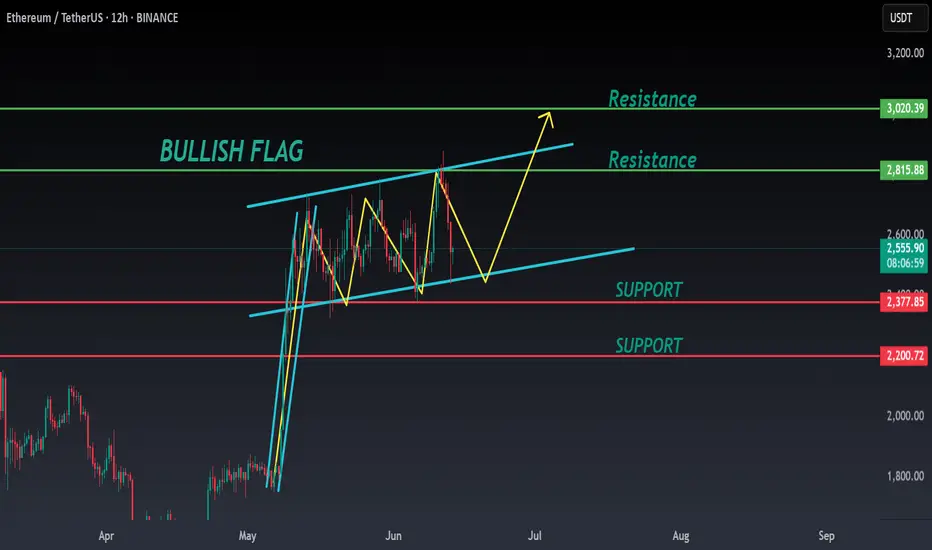
ETH ANALYSIS📊 #ETH Analysis : Update
✅As we said earlier, #ETH performed same. Now we can see that #ETH is trading in a bullish flag pattern and its a bullish pattern. We could expect around 10% bullish move if it sustain above its major support.
👀Current Price: $2555
🚀 Target Price: $2815
⚡️What to do ?
👀Keep an eye on #ETH price action and volume. We can trade according to the chart and make some profits⚡️⚡️
#ETH #Cryptocurrency #TechnicalAnalysis #DYOR
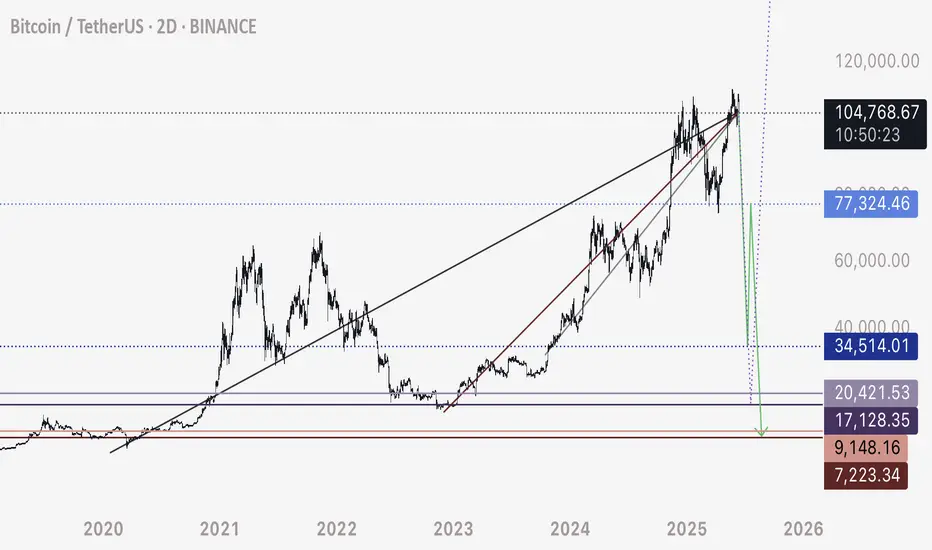
BTC - Update on Suspected Flash Crash ScenarioFor those of you who have been following my ideas, and I don’t think that would be many - understandably so, because these ideas seem so outrageous and out of the norm - I feel obligated to provide updated numbers per my own personal trade ideas.
I expect BTC to flash crash. In summary, here is why:
1. DXY is breaking down and retesting a major bearish trendline on the monthly. This alongside geopolitical events and sentiment, I expect the dollar to fall rapidly and store of value assets such as BTC to see a multi year bull run.
2. The market has been steadily bringing BTC up since late 2022. This leaves a trail of long position stop losses below the price, leaving a massive chain reaction of sell orders ready to set off one into the next. In other words, the orders required to make the drop are already in the chart.
3. It’s a question of when - BTC is under 3 intersecting bearish trendlines, and we can see how price breaks above and below these support / resistance levels historically. Eventually they will hold and play out, estimating when is tricky - that’s why I use DXY to predict it.
It’s difficult to pinpoint where the upper resistance is - but a pretty solid pick is around 105,200. I’ve used various numbers in the past for this idea, but it’s always refining and evolving based on what I see price doing.
I’m proposing two movements for a massive liquidation sweep of the lows prior to a 3-5 year bull run where BTC sees those quarter million dollar prices.
Scenario 1:
105,200 to 35,000
35,000 retrace to 77,000 ( although this doesn’t have to happen, I just anticipate a 3 wave corrective move)
77,000 to 10,000 (could be as low as 7,000)
7,000 and upwards of 200,000 (after all liquidity is absorbed and reclaimed)
Scenario 2:
105,200 straight down (for the most part) to 17,000 to 20,000
17-20,000 and upwards to 200,000 plus
Personally I feel scenario one is most likely. I’ve been trading this market since 2017 and the newfound “ stability “ of Bitcoin during the last 2 years cannot be trusted. This upwards move IS NOT a bull run. It’s a BEARISH RETEST.
Bearish retests typically move straight up, exactly as what’s been happening - following by a drop roughly 10 times as fast.
Same ideas on the larger time frames as smaller time frames.
WHEN DO I EXPECT THIS TO HAPPEN?
Starting any minute and spanning over the next several days to week.
Anyway - that’s my update for those of you who are interested.
Understand this stuff gets laughed at - but I experienced the same treatment when I told my group to long BTC at 16,500 in Jan 2023 to a target of 90,000. It’s not new to me and I expect it.
Doing my best to help advise and open your minds to alternative ideas.
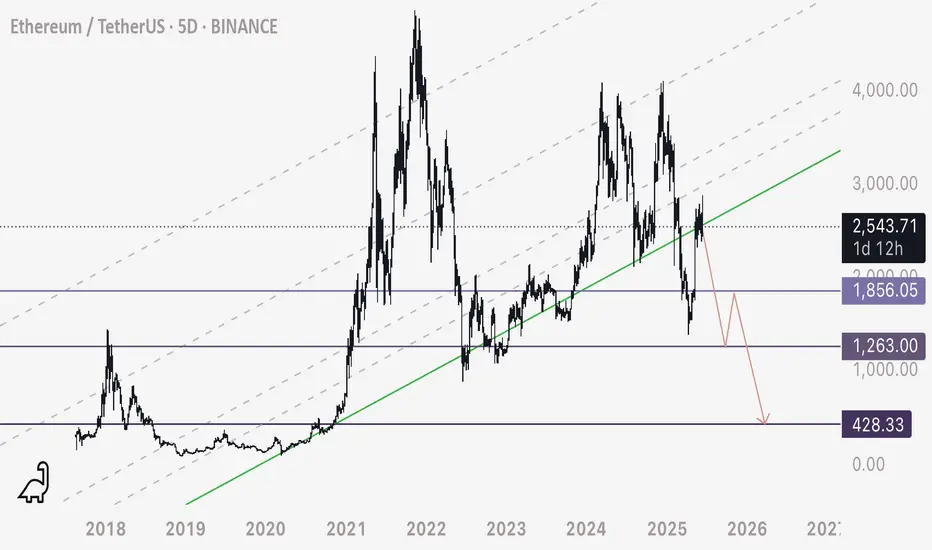
ETH - Another Take - When in Doubt, Zoom OutETH on the multi day time frame appears to have been respecting this ascending series of support / resistances since its inception.
If this resistance holds, this is a major breakdown of ETH’s last support - assuming the chart does work best on these ascending channels (certainly has historically).
Due to this I am shorting ETH at 2550 appx - and my targets are marked on the chart (3 purple levels).
I don’t see why any formation on the chart should be dismissed if it has a strong interaction historically.
Let’s see what happens.
Happy trading
BTCUSDT: Pro Analysis, Major Swing Supports, Risk Focus__________________________________________________________________________________
Technical Overview – Summary Points
__________________________________________________________________________________
Momentum & Trends : Short-term consolidation (<1H frames), dominant uptrend 2H–1W. BTC market structure is “Up” across all higher timeframes.
Supports/Resistances :
Major supports: 100,300 – 101,600 USDT (1D/4H/2H pivots)
Resistances: 109,000 – 111,500 USDT (1D/W/12H pivots)
Volume : Recent bearish climax absorbed, back to normal volumes, no current excess.
Multi-TF Behavioral Read : Behavioral indicators (ISPD DIV) are neutral; no extreme sentiment. Risk On / Risk Off Indicator confirms structural buy-side.
__________________________________________________________________________________
Strategic Summary
__________________________________________________________________________________
Global Bias : Bullish trend on high TFs, technical consolidation short term.
Opportunities : Swing entries on return ≥101.6k, TP at 109k/111.5k. Manage position sizes actively before Fed.
Risk Zones : Invalidation <100.3k daily; key area to monitor. Short-term stop-loss below 99.9k.
Macro Catalysts : FOMC (June 17–18) = expected volatility, no major macro risk now. Watch Mideast tensions. Rising tensions in the Middle East (Israel/Iran): volatile climate, potential risk-off sentiment on certain assets, but no widespread panic; to be monitored in case of rapid escalation (possible increased BTC volatility).
Action Plan : Favor gradual entries on major supports, reduce leverage pre-macro events, active volatility and stops monitoring.
__________________________________________________________________________________
Multi-Timeframe Analysis
__________________________________________________________________________________
1D / 12H: Key support at 100.3k–101.6k, major resistance 109–111.5k. Repeated rejections at resistance, mature range. Normal volume, consolidating momentum.
6H / 4H: Strong lateral structure, ISPD/Volume neutral. Technical play around 101.6k, gradual profit-taking below 109k.
2H / 1H: Start of institutional reaction (moderate to high volumes). Bearish climax absorbed, possible short-term rebound at local support 99.9k–101.6k.
30min / 15min: Micro-range, short-term consolidation, some volume spikes on corrections. Downtrend confirmed on lower TFs, despite macro/swing bullish confluence.
ISPD & Risk On / Risk Off Indicator Summary:
ISPD DIV = Neutral across all timeframes.
Risk On / Risk Off Indicator = STRONG BUY on all horizons (US tech strong).
Cross-timeframe Synthesis : BTC market is accumulating on supports under favorable tech sector influence. Short-term consolidation seen as post-shakeout setup for potential resumed uptrend.
__________________________________________________________________________________
Final Synthesis & Operational Plan
__________________________________________________________________________________
BTC market remains in a dominant swing bullish bias, supported by tech sector momentum and on-chain inflows. Key support zones (100.3–101.6k) offer attractive technical swing entries, with targets at 109–111.5k. However, strict risk management is essential ahead of the upcoming FOMC, rising Middle East tensions (Israel/Iran), and the potential for sudden volatility spikes.
Strategy: Maintain bullish exposure with partial profit-taking and reduced leverage into macro/geopolitical events. Systematic stops remain below 99.9k.
__________________________________________________________________________________

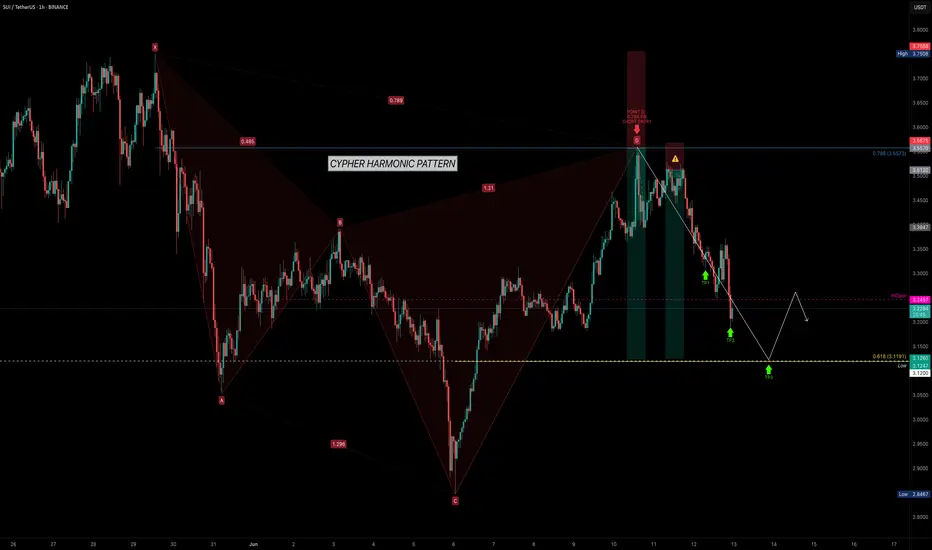
SUI — Trading with Geometry: Why Harmonics Work So WellSUI has been respecting technical levels with remarkable consistency. After bouncing from the $2.8467 low, it surged sharply — completing a clean Cypher Harmonic Pattern. This led to a high-probability short setup at the 0.786 Fibonacci retracement (Point D) around $3.5573.
🎯 Trade Setup Breakdown
Pattern: Cypher Harmonic
Entry (Point D): $3.5573 (0.786 retracement of XC)
Target: $3.1191 (0.618 retracement of CD)
Stop-Loss: Above Point X
The 0.618 fib retracement of the CD leg coincides with a significant key low from May 6, 2025, adding structural confluence. This is an ideal level to monitor for absorption, reaction, or potential reversal behaviour.
🧠 Educational Insight: How to Trade Harmonic Patterns Like a Pro
Harmonic patterns aren't just visually appealing — they represent high-probability setups based on market structure, Fibonacci geometry, and behavioural cycles. The most critical part of every harmonic pattern?
You enter at Point D.
Whether the pattern is bullish or bearish, Point D is your trigger:
In bearish patterns (like this Cypher), you short from Point D.
In bullish patterns, you long from Point D.
This works because Point D marks the exhaustion of the corrective leg, where trapped traders and liquidity often sit. The structure often aligns with supply or demand zones, order blocks, or FVGs (Fair Value Gaps).
💡 Important: Harmonic patterns are most effective on higher timeframes — 4H and above. On lower timeframes, noise increases and reliability drops significantly. For clean execution and meaningful structure, stay with mid to high timeframes.
Here’s how to trade it effectively:
✅ Wait for the full pattern to form — don’t front-run
✅ Use fib levels and structure confluence to validate Point D
✅ Use order flow tools (like Exocharts) to confirm absorption or volume shift
✅ Enter on Point D with your stop-loss just beyond X
✅ Take profits at common retracement levels like the 0.382 or 0.618 of the CD leg
Patience is key. Harmonic traders wait for the market to complete the cycle — then strike with a plan.
📌 Final Thoughts
SUI is delivering clean harmonic respect, and this setup is no exception. Whether you're already short or waiting for further confirmation, keep an eye on volume, liquidity zones, and reaction levels around $3.1191. If this zone holds, it may serve as a pivot for the next move.
Pattern. Precision. Patience. That's how you catch high-probability trades like this.
_________________________________
💬 If you found this helpful, drop a like and comment!
Want breakdowns of other charts? Leave your requests below.
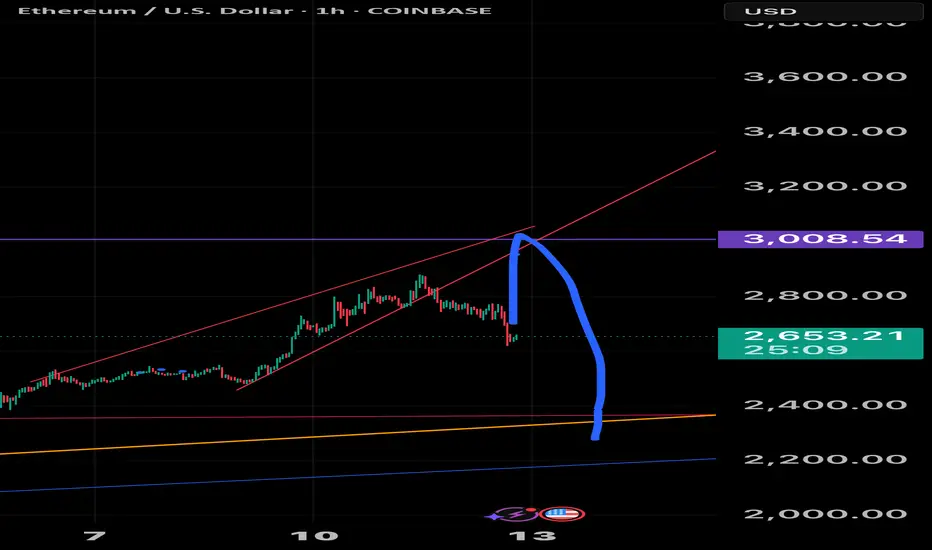
ETH $700 SWING SHORT MUST SEENext Prediction
$2600 to $3000
$3009 to $2300
⸻
Since the full Wedge failed to play out fully so now if we go up and inside the wedge has a higher higher giving us a huge swing
Target:
$2,300 is the full measured move if the rising wedge pattern plays out cleanly and fully resolves.
Xrp - The expected rally of +50%!Xrp - CRYPTO:XRPUSD - is still clearly bullish:
(click chart above to see the in depth analysis👆🏻)
Ever since Xrp rallied more than +550% in the end of 2024, we have been witnessing a quite expected consolidation. However Xrp still remains rather bullish and can easily retest the previous all time highs again. Maybe, we will even see another parabolic triangle breakout.
Levels to watch: $3.0, $10.0
Keep your long term vision!
Philip (BasicTrading)

Nvidia - The breakout will eventually follow!Nvidia - NASDAQ:NVDA - will break out soon:
(click chart above to see the in depth analysis👆🏻)
Over the course of the past couple of days, we saw a quite strong rally of +50% on Nvidia. Considering the market cap of this company, such a move is quite impressive. Following this overall very strong bullish momentum, an all time high breakout is quite likely to happen soon.
Levels to watch: $150
Keep your long term vision!
Philip (BasicTrading)

Micron Technology - Starting the next +80% move!Micron Technology - NASDAQ:MU - perfectly respects structure:
(click chart above to see the in depth analysis👆🏻)
Starting back in mid 2024, Micron Technology created the expected long term top formation. We witnessed a correction of about -60%, which ultimately resulted in a retest of a confluence of support. So far, Micron Technology rallied about +60%, with another +80% to follow soon.
Levels to watch: $150, $180
Keep your long term vision!
Philip (BasicTrading)

Broadcom - This was just the first all time high!Broadcom - NASDAQ:AVGO - just created new highs:
(click chart above to see the in depth analysis👆🏻)
Over the course of the past three months, Broadcom has been rallying an impressive +80%. However looking at market structure, all of the previous "dump and pump" was not unexpected. Following this recent bullish strength, Broadcom is likely to channel a lot higher.
Levels to watch: $250, $400
Keep your long term vision!
Philip (BasicTrading)

Microsoft - This might be the ultimate breakout!Microsoft - NASDAQ:MSFT - will break the all time high:
(click chart above to see the in depth analysis👆🏻)
If you wonder why Microsoft has been rallying +15% this month, market structure will give you an answer. In fact, the recent bullish break and retest was totally expected, and if we take into account the recent quite strong bullish behaviour, an all time high breakout will follow soon.
Levels to watch: $450
Keep your long term vision!
Philip (BasicTrading)

Review and plan for 12th June 2025Nifty future and banknifty future analysis and intraday plan.
Positional/short term stock ideas.
This video is for information/education purpose only. you are 100% responsible for any actions you take by reading/viewing this post.
please consult your financial advisor before taking any action.
----Vinaykumar hiremath, CMT

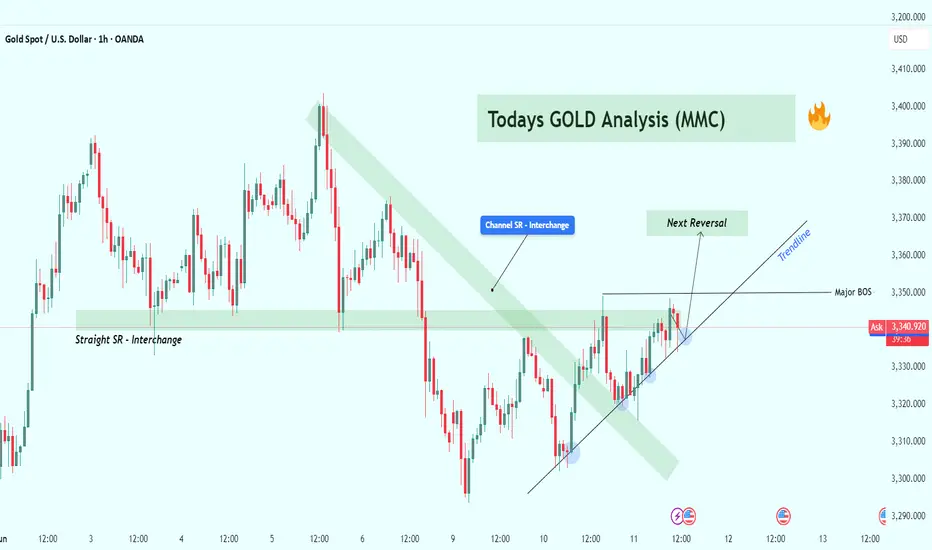
XAU/USD MMC Analysis – Structure Flip, Trendline + Target Zone📊 Market Sentiment and Price Structure Overview:
Gold has been navigating a highly structured range with multiple clear zones of support and resistance that have now started to break down in favor of a short-term bullish trend. The chart reflects a transition from a bearish descending channel to a potential bullish continuation pattern.
Today’s analysis is centered around three core ideas:
Market Structure Shift (Break of structure)
Support/Resistance Interchange (horizontal + channel)
Trendline Dynamics (bullish control)
Each of these plays a key role in shaping trade bias and decision-making.
🧱 1. Straight SR Interchange Zone (Key Historical Level):
Marked on the left side of the chart, this level has acted as both support and resistance over the last several days. Traders call this a “flip zone” — price often bounces off this area multiple times as buyers and sellers wrestle for dominance.
✅ Multiple touches indicate institutional interest.
🔄 This zone adds confluence to other structure zones, increasing its strength.
🧲 Price currently hovers near this level, suggesting indecision or a setup for a larger move.
📉 2. Descending Channel SR Flip – Confirmation of Shift:
The descending green channel served as a dynamic resistance over multiple sessions. Price remained below it during the previous downtrend. However, a breakout occurred, followed by a successful retest, turning it into support — a textbook bullish structure flip.
This move was also a signal of trend reversal, which was followed by higher lows and a shift in price behavior.
📈 3. Upward Trendline – Short-Term Bullish Control:
A diagonal ascending trendline is forming beneath price action, supported by multiple rejection wicks and higher lows (marked in blue). This shows that buyers are stepping in earlier, absorbing selling pressure.
🔁 Each touch confirms strength.
📉 A break below this line could signal weakness or trend exhaustion.
Watch closely — this line becomes your dynamic support and invalidation point for any long positions.
🔄 4. Major BOS (Break of Structure) – Trend Change Confirmed:
We’ve seen a clean break of structure above previous swing highs — this is key in market structure analysis. When a lower high is invalidated by a higher high, it often marks a trend reversal.
This BOS now acts as a major support area. As long as price remains above this zone, bullish continuation is favored.
🚨 5. Reversal Zone in Sight – Potential Resistance Ahead:
Highlighted as “Next Reversal” in the chart, this area around $3,360–$3,370 is a confluence of:
Past resistance
Mid-channel region
Psychological round numbers
Price is nearing this level, and we may see a temporary pullback or rejection before any further continuation.
🎯 Trading Plan:
🔵 BULLISH SCENARIO (Base Case):
🟢 Entry: On a retest of trendline or BOS zone ($3,330–$3,340)
🛡️ SL: Below $3,325
🎯 TP1: $3,360
🎯 TP2: $3,390
🧠 Reasoning: Structural shift confirmed, trendline respected, SR flip confluence.
🔴 BEARISH SCENARIO (Counter-Play):
🔴 Entry: At rejection from $3,365–$3,370 zone (reversal box)
🛡️ SL: Above $3,380
🎯 TP1: $3,345
🎯 TP2: $3,330
🧠 Reasoning: Reversal from resistance zone, potential trap setup, fading exhausted move.
📌 Summary:
Gold is in a key decision phase after a major structural flip. The battle between bulls and bears is now centered around the trendline and next resistance zone. As always, patience and confirmation will be key.
Trendline = dynamic support
BOS zone = structural support
Reversal area = possible short-term ceiling
💡 Best trades will come from reactions, not predictions.
🚀 Stay Updated:
Follow this idea for live updates as price reacts to these zones. If we break and hold above the reversal box, expect bullish continuation. Otherwise, watch for potential trap plays and short-term pullbacks.
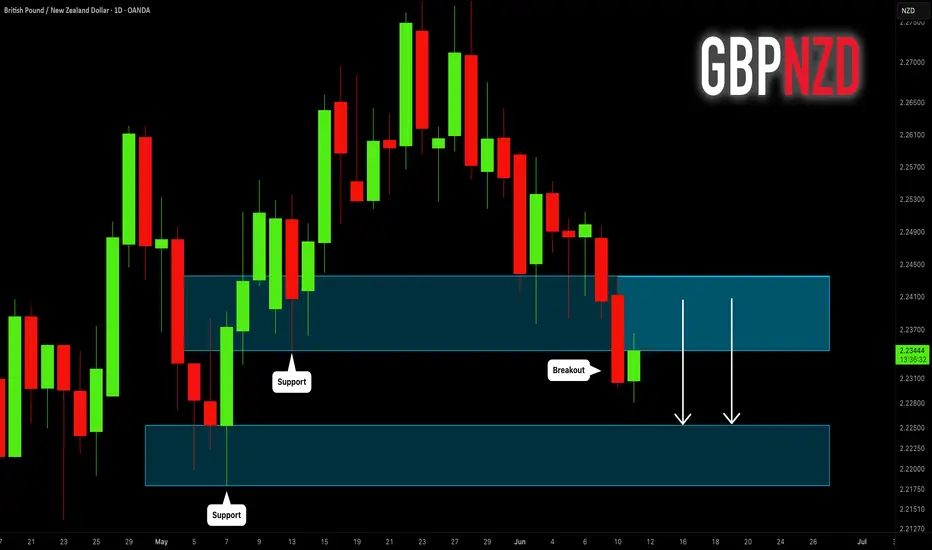
GBPNZD: Important Breakout 🇬🇧🇳🇿
GBPNZD broke and closed below a key daily support cluster.
The broken structure turned into a strong resistance.
I will expect a bearish movement from that at least to 2.2255 support.
❤️Please, support my work with like, thank you!❤️
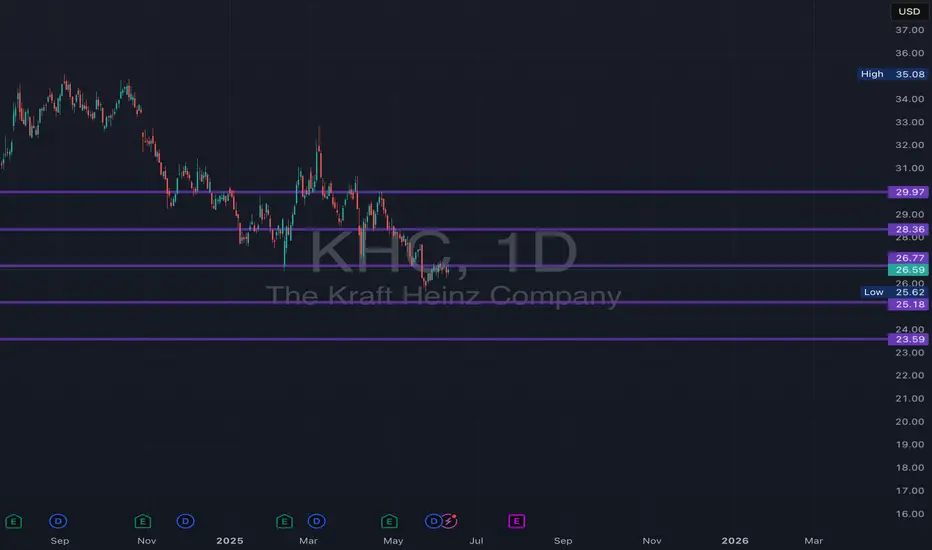
KHC Monthly Support and Resistance Lines for June 2025KHC Monthly Support and Resistance Lines for June 2025, only valid till end of June.
Overview:
These purple lines act as Support and resistance lines when the price moves into these lines from the bottom or the top direction. Based on the direction of the price movement, one can take long or short entries.
Trading Timeframes
I usually use 30min candlesticks to swing trade options by holding 2-3 days max. Anyone can also use 3hr or 4hrs to do 2 weeks max swing trades for massive up or down movements.
I post these 1st week of every month and are valid till the end of the month.
NC HAMMER CRYPTO utoo bThis is just a quick insight on AIOZ.... looks good, if were looking at the fib retracement it has a long way to hit the 0.618 fib retracement which is a little over 100% retracement. This is a possibility when btc goes up, just keep it in mind, and good luck, have fun with it!

Review and plan for 11th June 2025 Nifty future and banknifty future analysis and intraday plan.
Positional ideas.
This video is for information/education purpose only. you are 100% responsible for any actions you take by reading/viewing this post.
please consult your financial advisor before taking any action.
----Vinaykumar hiremath, CMT

Bitcoin - Here we have the all time high!Bitcoin - CRYPTO:BTCUSD - is just getting started:
(click chart above to see the in depth analysis👆🏻)
It was really just a matter of time until we see a new all time high on Bitcoin. Consindering that over the past two months alone, Bitcoin rose another +50%, this was a clear indication that bulls are taking over. But this all time high is clearly not the end of the bullrun.
Levels to watch: $300.000
Keep your long term vision!
Philip (BasicTrading)

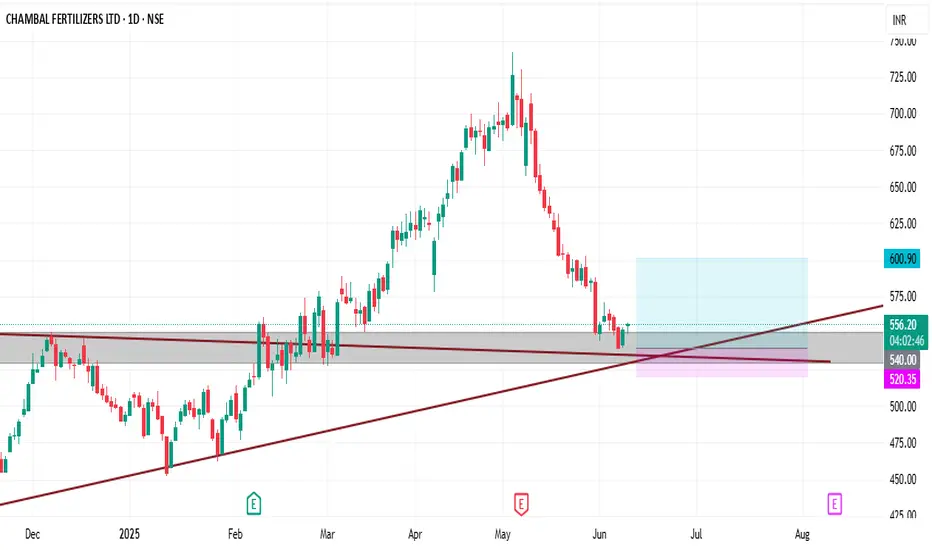
CHAMBAL FERTILIZERS FOR SWING TRADECHAMBAL FERTILIZERS a good opportunity for swing trade plan, entry and exit point mention, add your watchlist and observe.
This is for Education purpose only...
Tesla - There's more after the +60% rally!Tesla - NASDAQ:TSLA - will blow even further:
(click chart above to see the in depth analysis👆🏻)
It is almost incredible to see such a large cap stock rally more than +60% in less than two months. But Tesla is clearly the exception and therefore we should expect the unexpected. What's quite likely is at least another rally of about 25% from here and a retest of the previous all time high.
Levels to watch: $250, $400
Keep your long term vision!
Philip (BasicTrading)

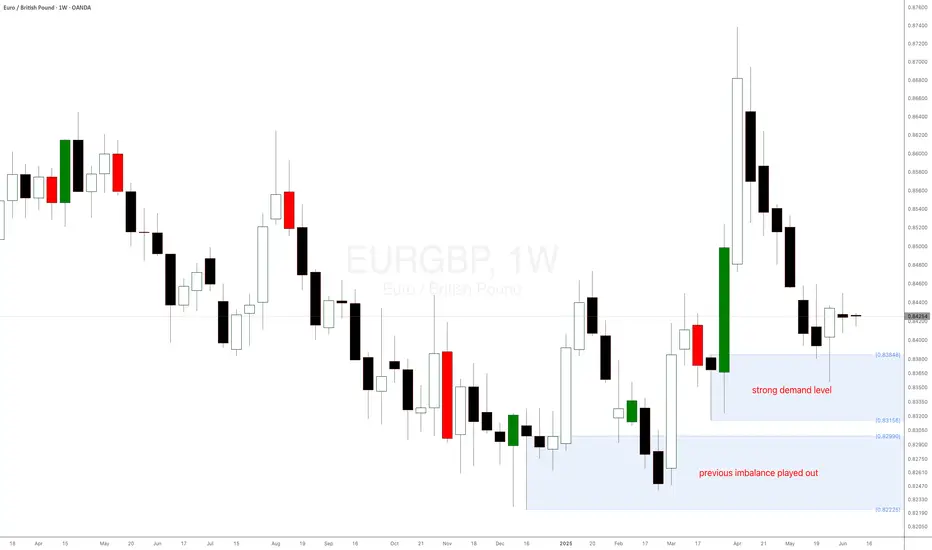
EURGBP forex rallying as expected off weekly demand levelWeekly uptrend. Weekly demand imbalance at 0.83 is still in control and trying to play out as expected. Any swing long positions should be managed. I hope you could take advantage of long positions using the smaller timeframes for those intraday and short-term forex traders.
Review and plan for 10th June 2025 Nifty future and banknifty future analysis and intraday plan.
Positional ideas.
This video is for information/education purpose only. you are 100% responsible for any actions you take by reading/viewing this post.
please consult your financial advisor before taking any action.
----Vinaykumar hiremath, CMT
