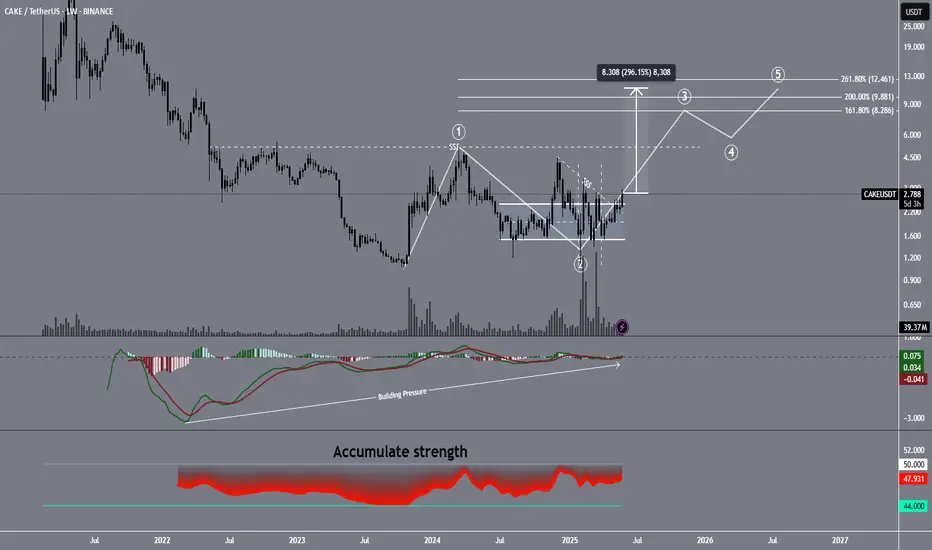
Pancake swing tradePancake is getting ready to release all the pressure that was build up inside of it.
we have vast amount of liquidity above us that we need to take.
Get ready! 🚀🌕
(You have the full responsibility for each action that u take because I'm not your financial advisor)
Swingtrading
Ethereum - The bottom is finally in!Ethereum - CRYPTO:ETHUSD - is starting the rally:
(click chart above to see the in depth analysis👆🏻)
Finally, after dropping an expected -65% over the past couple of months, Ethereum is retesting and already rejecting a significant horizontal structure. Together with the strong confluence of support, Ethereum is now creating a long term bottom, initiating the next bullish cycle.
Levels to watch: $2.000, $4.000
Keep your long term vision!
Philip (BasicTrading)

Understanding How Dark Pool Buy Side Institutions AccumulateThe SPY is the most widely traded ETF in the world. Its price or value movement reflects the S&P 500 index value. It doesn't reflect the buying or selling of the SPY.
You must use volume indicators and accumulation/distribution indicators that indicate whether the Buy Side Institutions are in accumulation mode, rotation to lower inventory to buy a different ETF or other instrument, OR distribution due to mutual fund and pension fund redemption demands.
ETFs are one of the fastest growing industries in the US and around the world. There are more than 4000 Exchange Traded Derivatives. There are ETDs for just about anything you might wish to invest in long term or trade short term.
If you trade the SPY, it is important to study the S&P 500 index, its top 10 components, how their values are changing, and resistance and support levels. SPY will mirror the S&P 500 closely but not precisely.
ETFs are built with a variety of types of investments and always have a TRUST FUND, in which the components of that ETF inventory are held. The ETF Inventory is updated and adjusted monthly or sooner as needed to maintain the integrity of the ETF price value to the value of the S&P 500 index. Rules and regulations require that the ETF SPY be closely aligned to the S&P 500. So inventory adjustments are going on regularly.
When trading the SPY, you must remember that it is not buyers and sellers of the ETF that change its price. Rather, it is the S&P 500 top components' price fluctuations that change the SPY price value.
This is a tough concept to accept and understand. When you do understand it and apply that knowledge to your trading of the SPY, you will be far more profitable. This takes time. You also need to develop Spatial Pattern Recognition Skills so that when a pattern appears, you can recognize it instantly and act accordingly in your trading.
Today we cover the resistance levels above the current price value. That resistance is likely to slow down the rapid gains in price value over the past few weeks. The ideal would be a sideways trend to allow corporations time to adjust to the new normal of whatever tarrifs are impacting their imports and exports.
Then, the S&P500 move out of that sideways trend would result in a stronger Moderately Uptrending Market Condition.
Trade Wisely,
Martha Stokes CMT

ETH ANALYSIS🔴 #ETH Analysis : ❓❓
🔮There is a formation of "Bullish Pennant Pattern" in #ETH in 4HR time frame. We can expect around $2800 bullish move if the price break the pattern.📈
⚡️What to do ?
👀Keep an eye on #ETH price action. We can trade according to the chart and make some profits. ⚡️⚡️
#ETH #Cryptocurrency #Breakout #DYOR

Bitcoin - Approaching the all time high!Bitcoin - CRYPTO:BTCUSD - will break out again:
(click chart above to see the in depth analysis👆🏻)
It has been quite some time since we saw such a strong move on Bitcoin. But finally - not totally unexpected to be honest - Bitcoin is following its destiny and about to create another new all time high. Patience is key and strategy, risk and mindset will help you master the volatility.
Levels to watch: $100.000
Keep your long term vision!
Philip (BasicTrading)

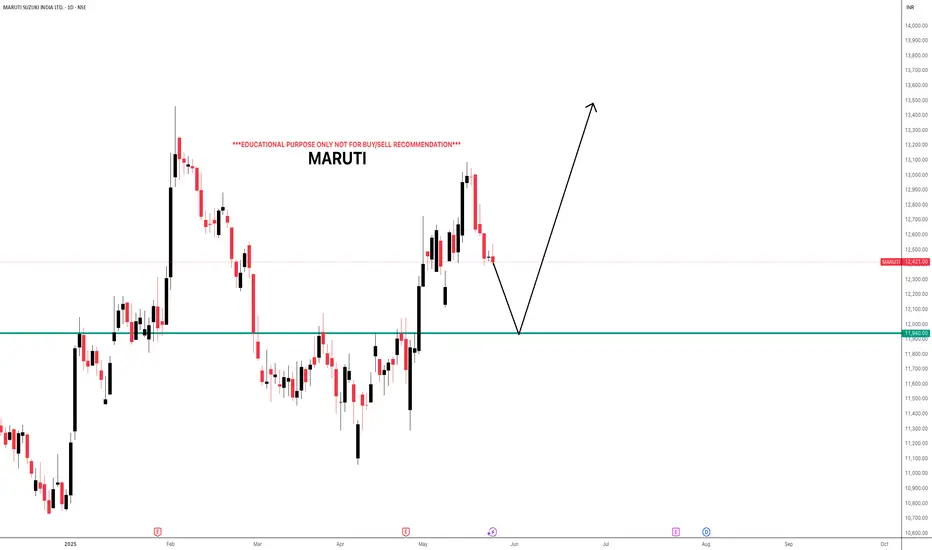
MARUTIi Observed these Levels based on Price Action and Demand & Supply which is my own Concept "PENDAM CONCEPTS"... Please don't take any trades based on this chart/post... Because this chart is for educational purpose only not for Buy or Sell Recommendation... Thank Q
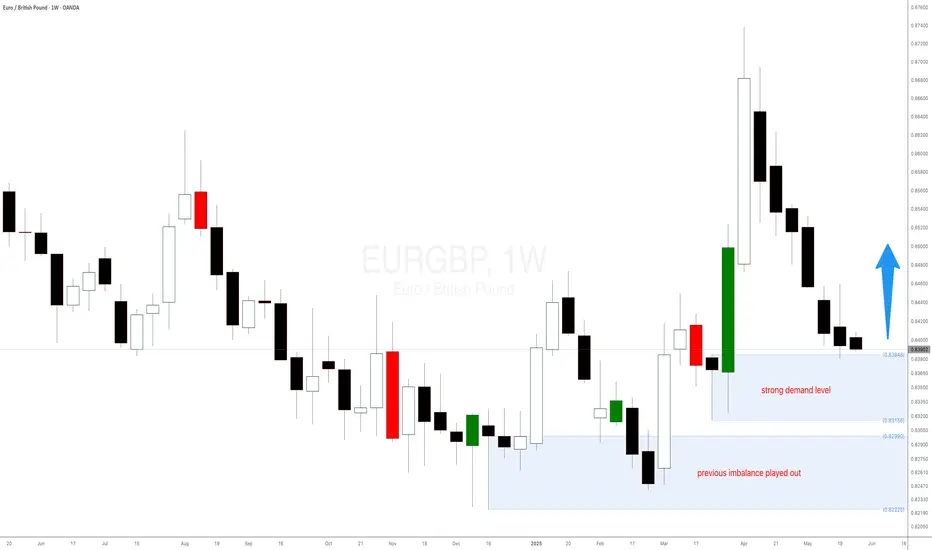
Why EUR vs GBP Could Be Your Best Trade This Week!When it comes to forex swing trading or even forex intraday trading, the temptation to zoom into lower timeframes—like the 15-minute or 1-hour charts—is strong. Most forex traders focus on short-term momentum, often diving into scalping strategies that chase quick pips. However, the real edge lies where most don’t look: the higher timeframes, particularly the weekly chart. The EUR/GBP forex pair is a perfect example of these higher timeframes' power, especially when paired with smart money concepts like demand and supply imbalances.
EUR/GBP: A Hidden Gem for Forex Swing Traders
The EUR/GBP Forex cross pair is often overlooked compared to major USD-based pairs. However, for seasoned swing traders and institutional players, EUR/GBP offers deep liquidity, cleaner technical analysis and price action structures, and strong reaction zones that are respected time and time again.
At the end of May 2025, a significant weekly demand imbalance at 0.8384 finally took control of price action—something smart money traders had been anticipating for months. This wasn't a surprise for those watching the higher timeframes. Similar to how the previous weekly imbalance at 0.8299 took control in February 2025, these zones have proven critical in guiding the medium- to long-term direction of EUR/GBP.
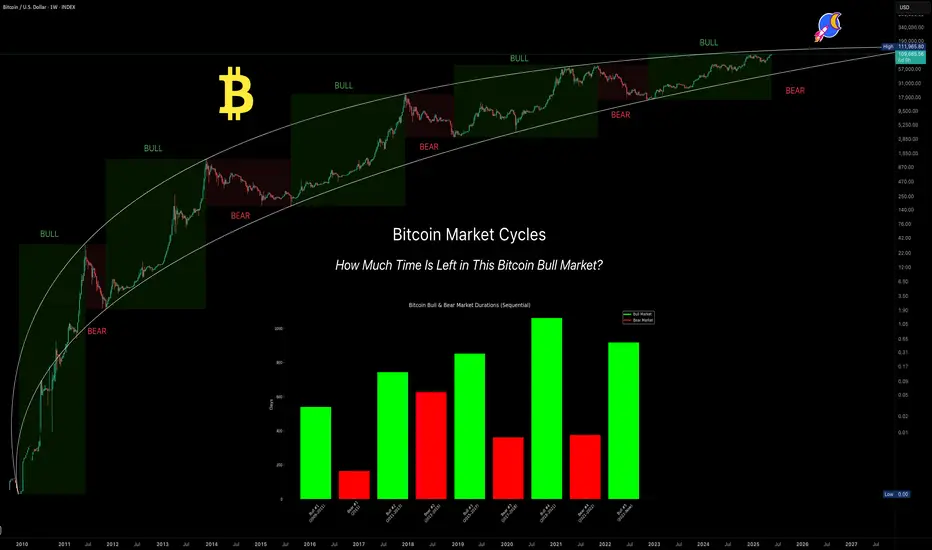
Bitcoin's Market Cycles — Are We Nearing the Top?Bitcoin is approaching a critical moment and the signs are everywhere.
After more than 900 days of steady bull market growth, BTC now flirts with all-time highs (ATH) while momentum stalls, liquidity thins, and emotions run hot. You might be asking:
Are we nearing the cycle top?
Is now the time to de-risk or double down?
What comes next?
This isn’t just a question of price. It’s about timing, structure, and psychology.
In this analysis, we’ll break down Bitcoin’s historical cycles, the current macro structure, the hidden signals from Fibonacci time extensions, and how to think like a professional when the crowd is chasing FOMO.
Let’s dive in.
📚 Educational Insight: Understanding Bitcoin Cycles
Bitcoin doesn’t move in straight lines, it moves in cycles.
Bull markets grow slowly, then explode. Bear markets fall fast, then grind sideways. These rhythms are driven by halving events, liquidity expansions, and most importantly: human emotion.
Here’s what history tells us:
Historical Bull Markets:
2009–2011: 540 days (+5,189,598%)
2011–2013: 743 days (+62,086%)
2015–2017: 852 days (+12,125%)
2018–2021: 1061 days (+2,108%)
2022–Present: 917 days so far (+623%)
Bear Market Durations:
2011: 164 days (-93.73%)
2013–2015: 627 days (-86.96%)
2017–2018: 362 days (-84.22%)
2021–2022: 376 days (-77.57%)
💡 What does this tell us?
Bull markets are growing longer, while bear markets have remained consistently brutal. The current cycle has already surpassed the average bull run length of 885 days (cycles #2–#4) and is quickly approaching the 957-day average of the two most recent cycles (#3 and #4). That makes this the second-longest bull market in Bitcoin’s history.
⏳ 1:1 Fibonacci Time Extension — The Hidden Timing Signal
In time-based Fibonacci analysis, the 1.0 (1:1) extension means one simple thing: this cycle has now lasted the same amount of time as previous cycles — a perfect time symmetry.
Here’s how I measured it:
Average bull market length #2–#4(2011–2021): 885 days
Average bull market length #3–#4(2015–2021): 957 days
Today’s date: May 27, 2025 = Day 917
✅ Result: We are well inside the time window where Bitcoin historically tops out.
You don’t need to be a fortune teller to see that this is a zone of caution. Markets peak on euphoria, not logic and this timing confluence is a red flag worth watching.
🗓️ "Sell in May and Go Away" — Not Just a Meme
One of the oldest market adages is showing its teeth again.
Risk assets — including Bitcoin — tend to underperform in the summer months. Why?
Lower liquidity
Institutional rebalancing
Exhaustion from prior run-ups
Vacations and reduced trading volumes
And here we are:
Bitcoin is hovering near ATH
It's been in an uptrend for 917 days
We just entered the time-extension top zone
Liquidity is thinning across the board
You don’t need to panic. But you do need to think like a professional: secure profits, reduce exposure, and wait for structure.
😬 FOMO Is a Portfolio Killer
This is where most traders make their worst decisions.
FOMO (Fear of Missing Out) isn’t just a meme — it’s the reason so many people buy tops and sell bottoms.
Before entering any trade right now, ask yourself:
Where were you at $20K?
Did you have a plan?
Or are you reacting to headlines?
📌 Clear mind > urgent clicks
📌 Patience > chasing green candles
📌 Strategy > emotion
Let the herd FOMO in. You protect your capital.
Will This Bear Market Be Different?
Every past cycle saw BTC retrace between 77%–94%. That was then. But this time feels… different.
Here’s why:
Institutions are here — ETF flows, sovereign wealth funds, and major asset managers
Regulation is clearer — and risk capital feels safer deploying in crypto
Supply is tighter — much of BTC is now held off exchanges and in cold storage
While a massive crash like -80% is less likely, that doesn’t mean a correction isn’t coming. Even a 30%–40% drop from here would wreak havoc on overleveraged traders.
And that brings us to…
🚨 Altseason? Or Alt-bloodbath?
Here’s the hard truth:
If BTC corrects, altcoins will crash — not rally.
Most altcoins have already seen strong rallies from their cycle lows. But if BTC drops 30%, many alts could tumble 50–80%.
Altseason only happens when BTC cools off and ranges — not when it dumps. Don’t get caught holding the bag. Be tactical. Be disciplined.
So Where’s the Next Big Level?
You may be wondering: “If this is the top… where do we fall to?”
Let’s just say there’s a very important Fibonacci confluence aligning with several other key indicators. I’ll reveal it in my next analysis, so stay tuned.
🧭 What Should You Do Right Now? (Not Financial Advice)
✅ Up big? — Take some profits
✅ On the sidelines? — Wait for real setups
✅ Emotional? — Unplug, reassess
✅ Are you new to Trading? — study, learn (how to day trade) and prepare for the next cycle
The best trades come to the calm, not the impulsive.
💡 Final Words of Wisdom
Bitcoin rewards discipline. It punishes emotion.
Right now is not about catching the last 10% of upside — it’s about:
Watching structure for potential trend change
Measuring risk
Avoiding overexposure
Protecting what you’ve earned
📌 The edge isn’t in indicators. It’s in mindset. Stay prepared, stay sharp because in this market…
🔔 Remember: The market will always be there. Your capital won’t — unless you protect it.
The next big opportunity doesn’t go to the loudest.
It goes to the most ready.
_________________________________
Thanks for reading and following along! 🙏
Now the big question remains: Is a bear market just lurking around the corner?
What are your thoughts? Let me know in the comments. I’d love to hear your perspective.
_________________________________
If you found this helpful, leave a like and comment below! Got requests for the next technical analysis? Let me know.
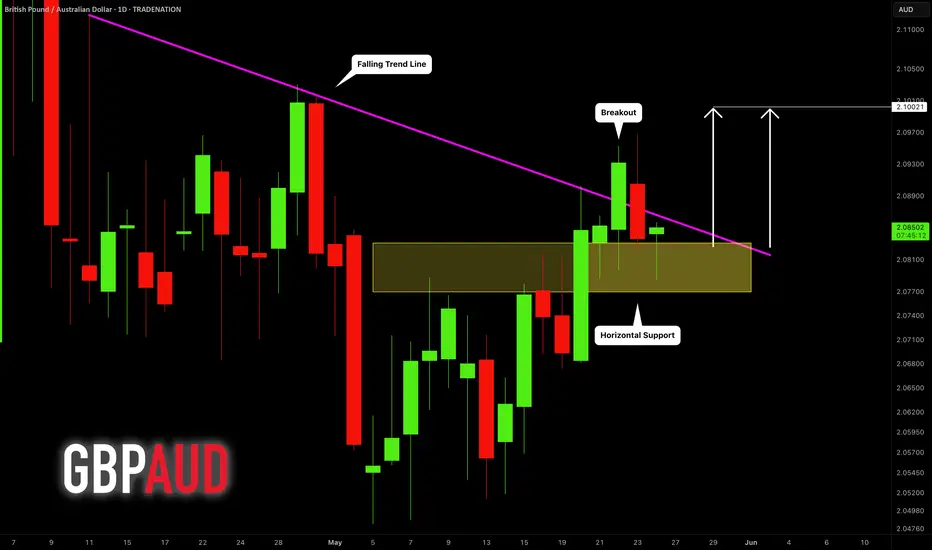
GBPAUD: Bullish Bias Remains 🇬🇧🇦🇺
I already shared a confirmed bullish breakout of a falling trend line on a daily.
Though the price went a bit lower, below that after its retest,
we have a significant horizontal support cluster that strongly holds.
I think that the price may start rising from that and reach
2.1 level this week.
❤️Please, support my work with like, thank you!❤️
I am part of Trade Nation's Influencer program and receive a monthly fee for using their TradingView charts in my analysis.
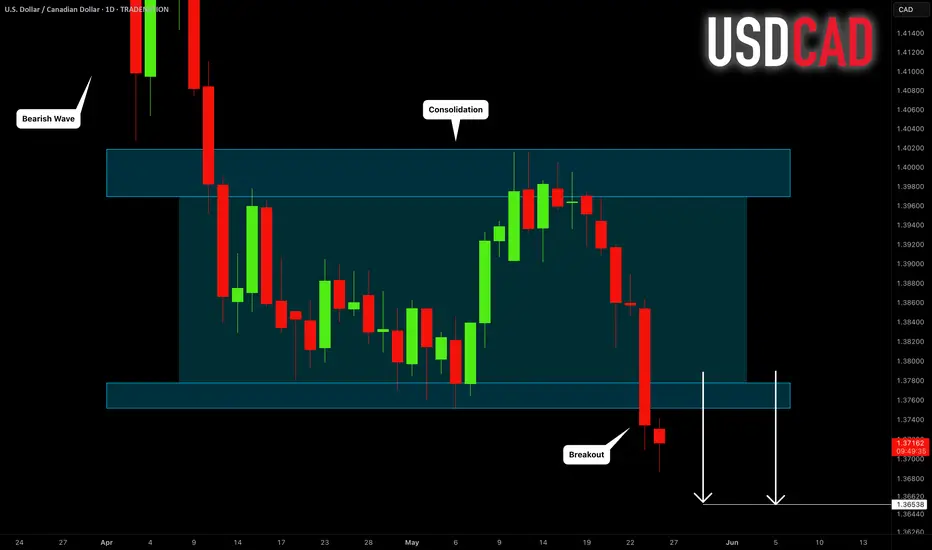
USDCAD: Bearish Outlook For This Week Explained 🇺🇸🇨🇦
USDCAD will likely continue a bearish trend that the market
established in February.
A bearish breakout of a support line of a horizontal parallel
channel on a daily provides a strong confirmation.
Next goal - 1.3655
❤️Please, support my work with like, thank you!❤️
I am part of Trade Nation's Influencer program and receive a monthly fee for using their TradingView charts in my analysis.
AKROAKRO: Seeing a potential inverse head-and-shoulder setup for a 30% move. Keep a close eye on this for buy signal. For me, I'm looking to get in when I see RSI-2 closing over the 60 level. Cheers!

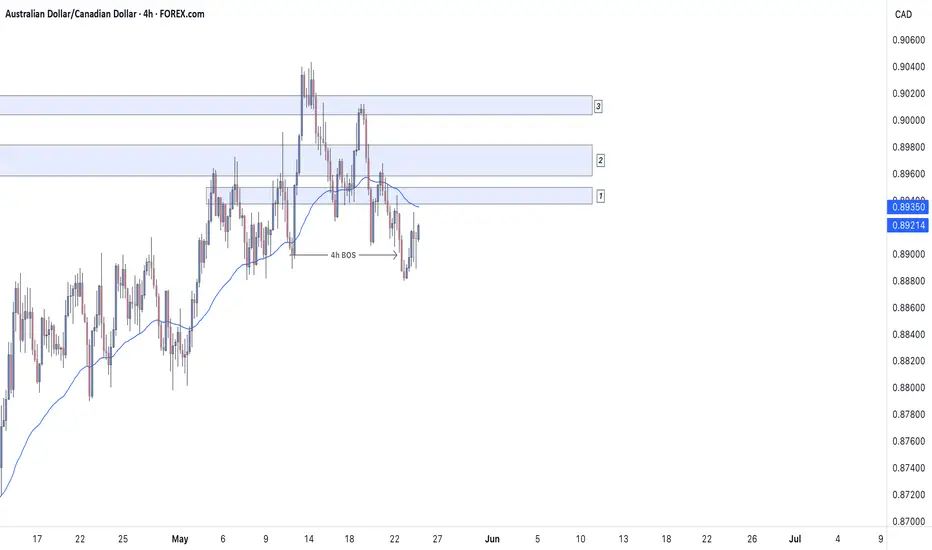
AUDCAD Short UpdateAfter seeing some more development the 4h has now turned bearish, lining up with my bearish bias on the Daily and Weekly timeframes. The blue zones are my daily areas of interest (support & resistance) which i would like to see price come back into to look for further opportunities short. Let me know what you think! 💭
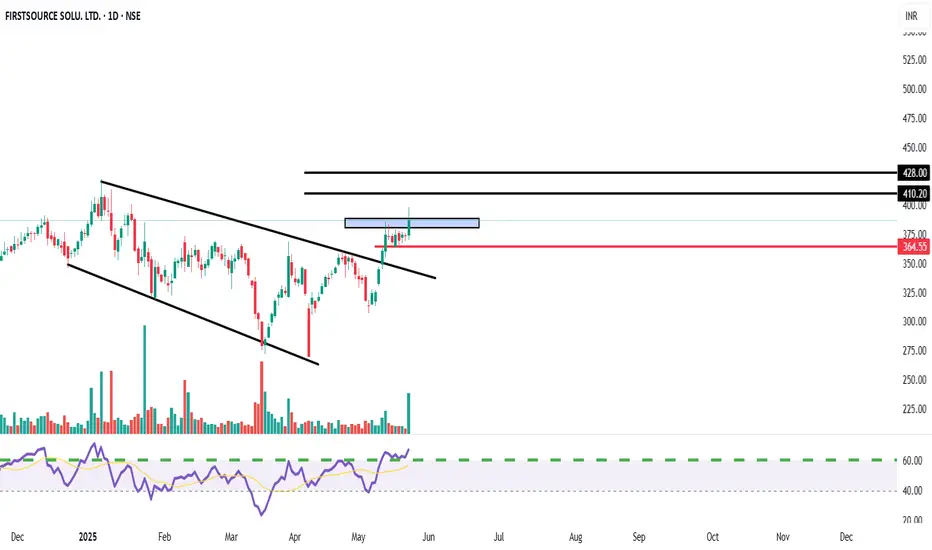
Bullish - Breakout observed from a descending channelEntry Zone: We recommend accumulating FSL in the zone of ₹375 - ₹385.
Target 1 (T1): ₹405
Target 2 (T2): ₹420
Target 3 (T3): ₹450 (If momentum sustains above T2)
Stop Loss (SL): ₹360 (Closing basis)
Rationale:
Channel Breakout: The stock has successfully broken out of a prominent descending channel, indicating a potential shift in momentum from bearish to bullish. This breakout is supported by decent volumes on the breakout candle.
RSI Confirmation: The Relative Strength Index (RSI) has shown a strong move above the 50-mark and is trending upwards, suggesting increasing buying interest and underlying strength.
Support from Previous Levels: The breakout retests appear to hold the previous resistance now acting as support, which is a classic bullish reversal pattern.
Risk-Reward: The current setup offers a favorable risk-to-reward ratio for short-term traders.
Key Risk: A close below ₹360 would negate the current bullish view and could lead to further downside. Traders should adhere strictly to the stop-loss.
Disclaimer: This report is for informational purposes only and does not constitute financial advice. Investors should conduct their own due diligence and consult with a qualified financial advisor before making any investment decisions. Equity investments are subject to market risks.
SMR NNE OKLO – Breakout Setup Triggered by Nuclear CatalystNYSE:SMR is lighting up after Trump’s announcement on nuclear energy — and it’s not alone. NYSE:OKLO and NASDAQ:NNE are also setting up, but NYSE:SMR has one of the cleanest breakout structures on the board.
🔹 Catalyst: Trump’s nuclear energy announcement yesterday is putting serious momentum behind the sector.
🔹 Technical Setup: NYSE:SMR is building a textbook breakout formation, with $32 as the key breakout level.
🔹 Volume & sentiment are increasing — early signs that buyers are positioning.
My Trade Plan:
1️⃣ Anticipatory Entry: I’m looking to buy the first dip before the $32 breakout — getting in early with tight risk.
2️⃣ Add on Breakout: Will scale in above $32 if volume confirms.
3️⃣ Stop Loss: Just below the recent base — staying tight on risk.
Why I’m Watching This Closely:
Sector catalyst + technical setup = 🔥
Nuclear names have been under accumulation, and now they’ve got a narrative tailwind.
First dip after a big catalyst is often the best R/R opportunity.

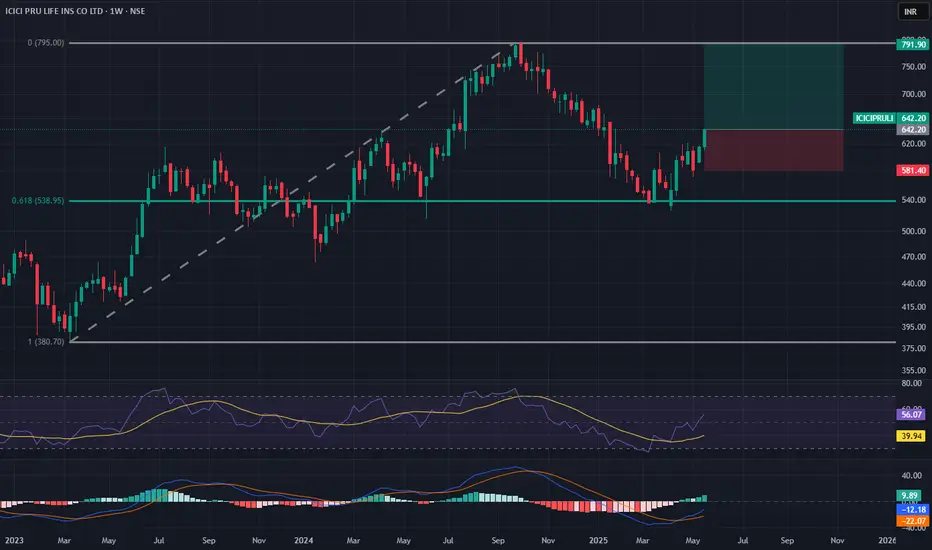
Reversal Trade in ICICI Prudential1. Consolidation breakout
2. Positive Divergence on RSI
3. Volume pop up
4. MACD signal turning green
5. RSI near 70
6. Good weekly close
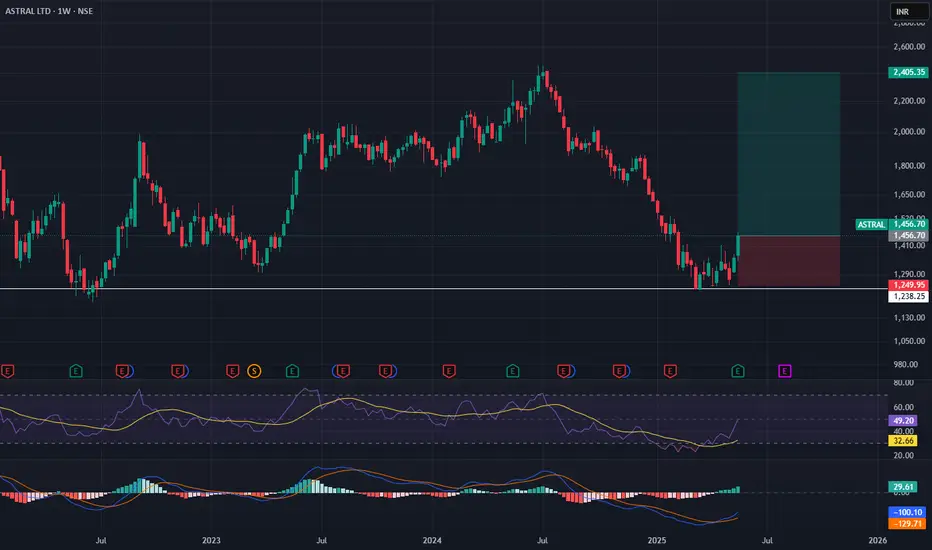
Reversal Trade in ASTRAL1. Consolidation breakout
2. Positive Divergence on RSI
3. Volume pop up
4. MACD signal turning green
5. RSI near 70
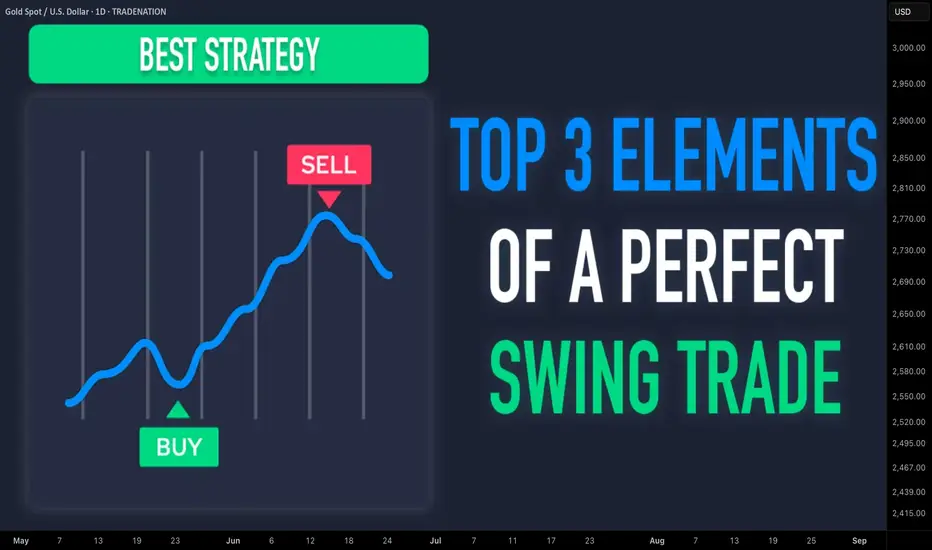
Learn TOP 3 Elements of a Perfect SWING TRADE (GOLD, FOREX)
In the today's post, I will share with you a formula of ideal swing trading setup.
✔️Element 1 - Market Trend
When you are planning a swing trade, it is highly recommendable that the direction of your trade would match with the direction of the market trend.
If the market is trading in a bullish trend, you should look for buying the market while if the market is bearish, you should look for shorting.
Take a look at CHFJPY pair on a daily. Obviously, the market is trading in a bullish trend and your should look for swing BUYING opportunity.
✔️Element 2 - Key Level
You should look for a trading opportunity from a key structure.
IF the market is bullish, you should look for buying from a key horizontal or vertical SUPPORT, WHILE if the market is bearish, you should look for shorting from a key horizontal or vertical RESISTANCE.
CHFJPY is currently approaching a rising trend line - a key vertical support.
Please, note that if the price is NOT on a key structure, you should patiently wait for the test of the closest one.
✔️Element 3 - Confirmation
Once the market is on a key level, do not open a trading position blindly. Look for a confirmation - for the sign of strength of the buyers, if you want to buy or for the sign of strength of the sellers, if you are planning to short.
There are dozens of confirmation strategies, one of the most accurate is the price action confirmation.
Analyzing a 4H time frame on CHFJPY, we can spot a falling wedge pattern. While the price is stuck within that, the minor trend remains bearish. Bullish breakout of the resistance of the wedge will be the important sign of strength of the buyers and can be your strong bullish confirmation.
Following these 3 conditions, you will achieve high win rate in swing trading. Try these techniques yourself and good luck in your trading journey.
❤️Please, support my work with like, thank you!❤️
I am part of Trade Nation's Influencer program and receive a monthly fee for using their TradingView charts in my analysis.
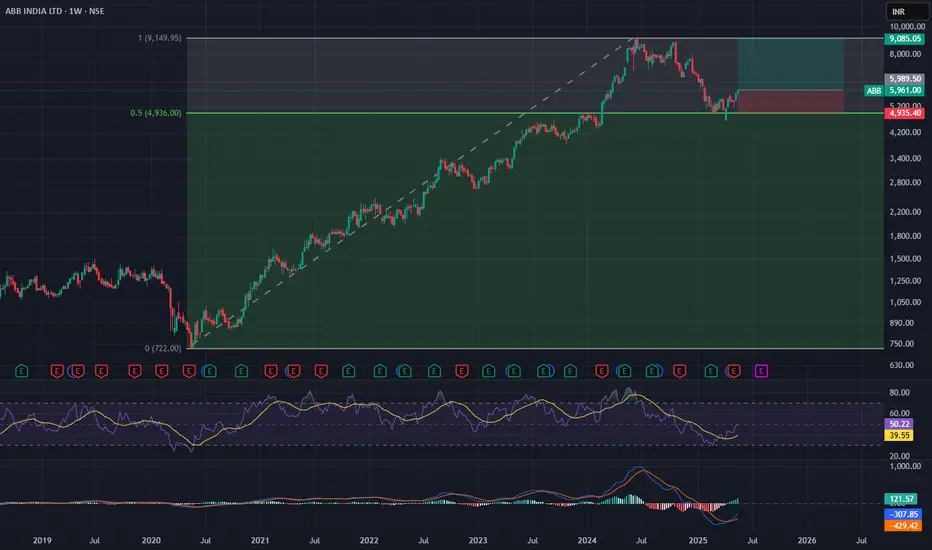
Possible Swing Trade in ABB1. MACD Signal turned green
2. RSI crossing above 50
3. Stock returning after forming a base at 50.0% retracement
5. Good weekly close
6. Risk - Reward is more than 2
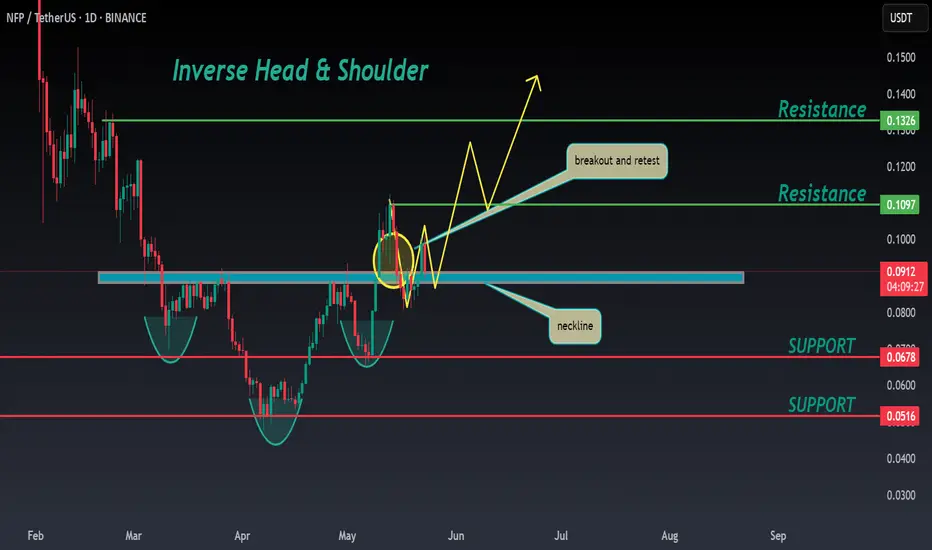
NFP ANALYSIS🚀#NFP Analysis : Pattern Formation💲💲
🔮As we can see in the chart of #NFP that there is a formation inverse head and shoulder pattern and it's a bullish pattern. Also there is a perfect breakout and retest of the levels. This indicates a potential bullish move.📈📈
🔰Current Price: $0.0910
🎯 Target Price: $0.1100
⚡️What to do ?
👀Keep an eye on #NFP price action. We can trade according to the chart and make some profits. The price must close above the neckline. After that we will see a bullish move. ⚡️⚡️
#NFP #Cryptocurrency #TechnicalAnalysis #DYOR
CRWD – Flat Top Breakout to All-Time HighsCrowdStrike ( NASDAQ:CRWD ) is breaking out of a flat top consolidation, pushing to new all-time highs — a clean momentum setup that’s hard to ignore.
🔹 Price has been compressing just under ATHs with multiple tests of the same level — a classic flat top breakout pattern.
🔹 Today’s breakout candle is strong, with solid volume and follow-through.
🔹 This setup is all about price acceptance at new highs — and the bulls are showing up.
My Trade Plan:
✅ Entry: On breakout through the flat top
⛔️ Stop: Just below today’s low — keep risk tight
🚀 Target: Ride momentum — trail stop as price extends
Why I like this setup:
Clean structure, strong trend, defined risk
ATH breakouts often lead to trend acceleration if supported by volume
panw had their earnings today and gapped down it still has broken loose this is a good sign

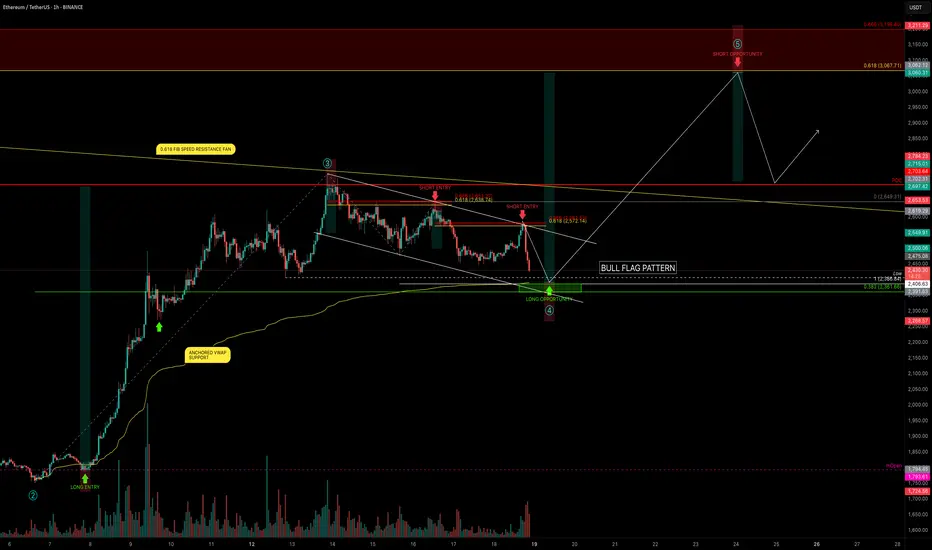
ETH — Bull Flag or Trap? Trade Plan with TargetsETH is setting the stage for its next major move — and the chart is packed with clues.
After completing Wave 3 at $2738.50, ETH has entered a corrective phase, forming what looks like a bullish flag. But beneath the surface, smart money levels are aligning: VWAP, Fibs, key levels, and liquidity traps are all converging around one high-probability zone.
This analysis breaks down both the long and short setups, backed by real confluence and clean R:R opportunities. Whether you’re planning to snipe the reversal near support or fade the rally at resistance, you’ll walk away with a clear trade plan and deeper insight into how price reacts at precision levels.
Let’s get into it.
🟢 Bullish Scenario: Long Setup with Deep Confluence
After a fakeout pump into the golden pocket of this minor downtrend (typical for a Sunday), ETH rejected cleanly at the upper resistance of the bull flag channel.
We're now watching for the swing low at $2406.63 to be swept, setting up a potential SFP (Swing Failure Pattern) at a highly confluent support zone:
🔍 Confluence at the $2390–$2360 Zone:
Anchored VWAP from the Wave 3 origin at $1752 is sitting at $2390
Trend-Based Fib Extension 1:1 of the correction lands at $2386.84
Liquidity pool just under the recent swing low
0.382 Fib retracement of the entire Wave 3 at $2361.66
0.618 Fib Speed Resistance Fan intersects this zone
Lower bull flag support line also aligns
This makes the $2390–$2362 zone a high-probability bounce area.
📌 Plan:
Laddered long entries between $2390–$2362, watching closely for a clean SFP or reversal signal.
Target 1: $3000 psychological level
Target 2: 0.618 Fib retracement at $3067.71 (potential Wave 5 top)
Stop-loss: Below previous yearly open (can be tightened after confirmation)
R:R: 1:5 or better after SL adjustment
🔴 Bearish Scenario: Short Setup at Key Rejection Zone
If ETH makes a move up to complete the 5th wave, we monitor $3067.71 — the 0.618 retracement of the entire corrective leg — as a key resistance.
If price rejects here with momentum loss or bearish structure:
📌 Plan:
Short on confirmed rejection of $3067.71
Stop-loss: Above $3211 (above 0.666 Fib)
Target: Previous high near $2700 or lower
R:R: 1:2 or better depending on entry and structure
🧠 Educational Insight: Why Confluence Increases Probability
Many traders chase setups based on single indicators. Real edge comes from stacking independent tools: VWAPs, Fibs, FVGs etc... When they align, the setup isn’t random — it’s high conviction.
This strategy gives you a framework to anticipate where price is likely to move and why, rather than reacting emotionally.
Patience and preparation will always outperform panic and reaction. Trade the plan — not the impulse.
___________________________________
If you found this helpful, leave a like and comment below! Got requests for the next technical analysis? Let me know.
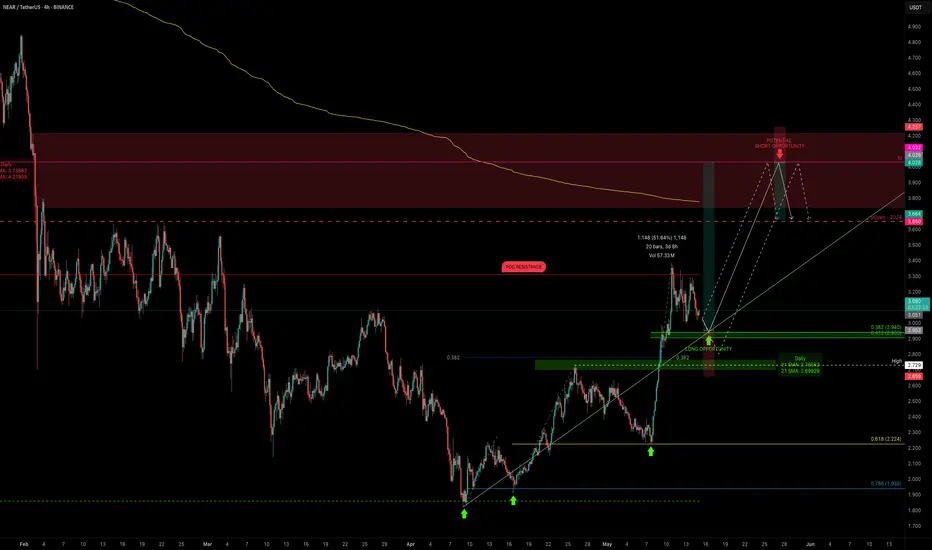
NEAR’s Pullback Zone Found — Is $4 Next?NEAR just pulled off a +50% rally from the 0.618 Fibonacci retracement at $2.224 — a strong show of force from the bulls. After that explosive move, price is now cooling off in a consolidation phase, preparing for the next leg higher.
🟢 Long Setup — Dip Before Lift?
The next high-probability long zone lies between:
$3.026 – $2.94
Possible but less likely of a deeper dip to $2.78 (0.5 Fib of the recent move)
Long entries can be laddered between $3.00 and $2.90 (even $2.80 if volatility kicks in).
Stop-Loss: Below the daily 21 EMA ($2.7344) and 21 SMA ($2.6739)
Target: $4.00
R:R: ~4:1 — clean and structured
This setup aligns with standard continuation behaviour after strong impulses — consolidation, retrace, and resume.
🔴 Short Setup (on Rejection at $4.00)
Entry: ~$4.00
Stop-Loss: Above $4.25
Target: Yearly open (~$3.65)
R:R: ~1.5:1 — not ideal, but valid on confirmation
🎯 Summary
NEAR is consolidating after a strong move — either ready to continue higher or retest deeper into Fib support
Long zone: $3.00–$2.90 (poss. $2.80)
Short zone: $4.00 (on rejection only)
Simple structure, clean risk, and nothing forced — exactly how it should be.
Sometimes, less is more. Let price show the next move. Stay ready. 📈
___________________________________
If you found this helpful, leave a like and comment below! Got requests for the next technical analysis? Let me know.