PEAQ — Fibonacci Meets Wyckoff Structure +100% SetupAfter more than 70 days of sideways action, PEAQ is finally showing signs of life — with a well-defined structure that suggests accumulation is giving way to a potential new trend.
What we’re seeing aligns closely with a classic Wyckoff Accumulation pattern. A local bottom formed around the psychological $0.10 level, followed by a clean breakout — marking a potential Sign of Strength (SOS).
Now comes the real opportunity.
Wyckoff Accumulation Structure
Following the long consolidation range:
🔹 Phase D: Breakout from range = Sign of Strength (SOS)
🔄 Current: Pullback = potential Last Point of Support (LPS)
The recent correction has now retraced into the 0.786 Fib zone of the impulse wave — a deeper but still healthy retracement for Wyckoff structure. Notably, this level also coincides with the previous highs that PEAQ broke out from, now flipping into support. A perfect test of demand.
🔍 Confluence Zone Breakdown
0.786 Fibonacci retracement: ~$0.1312
Previous highs: ~$0.14
Monthly open: $0.1289 (ideal invalidation level)
These overlapping signals create a tightly packed support zone that defines the next high-probability long setup.
🟢 Long Setup — 0.786 ($0.1312)
Entry: $0.1312
Same stop-loss: $0.125 (below mOpen)
Targets: $0.2589 and 1.618 Trend-Based Fib Extension target at $0.2694
R:R: ~16:1+
Potential upside: +100%+
📘 Educational Insight: Wyckoff Meets Fibonacci
This setup is a combination of Wyckoff theory and Fibonacci structure:
SOS breakout signals strength
LPS pullback into 0.786 Fib = high-probability continuation zone
Previous highs now acting as support
When structure, confluence, and psychology align — you don't chase. You wait.
📌 Summary
✅ 70+ days of accumulation
✅ SOS confirmed
🔁 Now retracing to LPS around $0.131
🔒 Monthly open provides clear invalidation
🎯 Targets: $0.2589 and $0.2694
💰 Potential R:R: 16:1+
Each chart is a lesson. Read it with patience, trade it with purpose.
___________________________________
If you found this helpful, leave a like and comment below! Got requests for the next technical analysis? Let me know.
Swingtrading

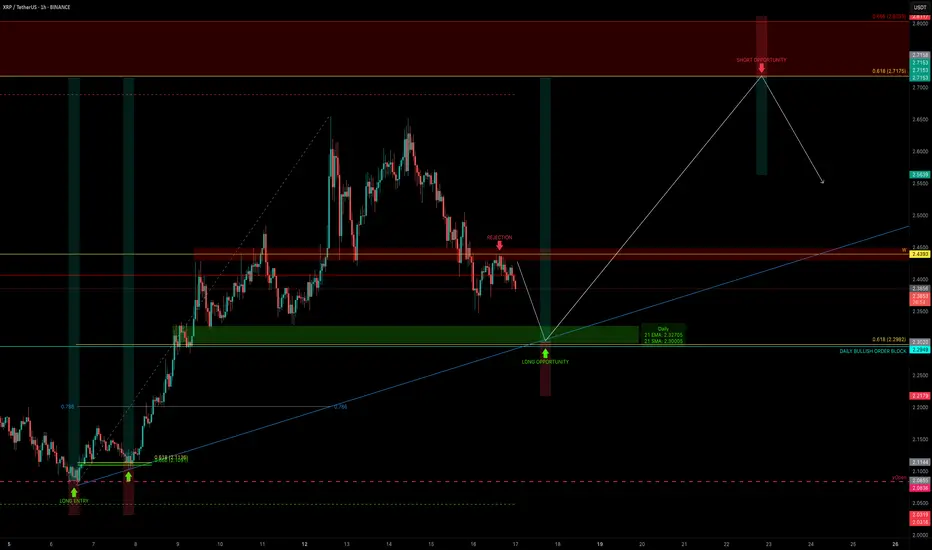
XRP Correction Complete? — Long Setup Aligned with Fib & OBXRP has completed a 5-wave impulse move. As expected, XRP is now in a corrective phase, pulling back after rejecting from a key resistance — and it’s doing so with technical precision.
The question now: where is the next high-probability long setup? Let’s break it down.
🧠 Market Structure & Key Zones
Using Fibonacci retracement from the base of the 5-wave impulse, we now have a potential golden pocket target aligned with major confluence.
🔽 Support Zone
🔹 0.618 Fib retracement: $2.2982
🔹 Daily Bullish Order Block: $2.2949
🔹 Daily 21 EMA: $2.329
🔹 Daily 21 SMA: $2.301
🔹 Liquidity pool
🔹 0.786 Fib Speed Fan (only if price drops between May 17–18)
This creates a high-confluence support cluster at ~$2.3 — a prime candidate for a long re-entry.
🟢 Long Trade Setup
Entry: Ladder between $2.32 and $2.28
Stop-loss: ~$2.21
Target: $2.7175 (0.618 Fib retracement of the corrective downtrend)
R:R: ~5:1
🔴 Short Setup (Conditional)
Trigger: Rejection at $2.7175
Entry: ~$2.7175
Stop-loss: Above $2.8033 (0.666 Fib) → set at ~$2.811
Take Profit: ~$2.56 or lower
R:R: ~2:1+ (dependent on entry confirmation and PA behaviour)
Shorts only valid if a clear rejection or SFP pattern emerges. If momentum is strong, this level may break — so wait for structure to confirm.
📘 Educational Insight: Why Confluence Matters
Too often, traders chase single-indicator signals. But real edge comes from confluence — when multiple tools (Fibs, MAs, Order Blocks, Liquidity, VWAPs, FVG, Speed Fans etc.) agree on the same zone. This alignment not only increases confidence in your entry, but also sharpens your risk management.
Think of it as building a case — the more aligned evidence you have, the stronger your trade thesis becomes.
📌 Summary
XRP is in a corrective phase after a 5-wave impulse
Clean rejection from weekly resistance → continuation of bearish trend
Long zone: ~$2.3
SL: ~$2.21 | TP: $2.7175 | R:R ~5:1
Optional short: $2.7175 rejection → SL $2.811 | TP $2.56
Precision isn’t about predicting — it’s about being ready when the chart speaks with clarity. Patience makes probability powerful.
___________________________________
If you found this helpful, leave a like and comment below! Got requests for the next technical analysis? Let me know.
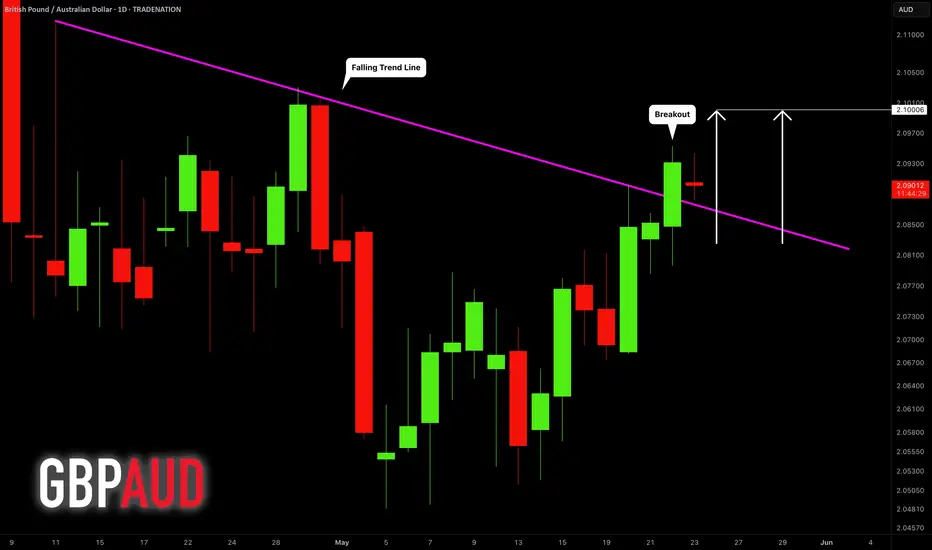
GBPAUD: Important Breakout 🇬🇧🇦🇺
GBPAUD broke and closed above a significant falling trend line on a daily.
The next strong resistance is 2.1 level.
It will most likely be the next goal for the buyers.
❤️Please, support my work with like, thank you!❤️
I am part of Trade Nation's Influencer program and receive a monthly fee for using their TradingView charts in my analysis.
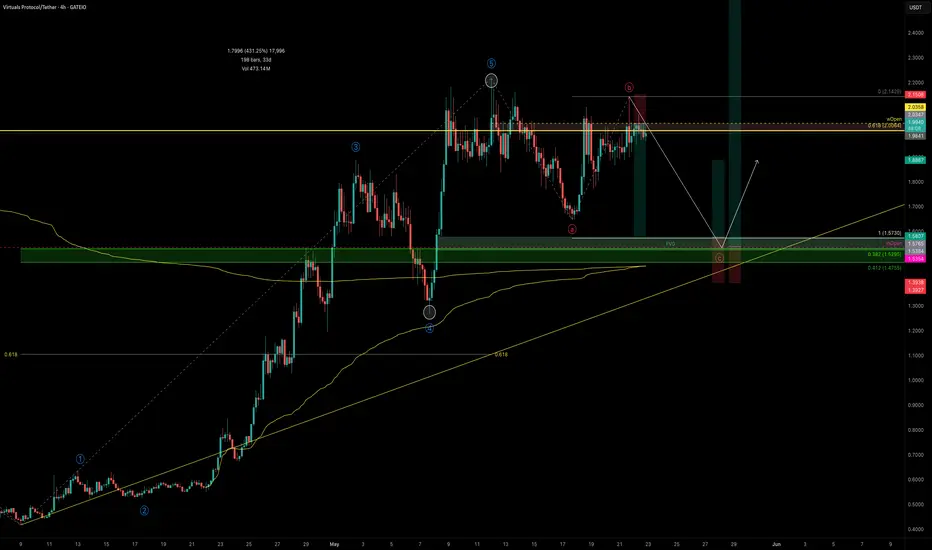
VIRTUAL TA Masterclass — Elliott Wave Meets Gartley HarmonicVIRTUAL has been on fire! Printing a clean 5-wave Elliott impulse with a +431% run in just 33 days. But after every strong trend comes a healthy correction, and that’s where we likely are now. Trading below key resistance and showing signs of exhaustion. The question: Where is the next high probability trade setup?
Let’s break down what the chart is telling us.
🧠 Structure Overview
Wave 5 peaked at $2.2169
Wave A dropped -25%
Wave B bounced +30%
Currently: VIRTUAL's trading under the $2 psychological level and weekly open ($2.0358) → signs of momentum cooling
A corrective Wave C is likely underway, and all signs point toward a very specific zone.
⚠️ Liquidity Dynamics
The longer VIRTUAL grinds sideways near $2.00 without showing real momentum, the more vulnerable late long positions become:
Retail traders are buying resistance
SLs are likely clustered just below Wave A’s low
This creates a liquidity pocket waiting to be swept — perfect fuel for Wave C
🔍 The $1.58–$1.47 Support Cluster: 14 Layers of Confluence
This zone isn’t guesswork — it’s loaded with technical overlap:
1️⃣ 1:1 Trend-Based Fib Extension of Wave A → $1.573
2️⃣ Monthly Open → $1.5354
3️⃣ 0.382 Fib Retracement of the entire rally → $1.5295
4️⃣ Bullish Fair Value Gap → $1.57–$1.53
5️⃣ Anchored VWAP from ATH → ~$1.46
6️⃣ Anchored VWAP from Wave 3 → ~$1.46
7️⃣ 0.618 Fib Speed Fan Support (~end of May timing)
8️⃣ 4H 233 SMA → ~$1.52
9️⃣ 4H 200 EMA → ~$1.52
🔟 Daily 200 SMA → $1.5251
1️⃣1️⃣ Weekly 21 SMA → $1.462 (reinforces the VWAP zone)
1️⃣2️⃣ Declining Daily Volume → momentum weakening
1️⃣3️⃣ Liquidity Pool below Wave A → likely to be swept
1️⃣4️⃣ $2 = Golden Pocket Resistance + Psychological Barrier
🔴 Short Trade Setup (Active as Long as SFP Holds)
For those favouring downside continuation toward the Wave C target, a short setup is in play:
Entry: Weekly open retest around $2.0358
Stop-loss: Above SFP high at $2.143
Target: 1:1 Trend-Based Fib Extension of Wave A → $1.573 or the Swing Low of Wave A at $1.647
R:R ≈ 1:4 — a solid, well-structured short opportunity
As long as price remains below the SFP and the $2.00 golden pocket resistance, bears maintain control.
🟢 Long Trade Setup
Entry: Ladder between $1.58–$1.47
Avg. Entry: ~$1.53
SL: Below $1.40
TP1: $1.88 (local resistance) → R:R ≈ 1:2.5
TP2: $3.33 (0.618 Fib of entire bear market) → R:R ≈ 1:12
👉 Bonus TP for Harmonic Setup: 0.618 Fib of CD leg
✨ Bonus Confluence: Potential bullish Gartley Harmonic in Play
VIRTUAL is also forming a valid Gartley harmonic pattern — one of the most reliable reversal setups in classical trading theory.
🔸 XA: B retraced to 0.602 → ✅ (criterion: ~0.618)
🔸 AB: C retraced 0.87 → ✅ (valid range: 0.382–0.886)
🔸 CD: Projected to complete at 0.786 of XA → ~$1.474
• CD is a 1.356 expansion of BC
• AB ≈ CD symmetry is valid
• TP = 0.618 retracement of CD leg
This adds even more weight to the $1.47–$1.53 buy zone.
📘 Educational Takeaway
The best setups don’t rely on one method — they align multiple disciplines. Here, we have Elliott Waves, Fibonacci retracements, anchored VWAPs, volume structure, moving averages, time symmetry, and now a harmonic pattern — all pointing to the same opportunity. Most traders never wait for alignment. That’s why most lose.
💬 Final Words
✍️ Smart trading isn’t about always being in a trade — it’s about being in the right one at the right time.
While others FOMO at $2, you wait for the right opportunity to come to you — where structure, liquidity, and probability all shake hands.
The patient are rewarded. Always.
___________________________________
If you found this helpful, leave a like and comment below! Got requests for the next technical analysis? Let me know.
Tesla - Don't get confused right here!Tesla - NASDAQ:TSLA - is about to create the bullish reversal:
(click chart above to see the in depth analysis👆🏻)
2025 has been a rough year for Tesla so far. With a drop of about -50%, Tesla is clearly breaking the average retail trader. But the underlying trend is still quite bullish and if position strategy, risk execution and mindset control are all mastered, Tesla is a quite rewarding stock.
Levels to watch: $275, $400
Keep your long term vision!
Philip (BasicTrading)

SUI — Breakout or Breakdown? Long & Short SetupsSUI has been trapped in a trading range for the past 6 days, consolidating between key levels and building up liquidity for the next big move. When price goes quiet like this after an impulsive structure, it’s not time to trade—it’s time to observe, analyse, and prepare.
So, where’s the next high-probability setup?
Let’s break it down:
🔹 Elliott Wave Context
From my previous SUI analysis, I identified a completed 5-wave impulse structure. After such a move, a corrective ABC pattern is typically next.
SUI has been respecting technical levels with surprising accuracy throughout this cycle—especially Fibonacci levels and key horizontal zones.
📉 ABC Correction in Progress?
Wave A appears to be completed, and Wave B was rejected at the yearly level in perfect confluence with the golden pocket (0.618–0.666) retracement of Wave A. This strongly suggests that Wave C is now unfolding.
Using the 1:1 trend-based Fib extension, the projected Wave C target lands at:
➡️ $3.6413
Let’s dig deeper—does this level hold up under further scrutiny?
🔍 Multi-Layered Confluence at $3.56–$3.64
Here’s what aligns at this potential support zone:
1:1 Fib extension (Wave A = Wave C) → $3.6413
0.55 Fib retracement (from $3.1132 to $4.2967) → ~$3.64
Volume Profile POC from prior range → ~$3.59
0.618 Fib retracement → $3.5653
Weekly level → $3.5594
21-Day EMA → $3.5537
21-Day SMA → $3.6319
0.75 Fib Speed Fan (if hit on May 16) → aligns with zone
This stack of levels gives us a tightly packed, high-conviction support area between:
📍 $3.56 – $3.646
___________________________________
🟢 Long Setup Idea:
Entry Zone: Ladder entries between $3.56 and $3.75
Stop-Loss: $3.4546 (beneath confluence zone)
Take-Profit Target: $4.588 (0.786 Fib retracement + -0.236 Fib extension)
R:R: ~5:1
🚫 Invalidation: If SUI reclaims the yearly level at $4.1152 before revisiting this support, the setup is invalidated.
🔴 Short Setup Idea:
If SUI pushes into the 0.786 Fib retracement at $4.588 and shows clear rejection (e.g., SFP, bearish engulfing, high-volume reversal), a short can be considered.
Entry: On rejection at $4.588
Stop-Loss: ~$4.714
Targets:
TP1: $4.325 (recent highs)
TP2: $4.1152 (yearly level)
🧠 Final Thoughts:
This is where trading becomes a game of patience. I’ve mapped both long and short setups based on structure, confluence, and price behaviour. Now it’s about waiting for price to come to your levels.
⏰ Alarms set.
📈 Let the chart do the work.
More updates to come as the range resolves. Stay sharp!
___________________________________
If you found this helpful, leave a like and comment below! Got requests for the next technical analysis? Let me know.

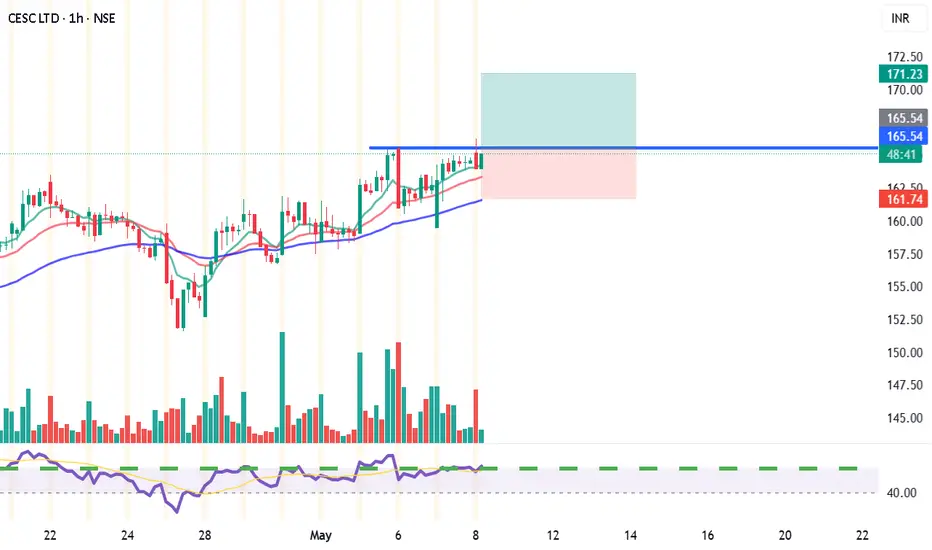
CESC Ltd – Short-Term Breakout Idea|Target: ₹171.00 CMP: ₹165.70
Recommended Buy Range: ₹164.50 – ₹165.00
Target: ₹171.00 🎯
Stop Loss: ₹161.50 🛡️
Timeframe: 15 min & 1H
Risk-Reward: ~1.4:1
Type: Momentum Breakout / Swing Trade
🔍 Technical Analysis:
✅ EMA Cross (9/13) bullish crossover
✅ Price trading above EMA-26
✅ RSI at 65 – bullish, not overbought
✅ BB %B around 1.0 – strong upper band breakout
✅ Volume spike supports the move
Watch for a strong close above ₹167 to confirm momentum toward ₹171.
For Education Purposes Only
$GOOGL - $185 Calls - September 19, 2025Trend line strategy with entry after bounce and take profits at fib levels - 176, 192, 206

Gold - This is still clearly not over!Gold - TVC:GOLD - just needs a moment to breathe:
(click chart above to see the in depth analysis👆🏻)
It is just incredible how Gold has been rallying lately. Just over the past 1.5 years, Gold is up another +80% and is creating new all time highs every month. Since these strong rallies continue a lot longer than most people think, Gold still has significant upside potential.
Levels to watch: $3.500, $4.000
Keep your long term vision!
Philip (BasicTrading)

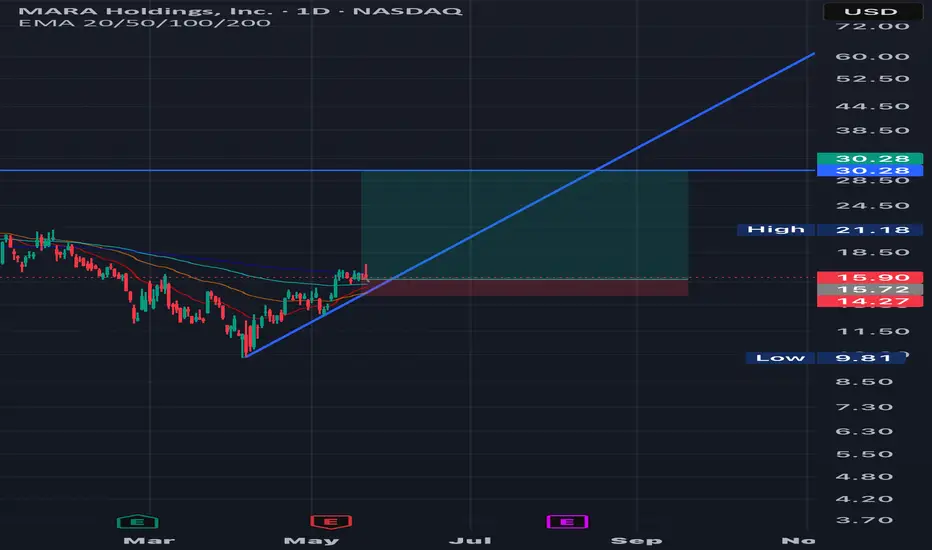
$MARA - $30 Call Option for September 19, 2025Enter close to the trend retest, stop loss behind the trend line, profit targets at support, gap, or Fibonacci levels such as $20, $25, and $30.
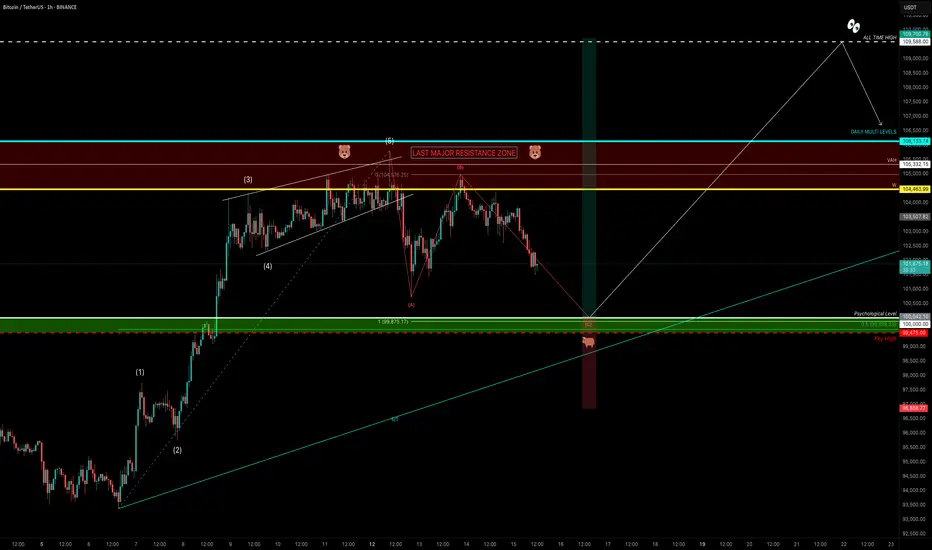
BTC Back to $100K — The Final Dip Before All-Time Highs?Bitcoin has been trading slowly and steadily just below its all-time high at $109588. The key question now is:
💭 Is BTC ready to break through and print a new all-time high? Or does it need one more dip before liftoff?
Let’s break it down.
Elliott Wave Structure & Market Context
BTC recently completed a clean 5-wave impulsive structure, with Wave 5 topping out into a major resistance zone. That confluence included:
Value Area High (VAH)
Weekly resistance
Daily multi-level clusters
Final resistance zone before price discovery
After multiple rejections from this zone, BTC lacked the momentum for a breakout — so a retracement was expected.
And that’s what we’re now seeing: a textbook ABC correction.
📉 ABC Correction Breakdown
✅ Wave A: Dropped sharply, nearly tapping the psychological $100K level
✅ Wave B: Retraced into the prior resistance band between $106133 and $104464 — rejected perfectly off the 0.786 Fib of Wave A
🔄 Wave C: Now unfolding
To project the potential bottom of Wave C, we use the trend-based Fib extension (Wave A = Wave C). The 1:1 extension lands at:
🎯 $99875 — Right at the $100K psychological magnet
Add this confluence:
🟢 Key swing high at $99475
✅ 0.5 Fib retracement of the entire 5-wave rally
🔍 Psychological Level: $100K
🔑 Liquidity and demand zone
This makes the $99K–$101K area a strong, high-conviction support zone.
🟢 Long Trade Setup
Entry zone: Ladder between $101K – $99K
Stop-loss: Below GETTEX:97K
Target: New all-time high at $109588
R:R: ~3:1+
Structure: Correction into high-confluence zone + psychological level = high probability setup
📌 Summary:
BTC likely finishing Wave C of ABC correction
$100K = confluence of Fib, structure, psychology, and liquidity
Setup is simple: Wait for price to retest this zone and trigger your plan
If this level holds, BTC may be ready to attempt a breakout into price discovery
Let the chart come to you — and trade the reaction, not the anticipation. 📉🔁📈
____________________________________
If you found this helpful, leave a like and comment below! Got requests for the next technical analysis? Let me know.
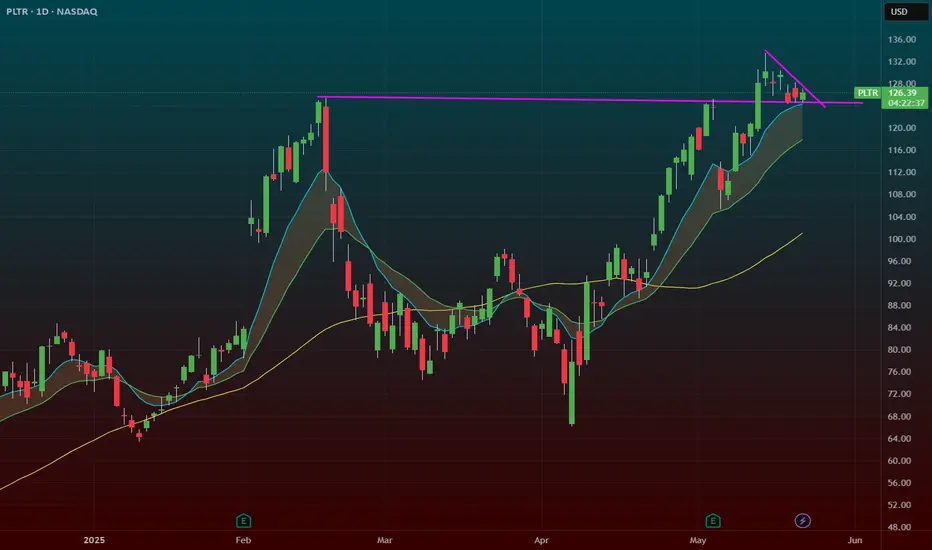
PLTR – Flag Breakout Above All-Time HighsPalantir is printing a bullish flag pattern right above its all-time highs — this is a textbook continuation setup that often leads to explosive upside.
🔹 After a strong breakout to ATHs, NASDAQ:PLTR has been consolidating in a tight range — a healthy pause.
🔹 Flags that form above prior resistance often act as launchpads when volume comes in.
🔹 Break over the flag highs could open the door to a new leg higher.
Setup Notes:
Watching for a breakout over the flag with volume confirmation.
Tight stop under the flag base keeps risk defined.
Price action remains bullish as long as it holds above previous ATHs.
🧠 This is one of my favorite setups — strong stock, strong base, strong trend.
this is the first pull after this initial thrust. The pullback has been boring and orderly too which i think is bullish for the stock
Buy Agnico Eagle Mines LimitedShort Term Trading Advice by Naranj Capital
Buy Agnico Eagle Mines Limited
● Buy Range- 108.5 - 112
● Target- 116 - 118
● StopLoss- 104.5
● Potential Return- 4-5%
● Duration- 14-15 Trading Days

SOL Trade Blueprint: Waiting for the High-Conviction EntryAfter printing a SFP at the key high of $180.52 followed by a sharp -8% rejection, SOL made a second attempt to breach the major resistance zone between $180–$185 — but once again, bulls fell short. Since then, price has been in a corrective phase. So the big question is: where’s the next high-probability trade setup? Let’s zoom out and break it down.
📏 Zooming Out: Structure, FVG & Fib Confluence
Back on May 8th, SOL broke through the April 25th swing high at $157 with strong momentum, leaving behind an untested Fair Value Gap (FVG) — a key displacement area that’s yet to be filled. When we draw the Fibonacci retracement from the low of that move to the current high, the 0.618 retracement lands precisely at $157.34 — right on the old breakout high. That’s a beautiful confluence.
Timing-wise, if SOL pulls back to that level between May 21–22, the 0.75 Fib speed fan also kicks in — adding dynamic trendline support to the static Fib level.
📉 What About the $164 Golden Pocket?
There's a golden pocket forming around $164 from a recent mini-impulse, and while it may look tempting, context matters. This pocket isn't supported by enough confluence — no major structure, volume shelf, or EMA alignment. For a quick scalp? Yes. But for a high-conviction swing? It's not ideal.
Remember, in trading we're not here to chase every candle — we're here to wait for the setups that stack the most reasons to say yes.
📍 The Zone to Watch: $157
Now let’s talk about that $157 zone — and why it’s standing out as the highest-probability long setup:
0.618 Fib retracement of the major impulse
Retest of the breakout swing high
Untested Fair Value Gap (FVG)
233 EMA + 233 SMA on the 4H timeframe lining up as dynamic support
1.5 outer pitchfork support line crossing through
1:1 trend-based Fib extension confluence
Prior area of interest
This is what we call a “stacked setup.” The more layers of confluence, the more conviction we have in the trade. Add to that the potential for a liquidity sweep (SFP) just below the current low at $159.44 — and it becomes a zone worth watching closely.
🎯 Long Setup:
Entry: $157–$159.44 (watch for SFP confirmation)
Stop-Loss: Below $154
Target: $200
R:R: Approx. 1:12 — a setup worth being patient for
🧠 Educational Note: Why Confluence Is King
High-probability trades don’t come from guessing. They come from stacking confluence: structure, Fibonacci, moving averages, time-based levels, pitchforks, VWAPs, volume profiles — the more that lines up, the less you need to hope and the more you can trust your edge. Think like a sniper, not a machine gun.
The market rewards patience and precision — not noise and FOMO.
🔻 Short Setup (Alternative Play)
While we’re primarily bullish, there’s a valid short opportunity at the psychological $200 mark — but only if price shows clear rejection and confirmation (e.g. SFP, bearish engulfing, high volume reversal).
Entry: $200 rejection
Stop-Loss: Above $205
Target: $185–$180
R:R: Approx. 1:3+
🔥 Final Words: Trade With Purpose
This is what trading is about — not chasing green candles, but waiting for structure, clarity, and alignment. Whether you’re trading long or short, focus on high-conviction setups backed by logic and levels, not emotion.
Don’t trade for action. Trade for precision. The market will always reward the patient ones who are willing to wait for that clean entry, stacked with reasons to act.
Trust the process, stay disciplined, and let the charts do the talking. 💪📈
___________________________________
If you found this helpful, leave a like and comment below! Got requests for the next technical analysis? Let me know.

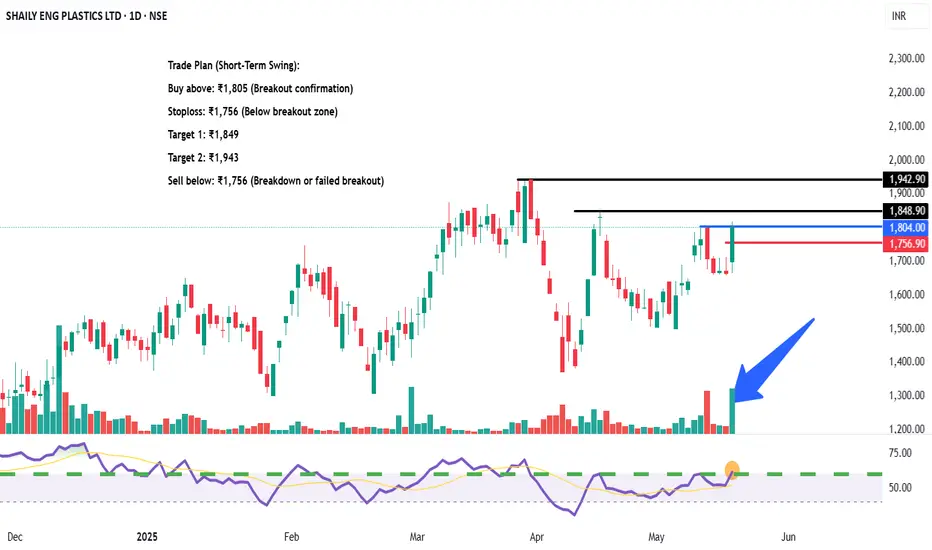
SHAILY ENG PLASTICS LTD – Breakout Watch | High Volume Spike📌 Trade Plan (Short-Term Swing):
Buy above: ₹1,805 (Breakout confirmation)
Stoploss: ₹1,756 (Below breakout zone)
Target 1: ₹1,849
Target 2: ₹1,943
Sell below: ₹1,756 (Breakdown or failed breakout)
🔍 Technical View:
Volume spike with bullish close – institutional interest likely
Breakout zone near ₹1,804 now acting as immediate support
RSI breakout supports momentum entry
Resistance: ₹1,849 and ₹1,943
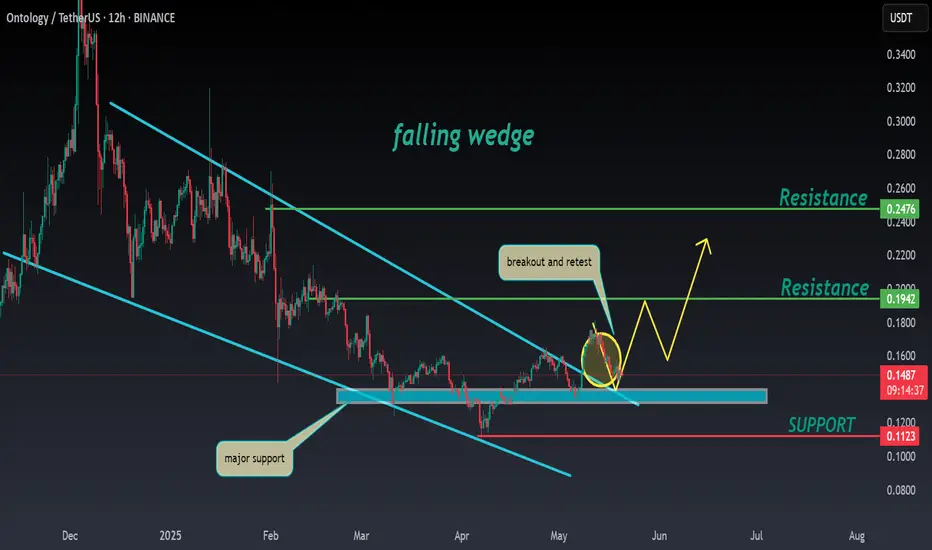
ONT ANALYSIS 📊 #ONT Analysis
✅There is a formation of Falling Wedge Pattern on daily chart with a good breakout and retest and currently trading around its support zone🧐
Pattern signals potential bullish movement incoming after the confirmation of retest
👀Current Price: $0.1483
🚀 Target Price: $0.1940
⚡️What to do ?
👀Keep an eye on #ONT price action and volume. We can trade according to the chart and make some profits⚡️⚡️
#ONT #Cryptocurrency #TechnicalAnalysis #DYOR
Xrp - Prepare for at least a +50% move!Xrp - CRYPTO:XRPUSD - will head much higher:
(click chart above to see the in depth analysis👆🏻)
Xrp has perfectly been respecting market structure lately and despite the significant volatility, the overall crypto market remains bullish. Especially Xrp is about to perform a bullish break and retest, which - if confirmed by bullish confirmation - could lead to a rally of about +50%.
Levels to watch: $3.0
Keep your long term vision!
Philip (BasicTrading)

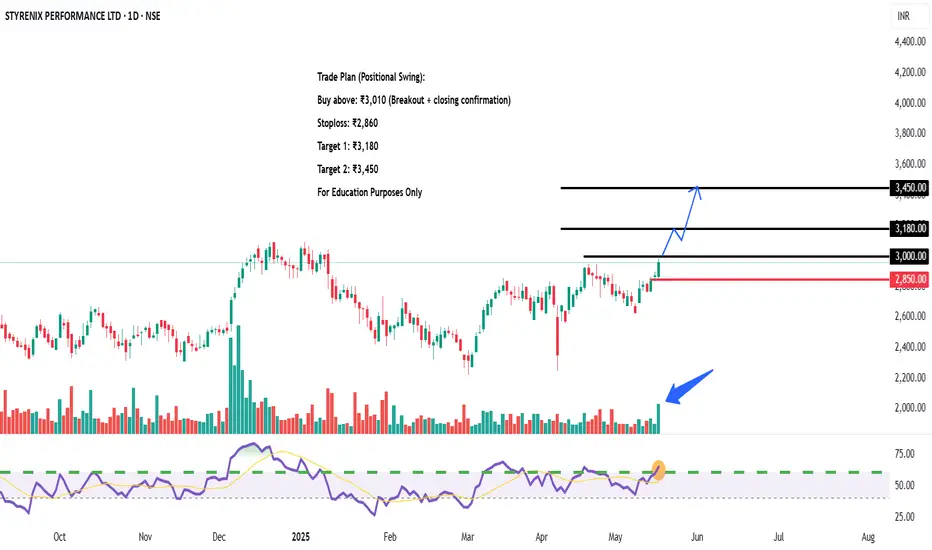
STYRENIX PERFORMANCE LTD – Near Resistance 🔍 Technical View:
Multiple BOS/CHoCH indicate structure shift
Strong low formed at ₹2,100 zone
Demand zones tested & respected between ₹2,400–₹2,600
RSI near breakout level (~70), indicating building momentum
📌 Trade Plan (Positional Swing):
Buy above: ₹3,010 (Breakout + closing confirmation)
Stoploss: ₹2,860
Target 1: ₹3,180
Target 2: ₹3,450
Sell below: ₹2,850 (If resistance holds or breakdown happens)
ETH ANALYSIS📊 #ETH Analysis
✅There is a formation of Falling Wedge Pattern on daily chart and currently trading around its major support zone🧐
Pattern signals potential bullish movement incoming after sustain above the major support zone
👀Current Price: $2380
🚀 Target Price: $2785
⚡️What to do ?
👀Keep an eye on #ETH price action and volume. We can trade according to the chart and make some profits⚡️⚡️
#ETH #Cryptocurrency #TechnicalAnalysis #DYOR

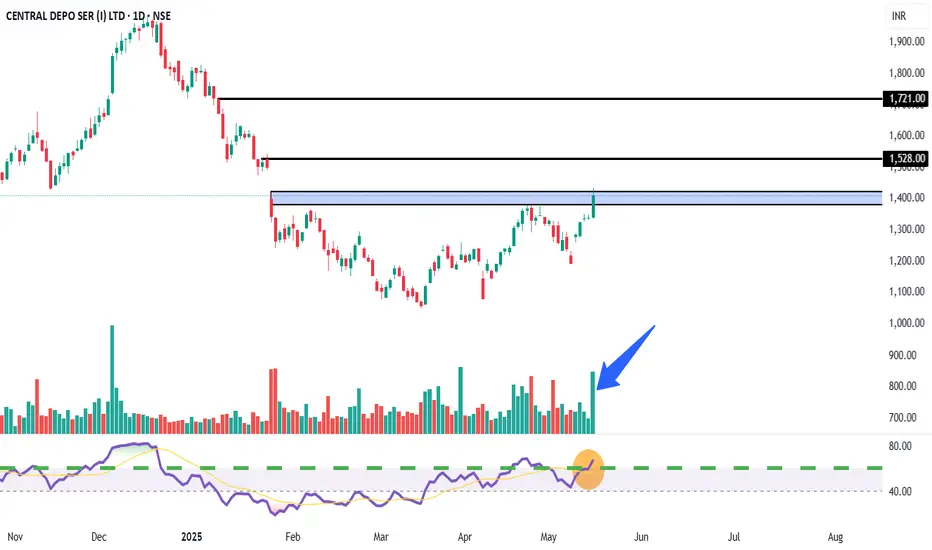
CENTRAL DEPO SER (I) LTD – Supply Zone Test Price has entered a major supply zone (₹1,390–₹1,440). Strong BOS (Break of Structure) confirms bullish momentum. RSI supports strength; breakout looks likely on volume surge.📌 Trade Plan (Swing/Positional):
Buy above: ₹1,445 (on breakout + closing basis)
Stoploss: ₹1,365
Target 1: ₹1,580
Target 2: ₹1,720
Sell Below (Rejection): ₹1,360 (if price gets rejected at supply)
🔍 Technical Highlights:
BOS and CHoCH indicate structure shift from bearish to bullish
Currently testing supply zone after BOS
Volume increasing with bullish candles
RSI approaching overbought — breakout likely, but confirmation needed
For Education Purposes Only
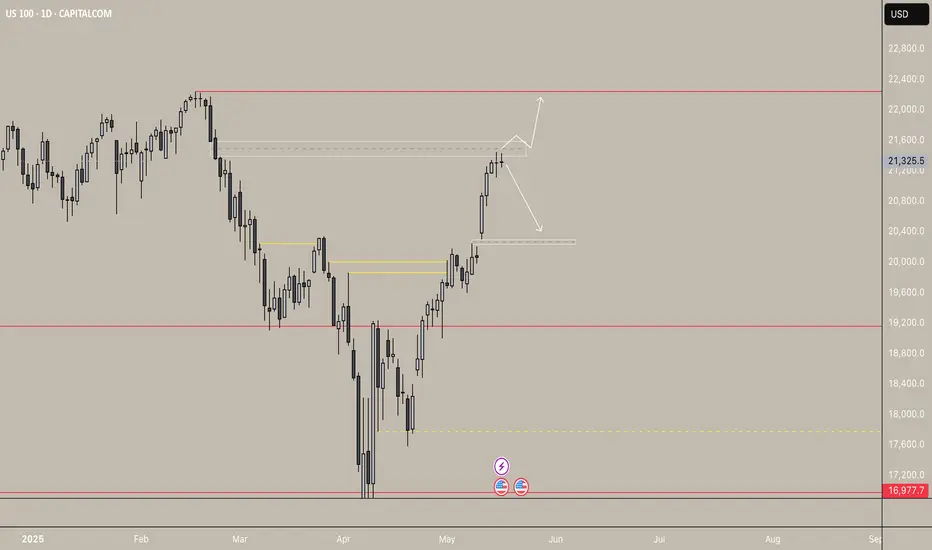
Nasdaq – Fair Value Gap (FVG) in Play: Breakout or Rejection?US100 is going up and reaching a critical inflection point, the Daily Fair Value Gap (FVG) between 21,500 and 21,700.
This FVG is not just any level; it’s the last inefficiency left by aggressive sellers, and the market is now deciding whether to reclaim or reject it.
Key Zones
- Daily FVG (Supply): 21,400 – 21,600
- Major Resistance: 22,400
Trade Scenarios
Bullish Continuation
A clean daily close above 21,600 confirms FVG reclamation.
Could trigger a momentum burst toward 22,250.
Ideal play: wait for consolidation above 21,700 or breakout-retest setup.
Bearish Rejection
Rejection from the FVG could lead to a retracement toward 20,300, where demand and a lower imbalance reside.
Look for rejection in the FVG zone.
Technical Takeaways
The FVG at 21,400–21,600 is acting as both a magnet and a battlefield expect volatility.
The impulsive move leading here lacks a clear retest, which may increase the probability of a short-term correction.
Momentum is strong, but traders should wait for confirmation not emotion.
Summary
The Nasdaq 100 is knocking on a daily FVG door and what happens next will set the tone for the coming weeks.
Above 21,600 = bull trend continuation
Rejection = short-term dip to 20,300 possible
What's your take, breakout or rejection?
Follow for real-time trade updates and educational charts.
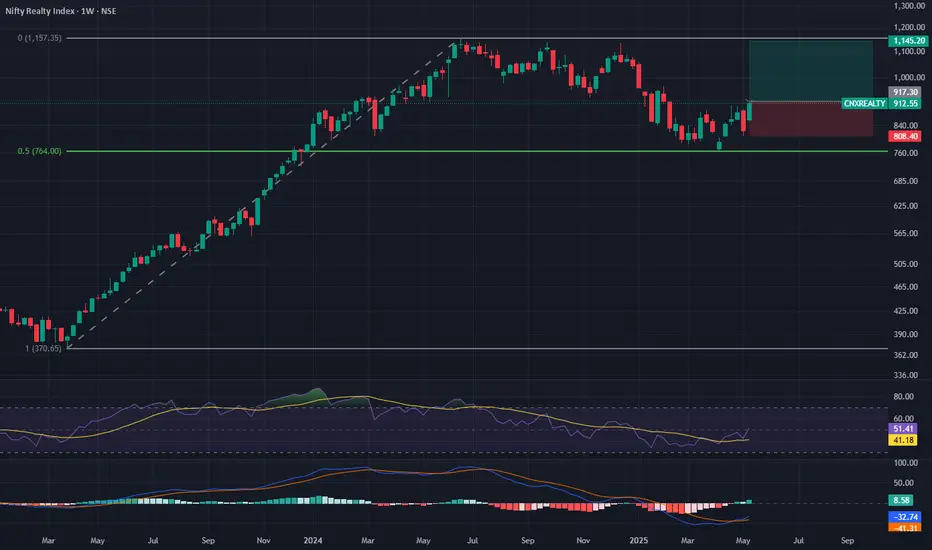
Possible Swing Trade in Realty Sector Index1. MACD Signal turned green
2. RSI crossing above 50
3. Index returning after forming a base at 50.0% retracement
4. Good weekly close
5. Risk - Reward is more than 2
Possible Swing Trade in IRCTC1. Good volumes
2. MACD Signal turned green
3. RSI crossing above 50
4. Stock returning after forming a base at 78.6% retracement
5. Good weekly close
6. Risk - Reward is more than 2
