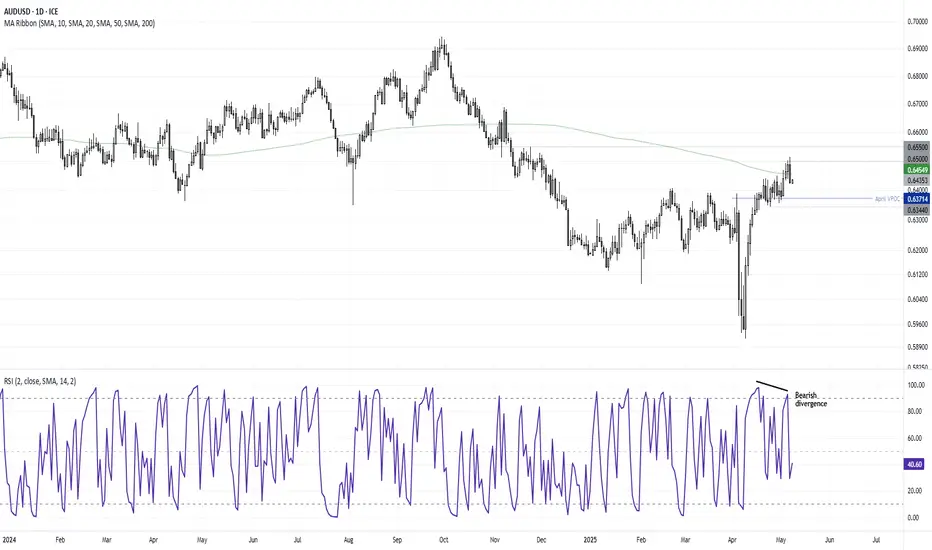
AUD/USD Looks Set for a PullbackThe V-bottom on AUD/USD certainly delivered for bulls, considering its low was printed amid a flurry of panicked headlines with the Aussie was on the brink of falling below 59c. But we're yet to see a pullback, even though it has been teasing one for a few weeks.
But given AUD/USD formed its most bearish day since April 4 on Wednesday, with a bearish engulfing candle which saw a false break of 65c before closing beneath its 200-day SMA, perhaps a pullback is imminent.
Also note the bearish divergence on the RSI (2).
Bears could seek to fade into moves towards the 200-day SMA, and retain a bearish bias while prices remain beneath Wednesday's high. A retest of the April VPOC at 0.6371 seems feasible, and a break beneath the 0.6344 low assumes a much larger correction is underway.
Matt Simpson, Market Analyst at City Index and Forex.com
Swingtrading
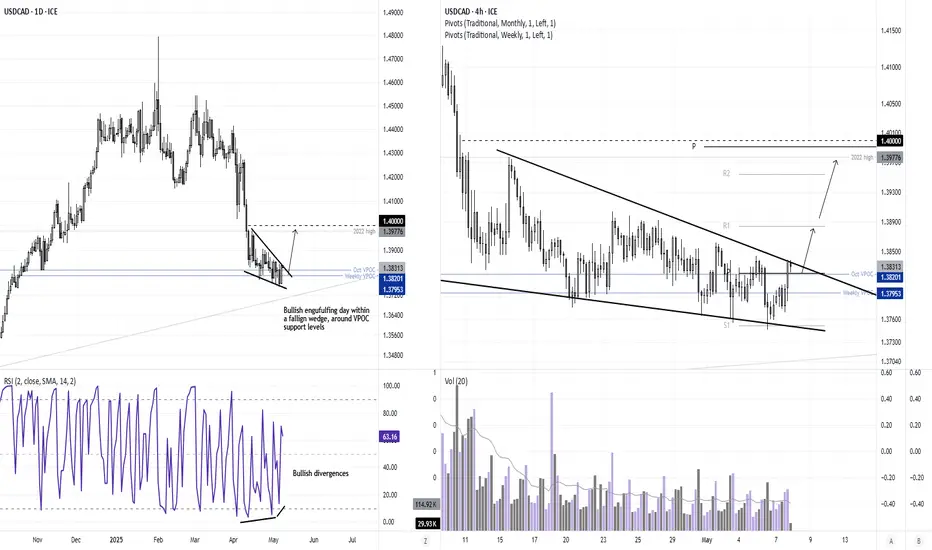
USD/CAD Hints at Bullish ReversalBearish momentum has continued to wane on USD/CAD, as bears continue to make hard work of fresh cycle lows. That has allowed a bullish RSI divergence to form on the daily chart alongside a falling wedge pattern.
That is has formed around historical VPOC (volume point of controls) adds further weight to the potential bullish reversal. Also note that a bullish engulfing candle formed on Wednesday to suggest a bullish breakout could be pending.
Bulls could seek dips towards the September VPOC in anticipation of a bullish breakout, and retain a bullish prices while they remain above recent swing lows. The core target is the base of the wedge, just below 1.4.
Matt Simpson, Market Analyst at City Index and Forex.com
Alibaba - This Chart Speaks In Money!Alibaba ( NYSE:BABA ) prepares for a significant pump:
Click chart above to see the detailed analysis👆🏻
Basically since Alibaba was listed on the NYSE, it always perfectly respected market structure. With the recent rejection away from the key neckline, Alibaba is now creating a bullish break and retest. After bullish confirmation, this forms a bottom and we might see new all time highs.
Levels to watch: $110, $140
Keep your long term vision,
Philip (BasicTrading)

CYBER ANALYSIS🚀#CYBER Analysis : Pattern Formation
🔮As we can see in the chart of #CYBER that there is a formation Inverse Head And Shoulder Pattern and it's a bullish pattern. If the candle breaks and sustain above the neckline then a bullish move could be confirmed✅
🔰Current Price: $1.290
⚡️What to do ?
👀Keep an eye on #CYBER price action. We can trade according to the chart and make some profits⚡️⚡️
#CYBER #Cryptocurrency #TechnicalAnalysis #DYOR

Potential break and retest of ATH's on SPOT!OptionsMastery:
🔉Sound on!🔉
📣Make sure to watch fullscreen!📣
Thank you as always for watching my videos. I hope that you learned something very educational! Please feel free to like, share, and comment on this post. Remember only risk what you are willing to lose. Trading is very risky but it can change your life!

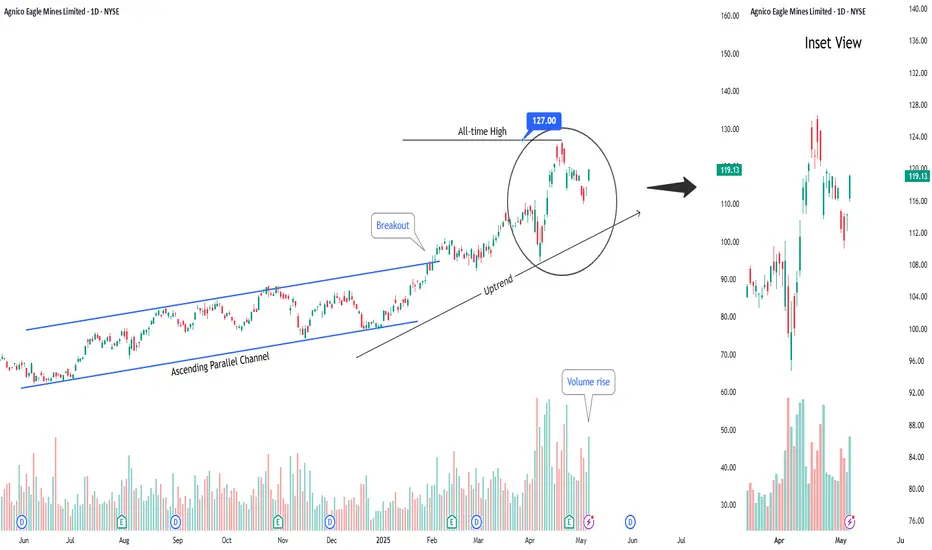
Buy Agnico Eagle Mines LimitedShort Term Trading Advice by Naranj Capital
Buy Agnico Eagle Mines Limited
● Buy Range- 116 - 119
● Target- 125 - 126
● StopLoss- 112
● Potential Return- 5-6%
● Duration- 14-15 Trading Days
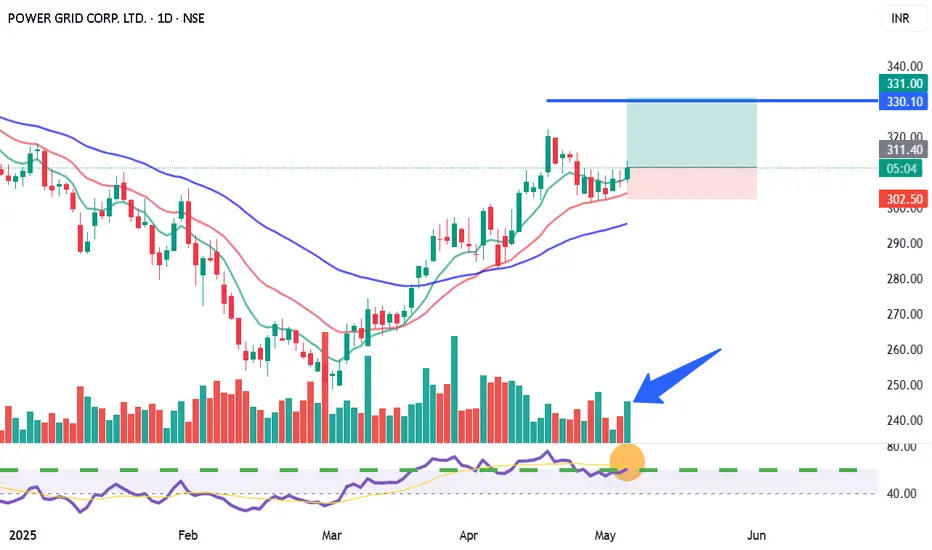
POWERGRID – Breakout Setup with Volume Spike📍 Entry Zone: ₹310.10 – ₹311.10
🎯 Target: ₹330.00
🛑 Stoploss: ₹302.00
📈 RSI has crossed above 60, volume confirms breakout momentum (🔵 arrow), and price is supported above key EMAs.
🔍 Strong bullish structure with clear higher lows and a clean breakout candle. Momentum shift confirmed with increasing volume.
For Education Purposes Only
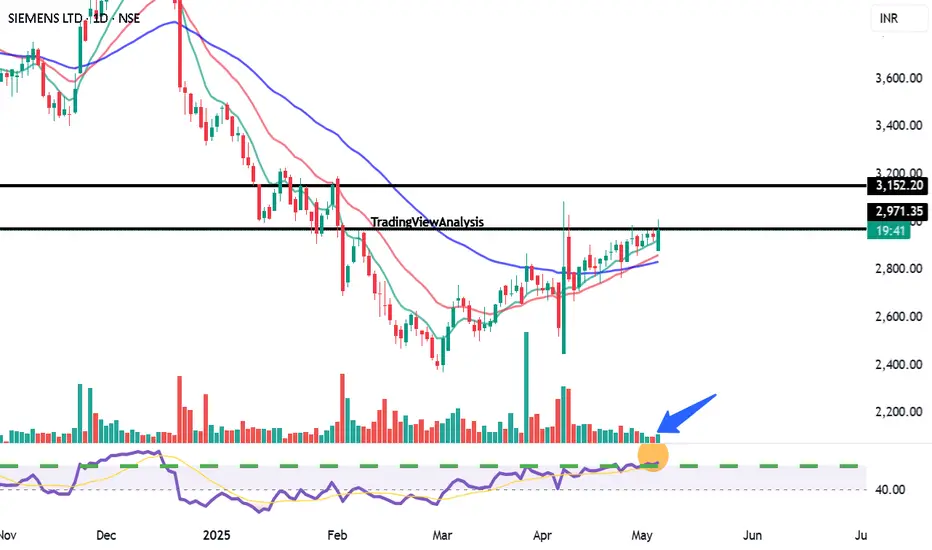
Equity Trade Setup – Siemens Ltd. (NSE: SIEMENS)Trade Type: Breakout + Channel Trend Continuation
🔹 Trade Details
Buy Zone (Entry): ₹2,982.00 – ₹2,987.00
Current LTP: ₹2,970.00
Stoploss (SL): ₹2,887.00 (below recent swing support)
Target (T1): ₹3,150.00
Target %: ~5.46%
Timeframe: 3–5 trading days
R:R Ratio: ~2:1
Confidence: Moderate to High (subject to intraday volume confirmation)
For Education Purposes Only
A potential setup on BA soon?OptionsMastery:
🔉Sound on!🔉
📣Make sure to watch fullscreen!📣
Thank you as always for watching my videos. I hope that you learned something very educational! Please feel free to like, share, and comment on this post. Remember only risk what you are willing to lose. Trading is very risky but it can change your life!

A break and retest setup on CHWY. OptionsMastery:
🔉Sound on!🔉
📣Make sure to watch fullscreen!📣
Thank you as always for watching my videos. I hope that you learned something very educational! Please feel free to like, share, and comment on this post. Remember only risk what you are willing to lose. Trading is very risky but it can change your life!

Double bottom and Demand on RIOT! OptionsMastery:
🔉Sound on!🔉
📣Make sure to watch fullscreen!📣
Thank you as always for watching my videos. I hope that you learned something very educational! Please feel free to like, share, and comment on this post. Remember only risk what you are willing to lose. Trading is very risky but it can change your life!

Sitting in Demand for PEP! OptionsMastery:
🔉Sound on!🔉
📣Make sure to watch fullscreen!📣
Thank you as always for watching my videos. I hope that you learned something very educational! Please feel free to like, share, and comment on this post. Remember only risk what you are willing to lose. Trading is very risky but it can change your life!

Break and retest of ATH's?OptionsMastery:
🔉Sound on!🔉
📣Make sure to watch fullscreen!📣
Thank you as always for watching my videos. I hope that you learned something very educational! Please feel free to like, share, and comment on this post. Remember only risk what you are willing to lose. Trading is very risky but it can change your life!

Nasdaq - Printing The Obvious Bottom!Nasdaq ( TVC:NDQ ) already finished the correction:
Click chart above to see the detailed analysis👆🏻
After we witnessed a minor "crash" of about -25% over the past couple of weeks, the bottom might be in on the Nasdaq. We simply saw another very bullish all time high break and retest and depite the possibility of a second retest, I am (still) extremely bullish at these levels.
Levels to watch: $17.000
Keep your long term vision,
Philip (BasicTrading)

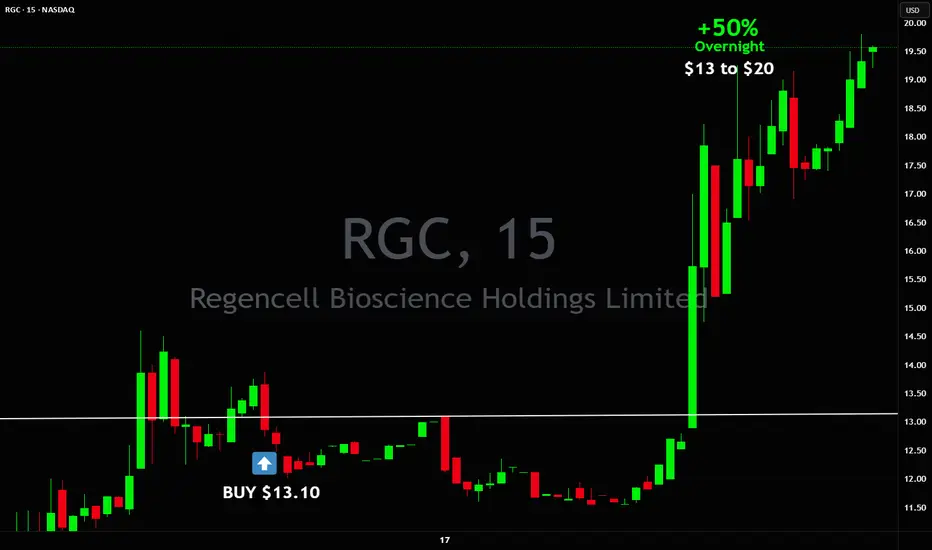
$13 to $20 overnight swing pick win so far $RGC$13 to $20 overnight swing pick win so far 🚀🤑👏 NASDAQ:RGC
Buy on Friday before market close at $13
Monday morning it's nearing $20
Equity Research Report – Polycab India Ltd.✅ Buy Levels
Buy Above: ₹5,800 (post breakout confirmation)
Ideal Entry on Dip: ₹5,765–₹5,785
🎯 Targets
Timeframe Target 1 Target 2 Target 3
15-min ₹5,870 ₹5,950 ₹6,070
1-hour ₹6,070 ₹6,220 ₹6,427 (Fib 61.8%)
🔻 Stop Loss
Intraday SL: ₹5,720
Positional SL: ₹5,650 (below trendline support and 20 EMA)
For Education purposes only

Break and retest setup on NFLX soon? OptionsMastery:
🔉Sound on!🔉
📣Make sure to watch fullscreen!📣
Thank you as always for watching my videos. I hope that you learned something very educational! Please feel free to like, share, and comment on this post. Remember only risk what you are willing to lose. Trading is very risky but it can change your life!

Potential buying opportunity on UNH!OptionsMastery:
🔉Sound on!🔉
📣Make sure to watch fullscreen!📣
Thank you as always for watching my videos. I hope that you learned something very educational! Please feel free to like, share, and comment on this post. Remember only risk what you are willing to lose. Trading is very risky but it can change your life!

AAL in a massive Weekly Demand! OptionsMastery:
🔉Sound on!🔉
📣Make sure to watch fullscreen!📣
Thank you as always for watching my videos. I hope that you learned something very educational! Please feel free to like, share, and comment on this post. Remember only risk what you are willing to lose. Trading is very risky but it can change your life!

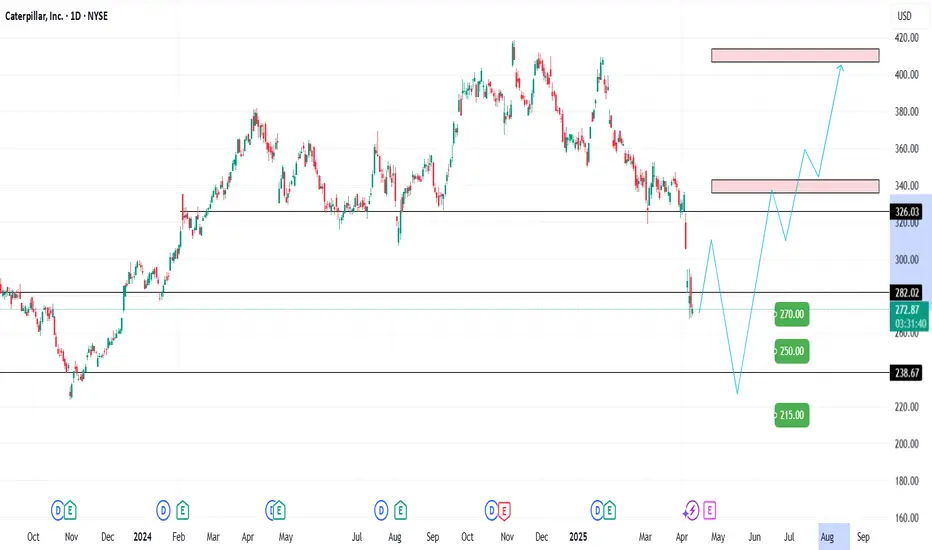
CAT TRADE IDEA – HEAVY EQUIPMENT, HEAVY POTENTIAL 📈🏗️🐾Sector: Industrials – Construction & Machinery
When the giants sleep, we prepare. And when they wake, we ride the momentum.
Caterpillar has been consolidating, and the recent pullback opens the door for a high-conviction setup. I'm looking to build my position in 3 strategic zones — scaling in with patience, letting the market give me the setup on my terms.
🟢 Entry Plan (Scaling In):
⚙️270 – First nibble as it approaches key structural support
⚙️250 – Historical support level and psychological round number
⚙️215 – Panic zone entry — if it hits here, it's a gift 🧨
🎯 Profit Targets:
320 – Swing back to resistance; first trim zone
370 – Momentum continuation with strong industrial tailwinds
400 – Full send 🚀 Long-term target if infrastructure demand and global growth trends align
🛡️ Risk Strategy:
Staggered entries allow for cost basis control
Adjust position sizing based on entry zone reached
💡 Why CAT?
Caterpillar’s fundamentals remain strong with global infrastructure spending on the rise, and the stock is approaching historical discount levels. This setup is about anticipating the bounce, not chasing it. Plan the trade, trade the plan.
📢 DISCLAIMER:
This is not financial advice. I'm sharing my personal trade plan for educational purposes only. Always do your own research and consult a licensed financial advisor before making any investment decisions. Trading involves real risk — respect it.
PCBLi Observed these Levels based on Price Action and Demand & Supply which is my own Concept "PENDAM CONCEPTS"... Please don't take any trades based on this chart/post... Because this chart is for educational purpose only not for Buy or Sell Recommendation... Thank Q

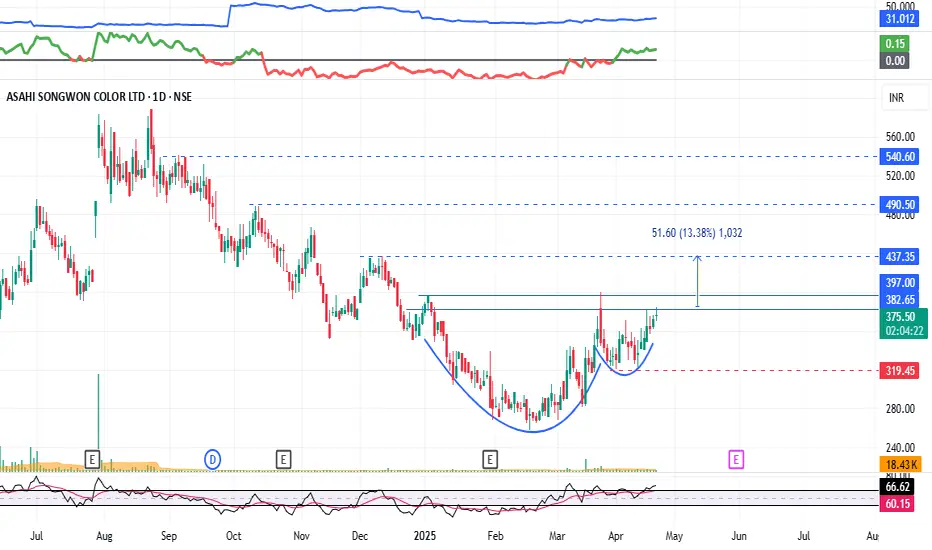
ASAHI SONGWON : Chart Pattern Breakout#ASAHISONG #cupandhandle #chartpattern #breakout #swingtrade #swingtrading
ASAHISONG : Swing Trade
>> Chart Pattern Breakout soon
>> Cup & Handle Visible
>> Volumes Dried up
>> Good Strength in Stock
Swing Traders can lock Profit at 10% and keep Trailing
Disc : Charts shared are for study Purpose & not a Trade Recommendation
Pls do uour Own Analysis or Consult ur Financial Advisor before taking any position, Dont go all in...plan ur Trades with Proper Position Sizing, Risk Management and clear plan.
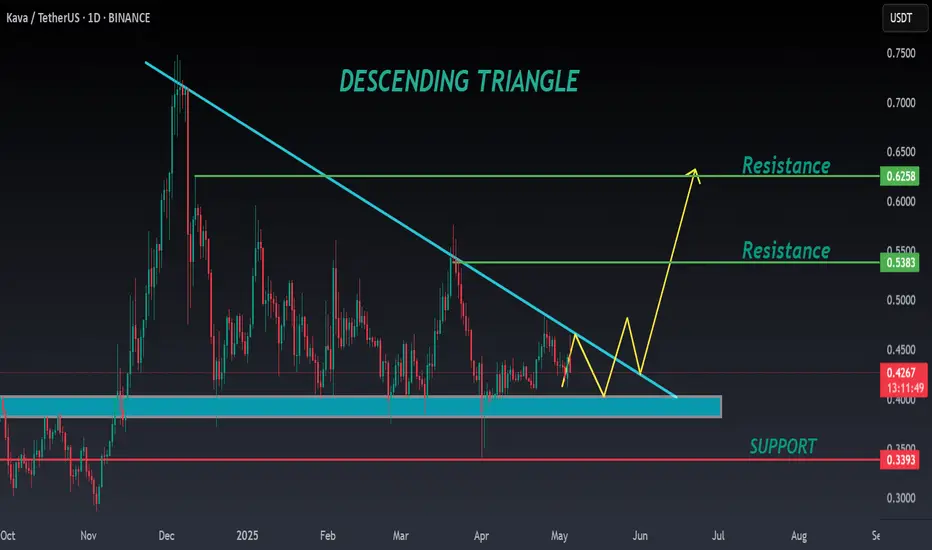
KAVA ANALYSIS📊 #KAVA Analysis
✅There is a formation of Descending triangle pattern on daily chart 🧐
Pattern signals potential bullish movement incoming after a breakout.
👀Current Price: $0.4280
🚀 Target Price: $0.5380
⚡️What to do ?
👀Keep an eye on #KAVA price action and volume. We can trade according to the chart and make some profits⚡️⚡️
#KAVA #Cryptocurrency #TechnicalAnalysis #DYOR