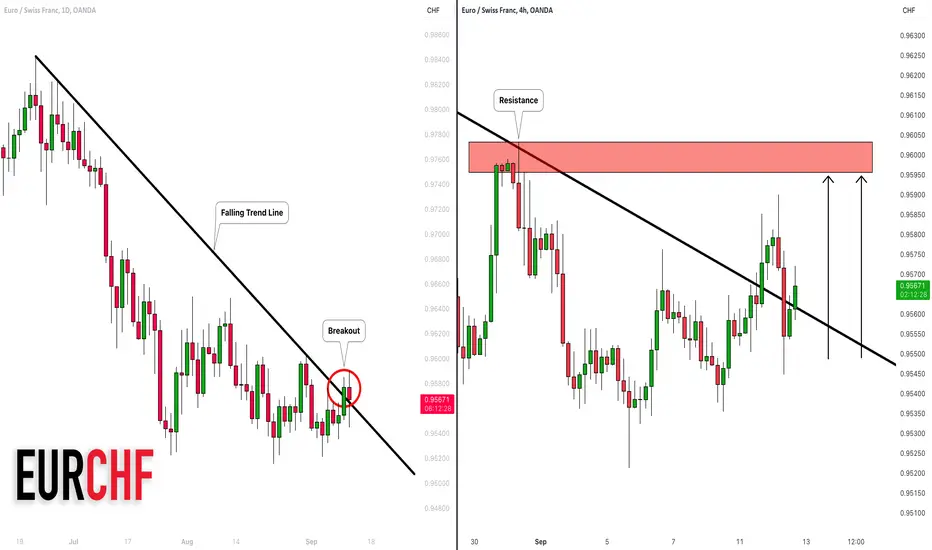
EURCHF: Consolidation Continues 🇪🇺🇺🇸
EURCHF broke and closed above a major falling trend line on a daily.
The market is currently retesting that.
I anticipate a growth to 0.9595 resistance.
❤️Please, support my work with like, thank you!❤️
Swissfranc
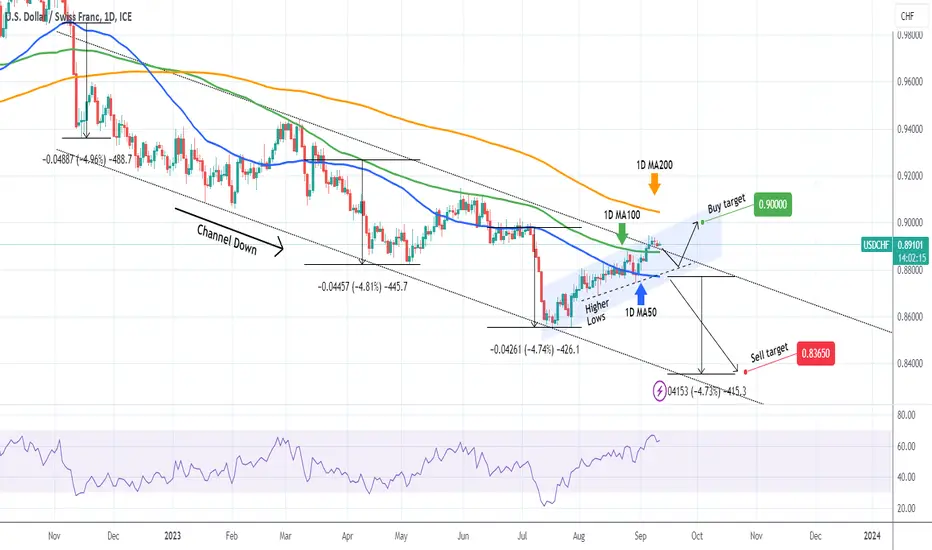
USDCHF Channel Up prevailing for now. Buy the dip.The USDCHF pair broke last week above the 1 year Channel Down and closed above the 1D MA100 (green trend-line) for the first time since November 09 2022. The price action has now completed five 1D candles above the 1D MA100 and the pattern that seems to be prevailing is a Channel Up (blue).
With the 1D RSI hit 67.00, almost turning overbought, so our intension is to wait for a Higher Lows (dashed trend-line) pull-back and buy the dip, targeting the 1D MA200 (orange trend-line) at 0.9000.
If the price closes a 1D candle below the 1D MA50 (blue trend-line), we will take the loss and turn bearish instead long-term. The target will be 0.83650 representing a -4.73% decline from the 1D MA50, which has taken place another 3 times already within this long-term Channel Down.
-------------------------------------------------------------------------------
** Please LIKE 👍, FOLLOW ✅, SHARE 🙌 and COMMENT ✍ if you enjoy this idea! Also share your ideas and charts in the comments section below! **
-------------------------------------------------------------------------------
💸💸💸💸💸💸
👇 👇 👇 👇 👇 👇
CHFSGD Bullish runHello traders,
We have yet another great market set up to take advantage of. The CHFSGD has been consolidating in a falling wedge. We have since seen an opportunity to take advantage of a trend violation on the daily timeframe. Should we close above the trendline today, we are definately bullish unti we reach our target set at 1.48927, this target was set by our primary observation of an ABCD trend hike which is currently in motion. We will now take the long trade and hold, should we not break out of our trendline, we will close this trade.
Disclaimer
NASDAQ Guru offers general trading signals that does not take into consideration your own trading experiences, personal objectives and goals, financial means, or risk tolerance.

Short CHFJPYFinally, CHFJPY broke the upward channel and firmed a triple top pattern.
On my view, its nice time to short this pair.
Trade safe.
Good luck.

After breaking support line Swiss Franc can continue to fallHello traders, I want share with you my opinion about Swiss franc. By observing the chart, we can see that the price some time ago bounced from the seller zone, which coincides with the 0.8870 resistance level, and made a strong downward impulse below the buyer zone, thereby breaking the 0.8870 resistance level and 0.8615 support level too. But later Swiss Franc rebounded and rose higher of the 0.8615 level and then it made a correction to the support line. After this price started to rise and in a short time rose to a resistance line, where later rebounded down started to fall. The Swiss Franc declined to the support line and then tried to rise, but after it reached the 0.8870 resistance level, the price rolled down and even made a fake breakout of the support line. Then the price a little time trades near the support line and a not long time ago Swiss Franc broke it and now trades below. I think that the price can fall a little more and then make a retest of this line. Next, the Swiss franc continues to decline, therefore I set up my target at the 0.8730 level. Please share this idea with your friends and click Boost 🚀

AUDCHF Buy signal within the Channel Down.The AUDCHF pair has been trading within a Channel Down pattern since the January 27 2023 High. The price is currently on a 2-week rise and following the completion of a 1D MACD Bullish Cross, it can extend to at least the 0.382 Fibonacci level based on the previous two Lower Lows of the Channel Down. As a result, we are targeting 0.58200, which would also make a technical contact with the 1D MA100 (green trend-line).
-------------------------------------------------------------------------------
** Please LIKE 👍, FOLLOW ✅, SHARE 🙌 and COMMENT ✍ if you enjoy this idea! Also share your ideas and charts in the comments section below! **
-------------------------------------------------------------------------------
💸💸💸💸💸💸
👇 👇 👇 👇 👇 👇

Support is giving upLooks like a cup and handle to the downside, continuation pattern. Support is giving up, take profit at the next phycological level 0.6400 but there is no limit how far down it can go. Just let it fall.

USDCHF: Important Decision Ahead! Your Plan 🇺🇸🇨🇭
Important decision is ahead on USDCHF.
The price is currently approaching a major falling trend line on a daily time frame.
If bulls manage to break and close above that, probabilities will be high,
that the pair will keep growing at least to 0.89
Alternatively, there is a strong horizontal support just below the current price levels.
If the market violates 0.882 levels and closes below that,
a bearish continuation will be anticipated at least to 0.878 support.
Wait for a breakout, then follow the market.
❤️Please, support my work with like, thank you!❤️

EURCHF - BEARISH MOVE📉Hello Traders👋🏻
Yesterday, The EURCHF Price Reached The Support Level (0.96771 - 0.96438)
Currently, This Key Level is Broken (Support Becomes New Resistance Level)🔥
So, I Expect a Bearish Move📉
i'm waiting for a retest...
-----------
TARGET: 0.95185🎯
___________
if you agreed with this IDEA, please leave a LIKE, SUBSCRIBE or COMMENT!
CADCHF: One More Bullish Confirmation 🇨🇦🇨🇭
As I predicted, CADCHF bounced from a key daily structure support last week.
Analysing 4H time frame, I spotted one more bullish signal.
This time, the pair broke and closed above a resistance line of a falling wedge pattern.
It indicates that the market may potentially go even higher.
Next goals - 0.6524 / 0.6544
❤️Please, support my work with like, thank you!❤️

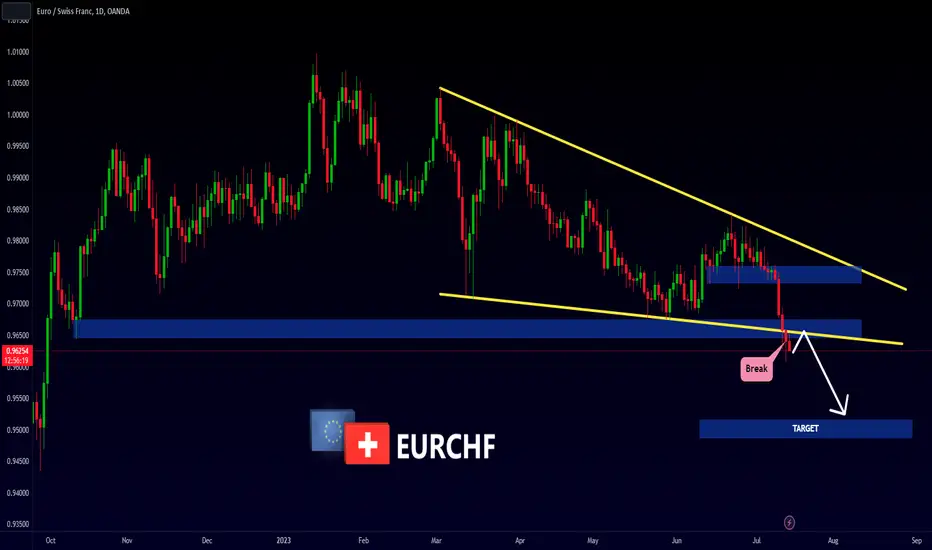
EURCHF: Important Zone to Watch 🇪🇺🇺🇸
EURCHF is trading in a long-term bearish trend.
After a consolidation, the price violated a key horizontal support and closed below that.
The broken structure and a major falling trend line now compose the contracting zone of supply.
I will expect a bearish movement from that at least to 0.953 support.
❤️Please, support my work with like, thank you!❤️

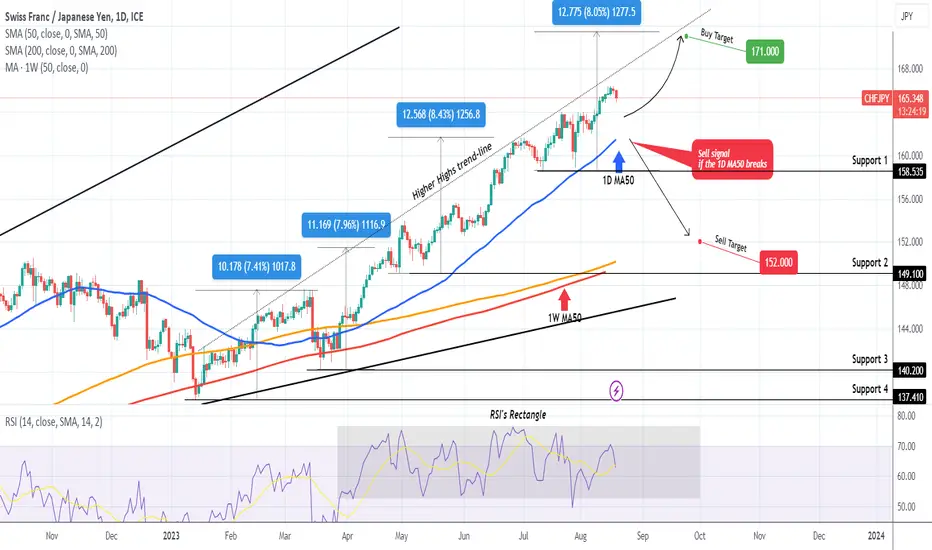
CHFJPY Buy opportunity unless the 1D MA50 breaks.The CHFJPY pair has been on a very strong and steady rise, supported by the 1D MA50 (blue trend-line) since the March 29 break-out. Our last signal was on April 28 (see chart below):
The situation hasn't changed and the trend remains bullish, aiming at a +8.00% extension. Our target is 171.000. If however the pair breaks below the 1D MA50, we will close it and open a sell instead, targeting the 1D MA200 (orange trend-line) at 152.000.
P.S. Notice the Rectangle pattern on the 1D RSI. Since the price broke and remains (to this date) above the 1D MA50, every test of the Rectangle's bottom is a buy opportunity.
-------------------------------------------------------------------------------
** Please LIKE 👍, FOLLOW ✅, SHARE 🙌 and COMMENT ✍ if you enjoy this idea! Also share your ideas and charts in the comments section below! **
-------------------------------------------------------------------------------
💸💸💸💸💸💸
👇 👇 👇 👇 👇 👇
CADCHF: Pullback From Key Level Explained 🇨🇦🇨🇭
CADCHF is testing a key daily structure support.
The price formed a double bottom on that on 1H time frame.
The neckline of the pattern is now broken.
It signifies a local change of character from bearish to bullish
and a highly probable pullback.
Goals: 0.6502 / 0.6707
❤️Please, support my work with like, thank you!❤️

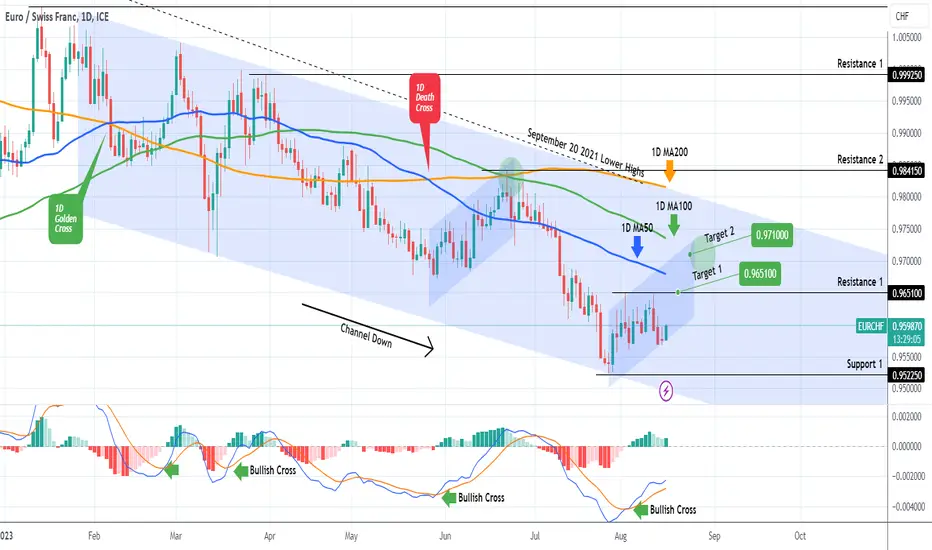
EURCHF Buy opportunity on a MACD Bullish Cross.The EURCHF pair eventually hit our 0.95555 bearish target as set by our sell signal in June (see chart below):
The price is now past a 1D MACD Bullish Cross and on the bullish wave of the 7 month Channel Down. We therefore go long again targeting Resistance 1 at 0.96510 on the short-term and if a 1D candle closes above it, we will extend it towards the 1D MA100 (green trend-line) at 0.97100.
-------------------------------------------------------------------------------
** Please LIKE 👍, FOLLOW ✅, SHARE 🙌 and COMMENT ✍ if you enjoy this idea! Also share your ideas and charts in the comments section below! **
-------------------------------------------------------------------------------
💸💸💸💸💸💸
👇 👇 👇 👇 👇 👇
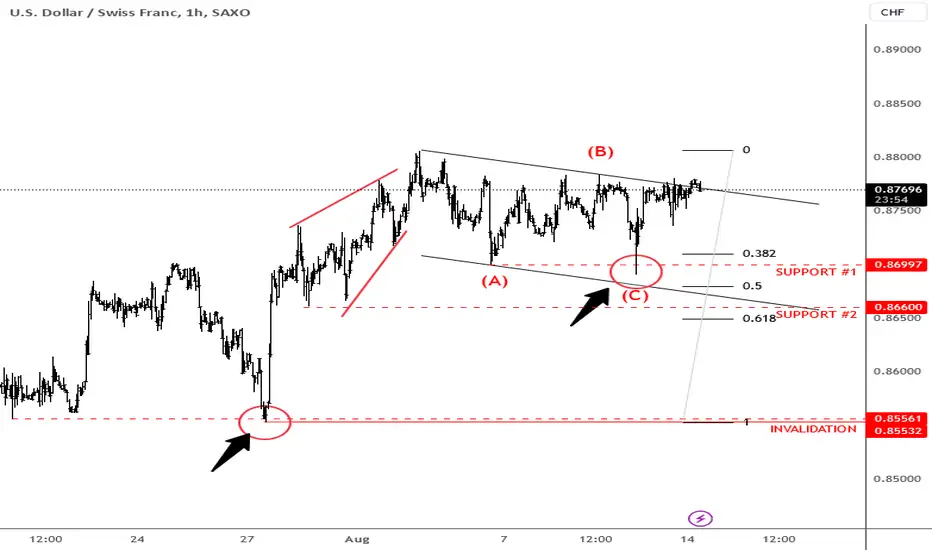
More upside potential for USDCHFWith the dollar moving higher, watch Swissy. The bears got rejected each time after a spike for a few pips, below important swing support. A drop was also in three waves from the recent highs so I think more upside is coming.
GH
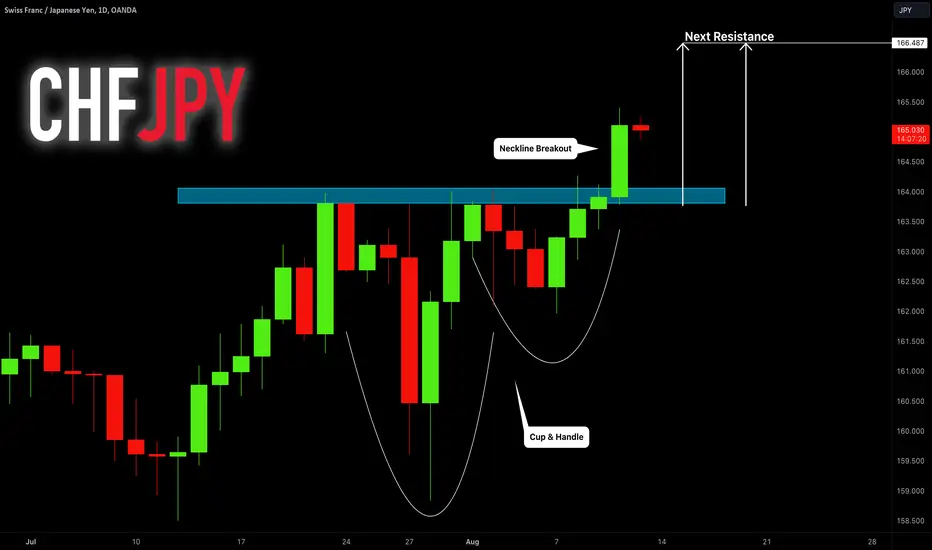
CHFJPY: Bullish Trend Continues 🇨🇭🇯🇵
CHFJPY is trading a long-term bullish trend.
After the price set a new high in July,
it started a correctional movement.
A cup & handle pattern was formed.
CPI report was a trigger for the buyers to violate the neckline of the pattern.
Daily candle closed above that.
It signifies that bullish trend will continue.
The market will most likely keep growing.
Next resistance - 166.5
❤️Please, support my work with like, thank you!❤️
Swiss Franc can fall to support line of upward channelHello traders, I want share with you my opinion about Swiss Franc. Observing the chart, we can see that the price a few moments ago price traded inside a big range, in which it reached the top part of the range, bounced down, and started to decline. Price declined to the 0.8950 - 0.8900 resistance area, but soon rebounded back and some time traded near the 0.8950 resistance level. later swiss Franc broke the resistance level and made a strong downward impulse below the 0.8570 support level, which coincide with the support area. Also then price started to rise inside the upward channel, where it rose higher of 0.8570 support level and at the moment continues to trade there. I think that the Swiss Franc can rise a little and then start to decline to support line of upward channel. For this case, set up my target at the 0.8640 level, which coincides with the support line of the channel. Please share this idea with your friends and click Boost 🚀

USDCHF - Head and Shoulders📉Hi Traders👋🏻
The USDCHF Price Reached A Weekly Resistance Level !
Currently, The Price Formed a Head and Shoulders Pattern📉
The Neckline is Broken🔥
So, I Expect a Bearish Move📉
i'm waiting for a retest...
-----------
TARGET: 0.85700🎯
___________
if you agreed with this IDEA, please leave a LIKE, SUBSCRIBE or COMMENT!

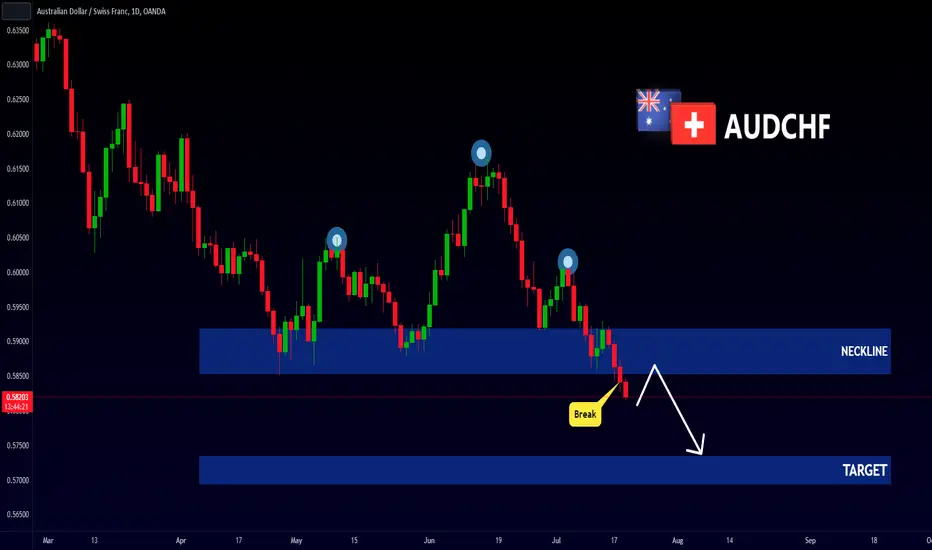
AUDCHF - Head and Shoulders📉Hello Traders!
On The Daily Time Frame, The AUDCHF Price Formed a Head and Shoulders Pattern📉
The Neckline is Broken 🔥
So, I Expect a Bearish Move📉
i'm waiting for a retest...
-----------
TARGET: 0.57360🎯
___________
if you agreed with this IDEA, please leave a LIKE, SUBSCRIBE or COMMENT!
USDCHF Approaching the 1D MA50 for the optimal sell entry.The USDCHF pair made a strong rejection near the top of the Channel Down pattern and hit our 0.88250 sell target as illustrated on our analysis 2 months ago (see chart below):
The price is now rising again, after nearly the -0.5 Fibonacci extension for a Lower Low (same as the May 04 Lower Low). The most optimal sell entry is within the 1D MA50 (blue trend-line) and the 0.618 Fibonacci retracement level. That is located exactly at the top of the Channel Down. We will take that opportunity to sell and target 0.8300 (again near the -0.5 Fibonacci extension).
-------------------------------------------------------------------------------
** Please LIKE 👍, FOLLOW ✅, SHARE 🙌 and COMMENT ✍ if you enjoy this idea! Also share your ideas and charts in the comments section below! **
-------------------------------------------------------------------------------
💸💸💸💸💸💸
👇 👇 👇 👇 👇 👇

GBPCHF: Bullish Outlook Explained 🇬🇧🇨🇭
GBPCHF formed an ascending triangle formation on a daily time frame.
Its neckline was broken on Friday and the market closed above that.
I will expect a bullish continuation on the pair.
Next resistance - 1.1225
❤️Please, support my work with like, thank you!❤️

USDCHF: Up before the downCHF / Swiss Franc is flying, but I think short term interest in the USD will see continued retracement at the start of this week, before a big fall towards the end.
Watching closely for a LTF confirmation and then I'm in with a great RR.

GBP/CHF Long Signal For Next Week Explained
Look at that perfect bullish breakout.
The pair broke a strong resistance.
I suggest buying after the market opening.
Target - 1.2275
Stop - 1.112
Please, support my work with like!
