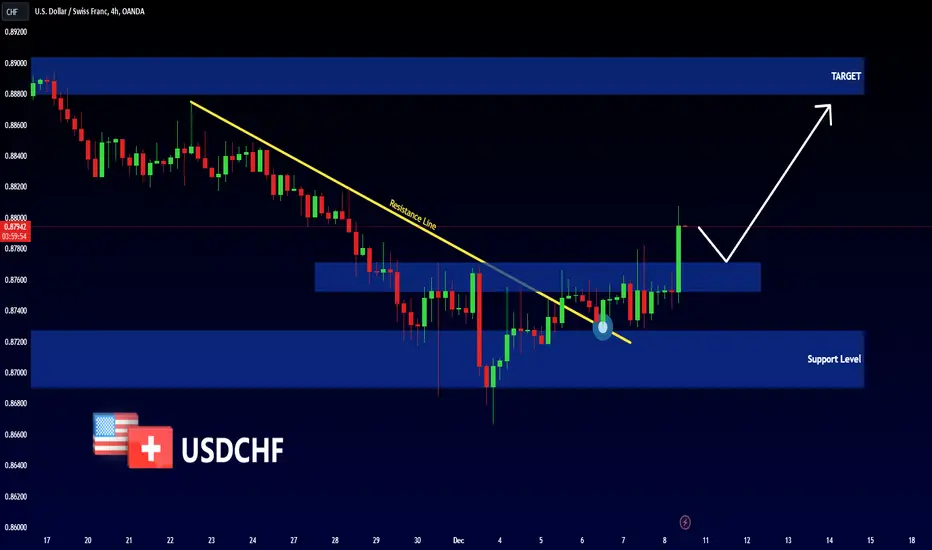
Swiss Franc can leave pennant and continue to grow to 0.8760Hello traders, I want share with you my opinion about Swiss Franc. Looking at the chart, we can see how the price a few days ago rebounded from the seller zone, which coincided with the 0.8760 resistance level and declined until the support level. After this, the price rebounded and started to rise in an upward channel, where it rose to the resistance line, thereby breaking the 0.8760 level, but later it bounced from this line and fell to the support line. A few time later Swiss Franc tried to rise higher than the seller zone, but failed and declined to the support level, which coincided with the buyer zone and even fell lower than this zone. Also, the price exited from the channel and entered to the pennant, in which CHF rebounded from the support line and rose to the resistance line, breaking the 0.8670 level. At the moment price continued to trades near the resistance line and I think that price can fall to the support line and then rebound up higher than the resistance line, thereby exiting from the pennant. After this, the Swiss Franc can continue to move up to the 0.8760 resistance level, so I set my target at this level. Please share this idea with your friends and click Boost 🚀
Swissfranc

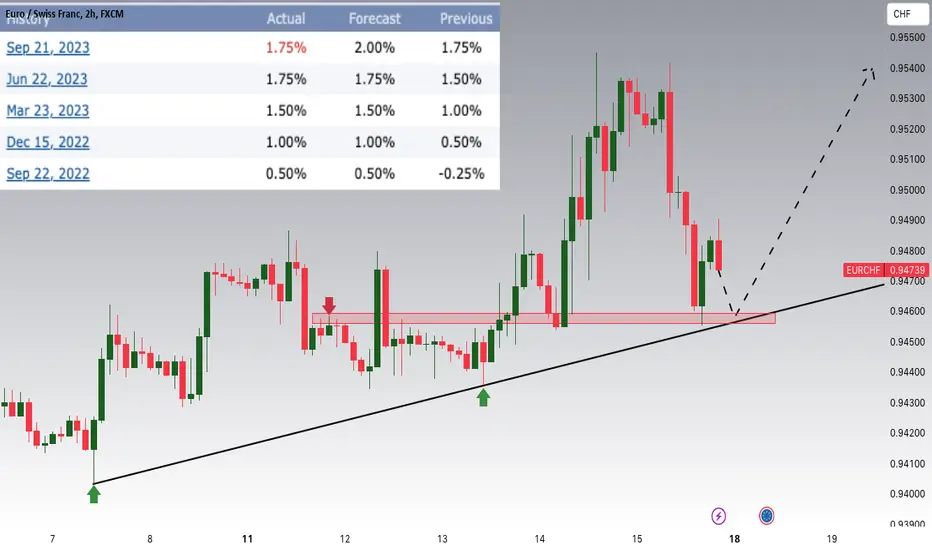
EURCHF Technical Trends and SNB Policy DynamicsLooking ahead to the upcoming week, our strategic focus centers on EURCHF, as we actively evaluate a potential buying opportunity within the 0.94600 zone. The technical analysis reveals that EURCHF has been consistently advancing in an uptrend, showcasing a noteworthy upward trajectory. Currently, the currency pair is in the midst of a correction phase, steadily approaching the critical 0.94600 support and resistance area.
Adding a numerical dimension to our assessment, let's consider the recent policy decisions by the Swiss National Bank (SNB) from December 15, 2022, to the most recent update on September 21, 2023. The SNB initiated a significant shift by setting the interest rate at -0.25% on September 22, 2022, and has since made subsequent adjustments. The recent decision last Thursday, on September 21, 2023, reflects the SNB's choice to maintain interest rates unchanged, citing a backdrop of easing inflation.
This dovish stance by the SNB not only aligns with the technical analysis pointing towards a correction in EURCHF but also sets the stage for a potential continuation of CHF weakness. The confluence of technical indicators, recent policy decisions, and numerical data heightens our interest in monitoring EURCHF for a buying opportunity. As we progress through the upcoming week, our strategic approach is to navigate and capitalize on the evolving market dynamics, leveraging the identified buying potential within the specified numerical zone.
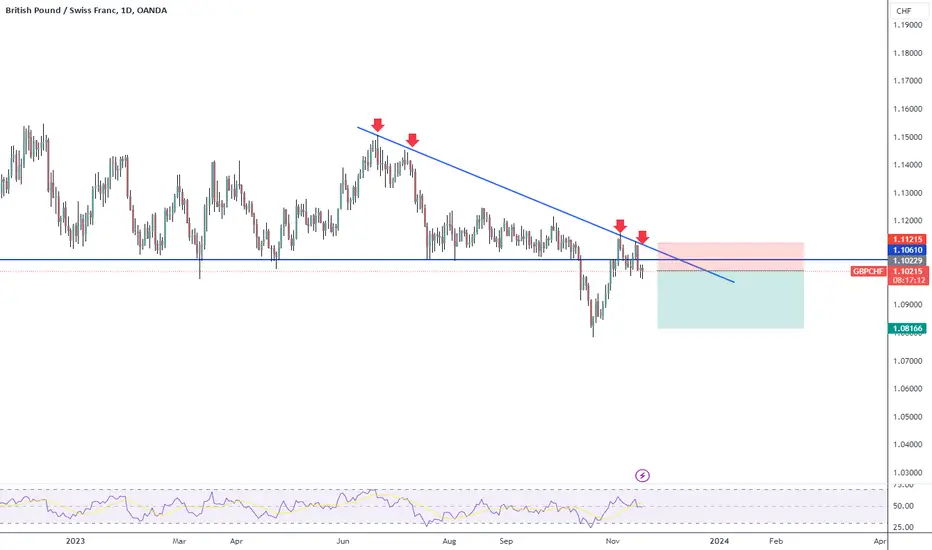
Double top at the resistanceAnother double top, looks like is going down. SL if a daily candle closes above the trendline. The GBP is struggling across the board.
Wants to go upPair is accumulating over and important support (blue line) and forming an inverse HS. I just opened a long position, If it pulls back I'll add. I wants to break out, is just a matter of time.
EURCHF Rebound expected.The EURCHF pair stayed within the long-term Channel Down, got rejected on its top after our November 02 sell call (see chart below) and effectively hit our 0.941850 target:
Despite having more downside to drop it below Support 2, we expect a medium-term rebound as the 1D MACD is very close to posting a Bullish Cross, which within this Channel Down has been a buy signal that always sends the price back to at least the 0.5 Fibonacci retracement level. As a result we have an immediate target at 0.9545.
We can't overlook the potential for a Rectangle pattern emerging, with the price targeting Resistance 1, if it breaks above the 1D MA200 (orange trend-line).
-------------------------------------------------------------------------------
** Please LIKE 👍, FOLLOW ✅, SHARE 🙌 and COMMENT ✍ if you enjoy this idea! Also share your ideas and charts in the comments section below! This is best way to keep it relevant, support us, keep the content here free and allow the idea to reach as many people as possible. **
-------------------------------------------------------------------------------
💸💸💸💸💸💸
👇 👇 👇 👇 👇 👇

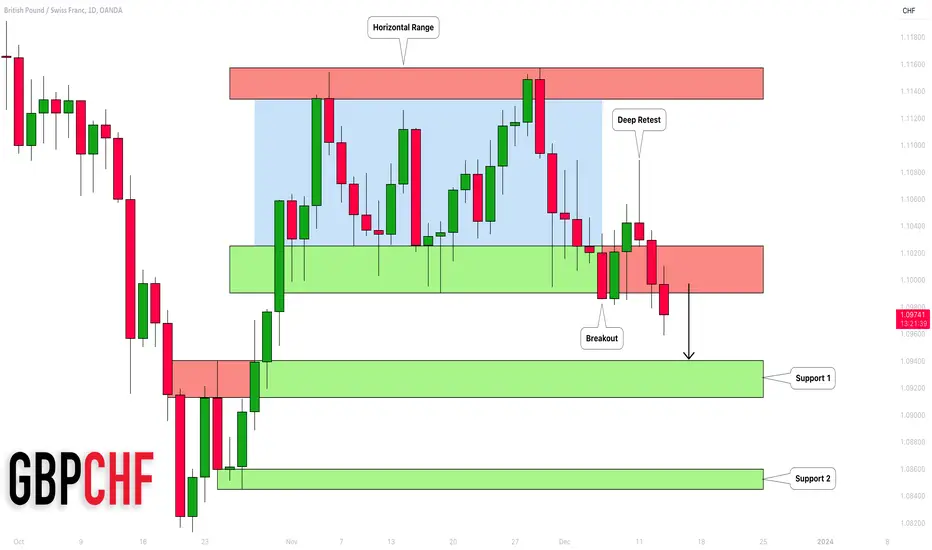
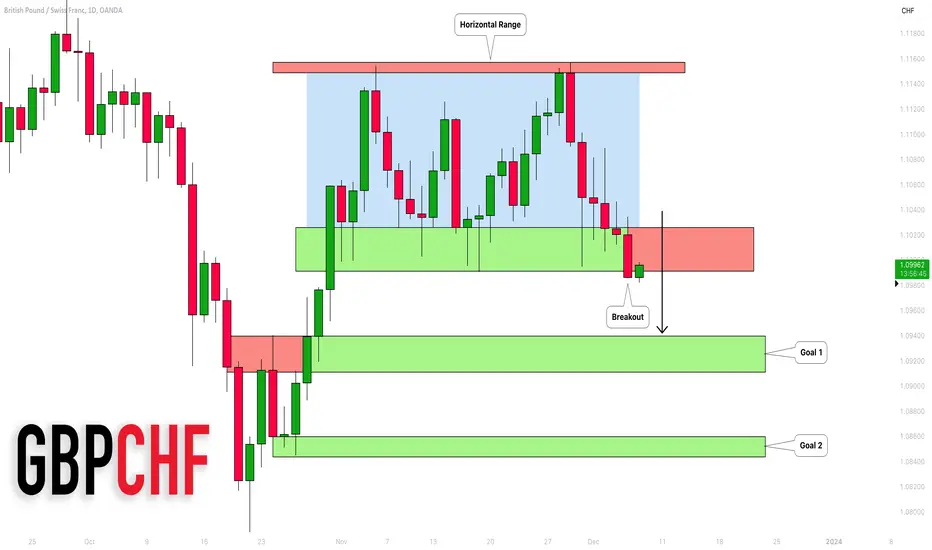
GBPCHF: Bearish Rally Continues 🇬🇧🇨🇭
Update for GBPCHF.
We spotted a confirmed bearish breakout of a support of a horizontal range on a daily.
After a deep retest of a broken structure, we see a strong bearish reaction.
The fall will most likely continue, at least to 1.094
❤️Please, support my work with like, thank you!❤️
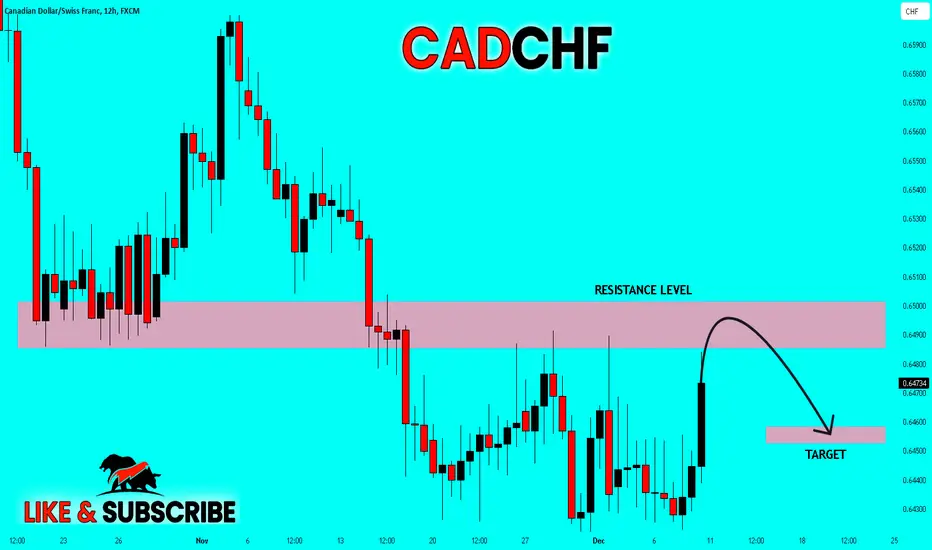
✅CAD_CHF BEARISH BIAS|SHORT🔥
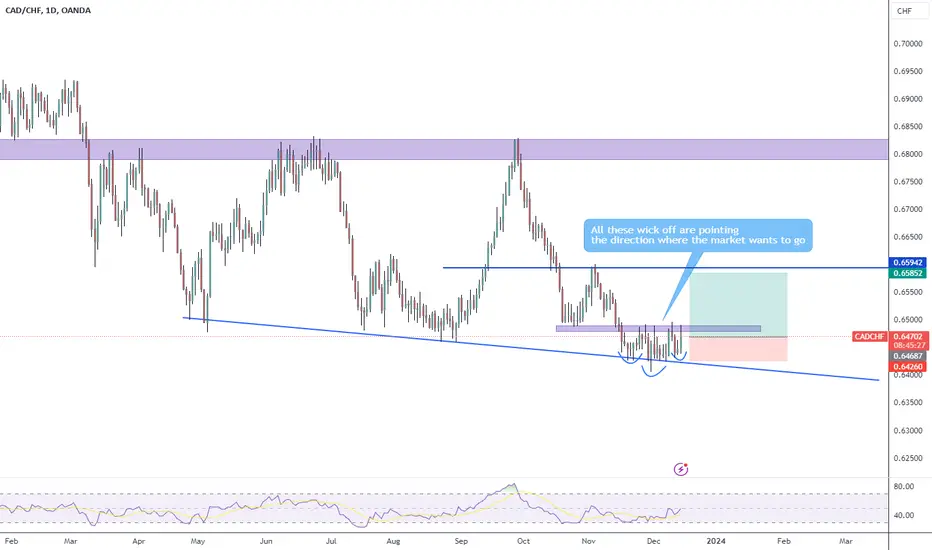
✅CAD_CHF is going up to retest a horizontal resistance of 0.650
Which makes me locally bearish biased
And I think that we will see a pullback
And a move down from the level
Towards the target below at 0.645
SHORT🔥
✅Like and subscribe to never miss a new idea!✅
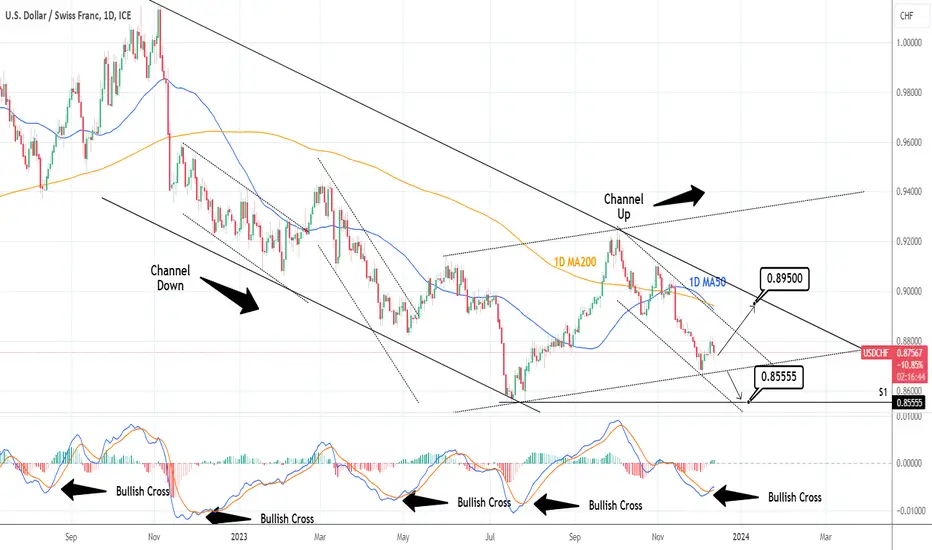
USDCHF: Turned bullish again.USDCHF is technically bearish on the 1D outlook (RSI = 38.319, MACD = -0.005, ADX = 47.617) and the long term pattern remains a Channel Down but the 1D MACD has formed a Bullish Cross. Since August 2022, 3 out of 4 such formations under 0.000 have initiated strong rises. Consequently, at least on the medium term, we regard this formation more dominant than the Channel Down.
We can see a Channel Up emerging but in order for that to be sustainable, the Channel Down's top needs to break. Thus, we are only going to target its top (TP = 0.8950). This trade gets invalidated if the price crosses under the bottom of the Channel Up (short then TP = 0.8555).
See how our prior idea has worked:
## If you like our free content follow our profile to get more daily ideas. ##
## Comments and likes are greatly appreciated. ##
USDCHF is ready to Jump by Rounding Bottom Pattern🚀🏃♂️ USDCHF has been moving in the Descending channel for a long time, but USDCHF started to increase by hitting the 🟡 Price Reversal Zone(PRZ) 🟡and managed to form a Rounding Bottom Pattern .
🔔I expect USDCHF to move at least to the upper line of the descending channel and possibly break the descending channel as well.
U.S.Dollar/Swiss Franc ( USDCHF ) 1-hour time frame⏰.
Do not forget to put Stop loss for your positions (For every position you want to open).
Please follow your strategy; this is just my idea, and I will gladly see your ideas in this post.
Please do not forget the ✅' like '✅ button 🙏😊 & Share it with your friends; thanks, and Trade safe.

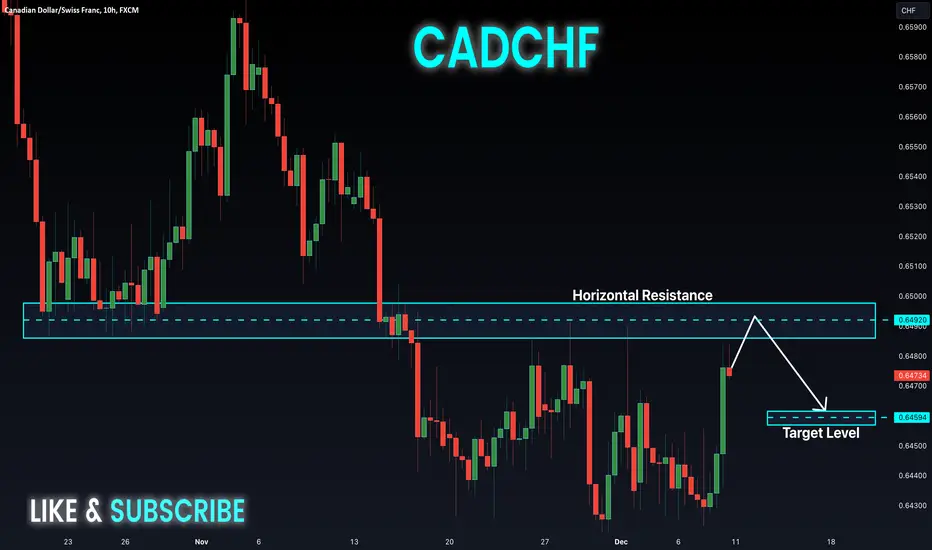
CAD-CHF Strong Resistance Ahead! Sell!
Hello,Traders!
CAD-CHF made nice bullish
Move up but a strong
Horizontal resistance is ahead
At 0.6494 from where I think
We will see a bearish reaction
Sell!
Like, comment and subscribe to help us grow!
Check out other forecasts below too!
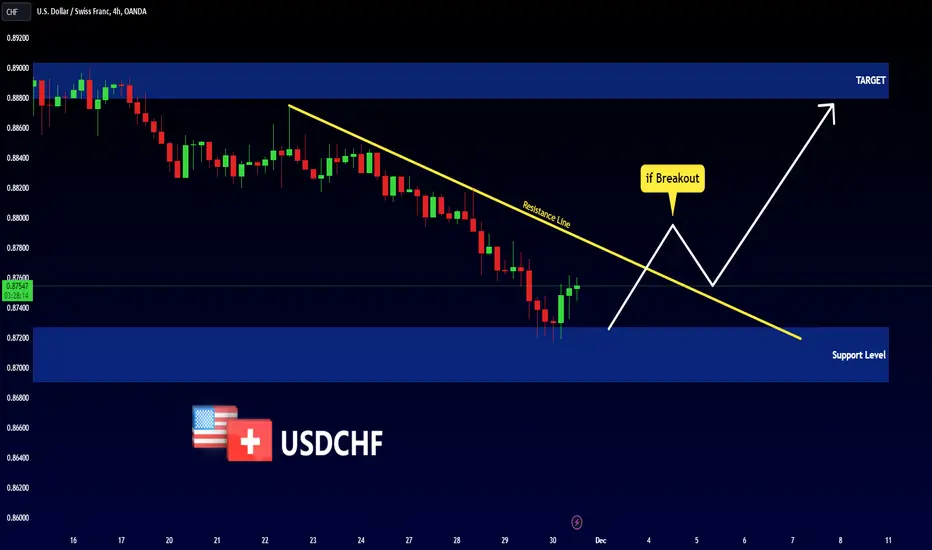
USDCHF - BULLISH SCENARIO 📈Hi Traders !
Yesterday, The USDCHF Price Reached a Support Level (0.87270 - 0.86904)
So We Have a Bullish Scenario:
If The Market Breaks The Resistance Line and Closes Below That
We Will See a Bullish Move...
TARGET: 0.88800🎯
USDCHF - BULLISH MOVE 📈
As We Talked in The Previous Analysis:
The USDCHF Price Reached a Support Level (0.87270 - 0.86904)
Currently:
The Resistance Line is Broken
So, I Expect a Bullish Move.
-----------
TARGET: 0.88800🎯
GBPCHF: Important Breakout 🇬🇧🇨🇭
GBPCHF broke and closed below a support of a wide horizontal range on a daily.
To me, it is an important sign of strength of the sellers.
We may expect a bearish movement at least to 1.094
❤️Please, support my work with like, thank you!❤️
USDCHF Is it experiencing a pattern change?The USDCHF pair has been trading within a Channel Down pattern since the August 11 2022 Low. Such a long-term pattern is difficult to break but according to the 1D MACD and RSI indicators, the pair may be experiencing a pattern change.
As you can see, the 1D MACD is about to form a Bullish Cross, the lowest since July 27, which was soon after the last Lower Low on the Channel Down. Along with the fact that the 1D RSI breached through the 30.00 oversold barrier and rebounded exactly on the same level as the July 13 Low, we have a strong case for a new bottom, which is not consistent with a Channel Down Lower Low.
As a result a new Channel Up (dotted lines) may be emerging and our trading plan involves buying now at the (potential) Higher Low and targeting the top (Lower Highs trend-line) of the long-term Channel Down at 0.91175, which is also Resistance 1.
If on the other hand Support 1 (0.85500) breaks, we will take the loss on the buy and go short instead, targeting the bottom of the Channel Down at 0.81250, which is also the 1.618 Fibonacci extension.
-------------------------------------------------------------------------------
** Please LIKE 👍, FOLLOW ✅, SHARE 🙌 and COMMENT ✍ if you enjoy this idea! Also share your ideas and charts in the comments section below! This is best way to keep it relevant, support us, keep the content here free and allow the idea to reach as many people as possible. **
-------------------------------------------------------------------------------
💸💸💸💸💸💸
👇 👇 👇 👇 👇 👇

AUDCHF: Bearish Outlook & Trading Plan 🇦🇺🇨🇭
AUDCHF is testing a key horizontal supply area.
A bearish breakout of a neckline of a double top pattern on an hourly time frame
gives us a strong bearish confirmation.
We may anticipate a bearish continuation to 0.5733
❤️Please, support my work with like, thank you!❤️

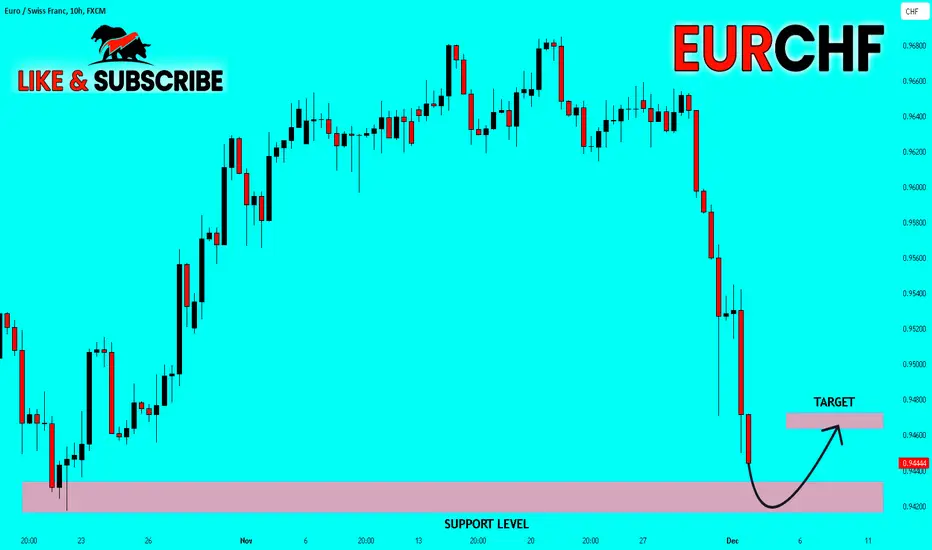
✅EUR_CHF BUYING OPPORTUNITY|LONG🚀
✅EUR_CHF fell again to retest the support of 0.942
But it is a strong key level
So I think that there is a high chance
We will see a bullish rebound and a move up
LONG🚀
✅Like and subscribe to never miss a new idea!✅
USDCHF: Classic Smart Money Pattern?! 🇺🇸🇨🇭
I spotted a classic smc formation on USDCHF.
The price violated a key support. The violation turned out to be a trap
and the market returned above the structure with a strong bullish imbalance.
We may anticipate more growth now.
Goal - 0.873
❤️Please, support my work with like, thank you!❤️

Possible rejectionPair just hit a two years old resistance. I'm opening a small short position and I will add if price action confirms the rejection: a double top or some other bearish pattern on lower timeframes. SL above the next resistance. This could be the beginning of a bearish triangle if the pair breaks down the 0.94 support. But let's see how it goes first.

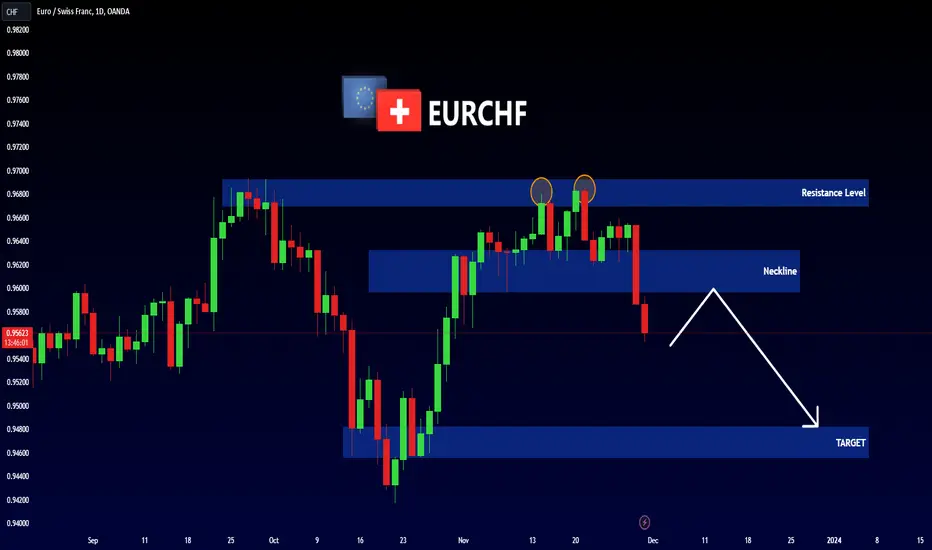
EURCHF - Bearish Double TOP 📉Hello Traders !
On The Daily Time Frame, The EURCHF Reached a Resistance Level.
The Price Formed a Double TOP Pattern.
Currently,
-The Neckline is Broken.
So I Predict a Bearish Move 📉
i'm Waiting for Retest...
-----------
TARGET: 0.94820🎯
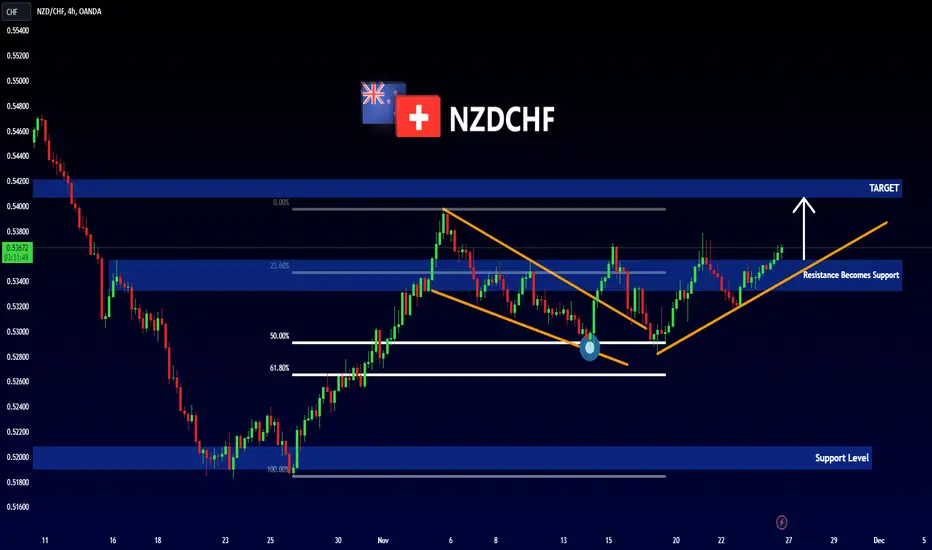
NZDCHF - BULLISH MOVE 📈
Currently,
-The Price Pulled Back to 0.5 Fibonacci Retracement Level !
-and Formed a Bullish Falling Wedge
-and Now it Will Continue its Bullish Movement !
-----------
TARGET: 0.54075🎯
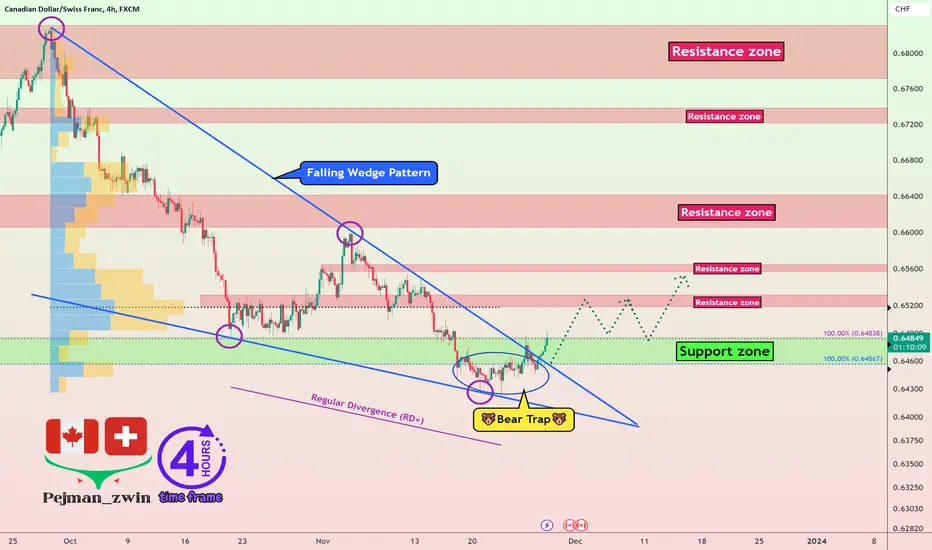
✈️CADCHF can go UP by Falling Wedge Pattern✈️🔄 CADCHF re-entered the 🟢 Support zone(0.648CHF-0.645CHF) 🟢 after experiencing a 🐻 Bear Trap 🐻.
💡Also, CADCHF seems to have succeeded in forming a Falling Wedge Pattern , so the upper line of this pattern was broken hours ago.
💡Also, we can see Regular Divergence(RD+) between two Consecutive Valleys .
🔔I expect CADCHF to GO UP in the coming days and may rise to 🔴 Resistance zones 🔴.
Canadian Dollar/Swiss Franc Analyze ( CADCHF) 4-hour time frame ⏰.
Do not forget to put Stop loss for your positions (For every position you want to open).
Please follow your strategy; this is just my idea, and I will be glad to see your ideas in this post.
Please do not forget the ✅' like '✅ button 🙏😊 & Share it with your friends; thanks, and Trade safe.
USDCHF - Descending Triangle 📉Hi Traders !
The USDCHF Price Failed To Create a New Higher High !
The Price Formed a Descending Triangle Pattern.
The Support Level is Broken
So, I Expect a Bearish Move📉
i'm waiting for retest...
-----------
TARGET: 0.87870🎯

EURCHF: Is That a Bullish Confirmation?! 🇪🇺🇨🇭
In comparison to USDCHF, EURCHF looks bullish to me.
The price is trading within a wide horizontal range on a 4H.
Testing its support, the pair formed a tiny cup & handle pattern
and violated its neckline.
I believe that the market will go to the resistance of the range - 0.9678
❤️Please, support my work with like, thank you!❤️
