ETHEREUM → False breakdown of MA-200 could lead to a BULLRUN ↑ BINANCE:ETHUSD in the correction phase, testing zones of interest (0.5 fibo and MA-200), forming a false breakdown, which in general can lead to a strong upward movement supported by strong fundamentals.
Fundamentally, ETH is quite positive. ETH-ETFs were launched on July 23 and continue to gain momentum. The correction, which has been observed for the last two days is mainly due to the outflow from GrayScale (exactly the same scenario was with BTC), also a slight pressure is created by the situation with Mt.Gox, but against the background of BTC transfers to exchanges and their distribution among its debtors, bitcoin is strengthening, such behavior of the flagship indicates support for eth.
Technically, the price is forming a correction to 0.5 fibo relative to the bullish momentum as well as a retest of the Daily MA-200, forming a false breakdown with a fairly aggressive buyback, indicating the presence of a strong buyer who is not ready to go down beyond $3000.
Resistance levels: 3357, 3540
Support levels: 3200, MA-200
The main task of the bulls is to keep the defense above the zone of interest at $3200. Further it remains to wait for resistance retest with the purpose of its breakthrough and further bull run to $4000 - $4500 - $4900.
Rate, share your opinion and questions, let's discuss what's going on with ★ BINANCE:ETHUSD
Regards R. Linda!
Symmetrical Triangle

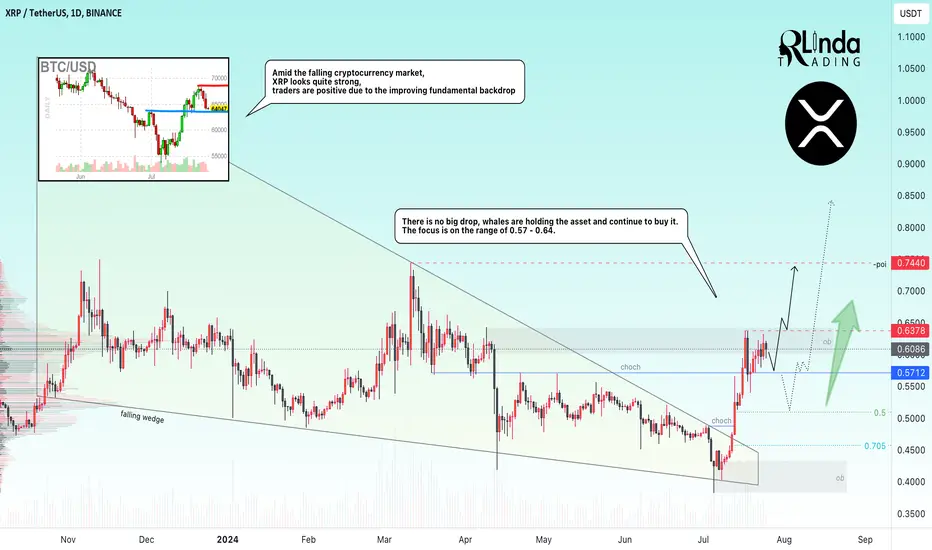
XRP → The moment before “to the moon” ↑BINANCE:XRPUSDT is the strongest of the market. As ETH & BTC fall, ripple is holding quite positively as traders are starting to believe in growth amid rumors...
Ripple CEO recently said that he expects a legal resolution to the situation between the SEC and Ripple “very soon”
Many are speculating that the SEC's closed-door meeting to finalize the case against Ripple could take place today - July 25.
Against this backdrop: Trading volumes are rising, price is hitting local highs, whales are accumulating XRP
Technically, it is worth paying attention to the 0.6378 - 0.5712 range. If breaking the resistance fails, the price may test liquidity below the support before subsequent growth.
Resistance levels: 0.6378, 0.7440
Support levels: 0.5712, 0.5100
If the trial finds its denouement, it will give a second life to the coin. A break of the range resistance - 0.6378 will open a new path....
Rate, share your opinion and questions, let's discuss what's going on with ★ BINANCE:XRPUSDT ;)
Regards R. Linda!
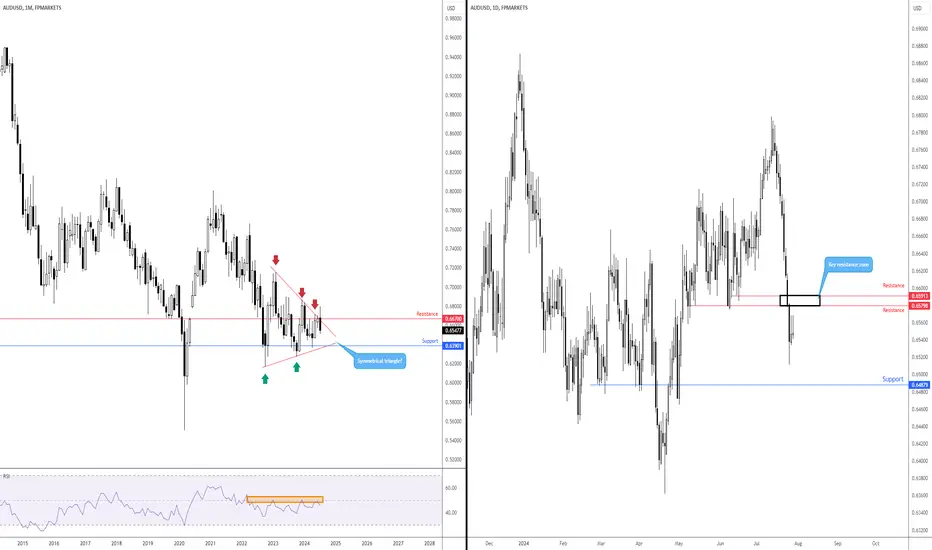
Resistance on AUD/USD Ahead of CPI InflationThe AUD/USD currency pair (Australian dollar versus the US dollar) is on track to snap a two-month winning streak. It is down nearly -2.0% month to date, largely driven by risk sentiment.
Monthly and Daily Resistance Levels
Technically, the AUD/USD faded monthly resistance at $0.6670, which combines with the upper boundary of a symmetrical triangle, or ‘coil’, taken from $0.7158 and $0.6170. Adding ‘technical’ weight to said resistances is the Relative Strength Index (RSI) remaining south of the 50.00 centreline since April 2022, indicating negative momentum.
On the daily timeframe, last week’s precipitous decline breached several key support levels, including $0.6580 and $0.6591, leaving both levels open for a retest this week. Another notable observation is the scope to continue exploring deeper water until reaching support from $0.6488 (you will note that this area also represents Quasimodo support).
Price Direction
Overall, the trend direction is relatively difficult to define at the moment. Therefore, recent downside sentiment, coupled with daily resistance, could be something sellers show interest in if tested, targeting daily support at $0.6488.
As a note, do remain aware that we have Aussie Consumer Price Index (CPI) inflation out on Wednesday. These numbers have proven rather sticky in 2024, leading the Reserve Bank of Australia to strike a hawkish tone in recent meetings – a 20% chance of a hike is currently priced in for the August meeting.
Should inflation come in hotter than expected this week, this could see rate-hike expectations increase and would place current daily resistance in a tricky spot. On the flip side, current resistance could be worthy of attention should a downside surprise in data materialise.
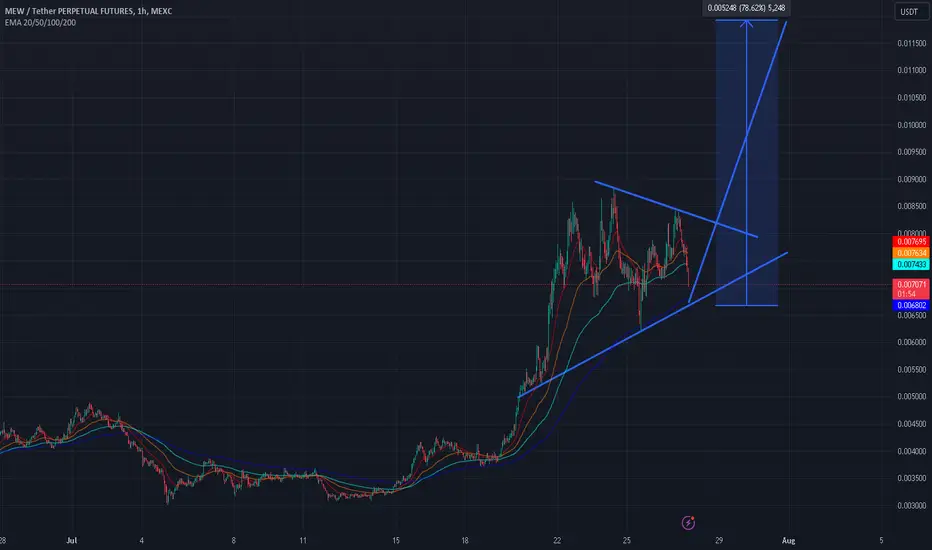
MEW forming an Symmetrical Triangle PatternMEW making her ready for the last wave to go down of symmetrical triangle. If it hits support then I expect MEW to go up and then wait for a breaktrough of the Resistance area.
If we have a succesfull breakout MEW can go up atleast 70%.
What are your thoughts?
Always DYOR this is no financial advice.
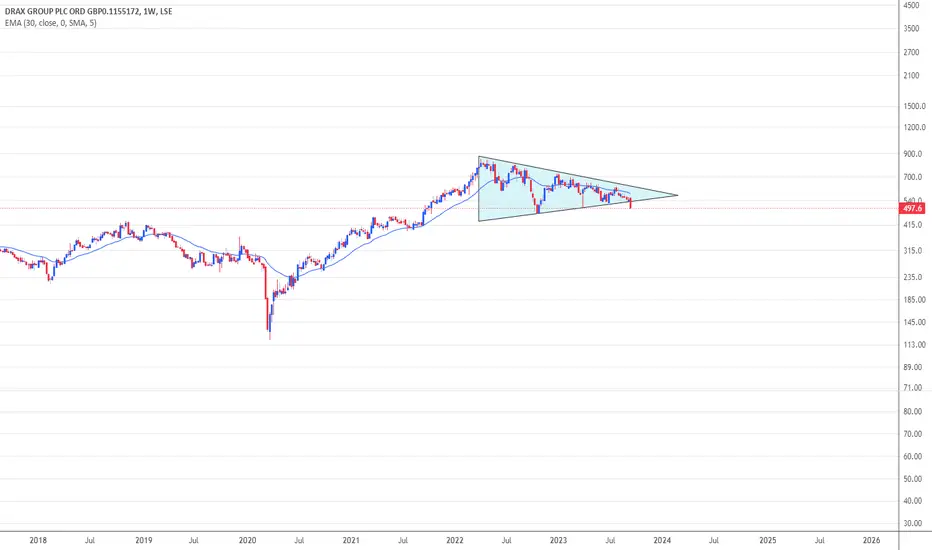
Drax - Bearish DRAX broken out of a bullish triangle this week. Bearish in my book. Expect retest at around 548.
PS: This could also be a false breakout.
This is not a recommendation to trade. Do your own research and make your own decisions.
GOLD → False break of bullish range support ↑FX:XAUUSD is forming a false breakdown of the previously mentioned range - 2390 - 2400. The return to the buying zone is forming, buyers can push the price to 2450
A reversal swing pattern is forming in relation to the support, which is evidence of buyers' strength. The fundamental background is still unstable, there are many nuances from the Fed and the US presidential race, the geopolitical background in the Middle East and Eastern Europe is relatively stable. Today there is no news and in general we can bet on the work of technical analysis.
Technically, if the bulls hold the defense above 2400-2405, then in the medium term we should expect an upward movement towards local liquidity zones as well as towards the upper boundary of the range.
Resistance levels: 2405, 2412, 2420
Support levels: 2400, 2392
The market confirms the presence of the range, it is not excluded that the price may go down, but at the moment the situation looks like the bulls are actively defending the lower boundary of the range, which determines the short-term and medium-term prospects....
Rate, share your opinion and questions, let's discuss what's going on with ★ GOLD ;)
Regards R. Linda!

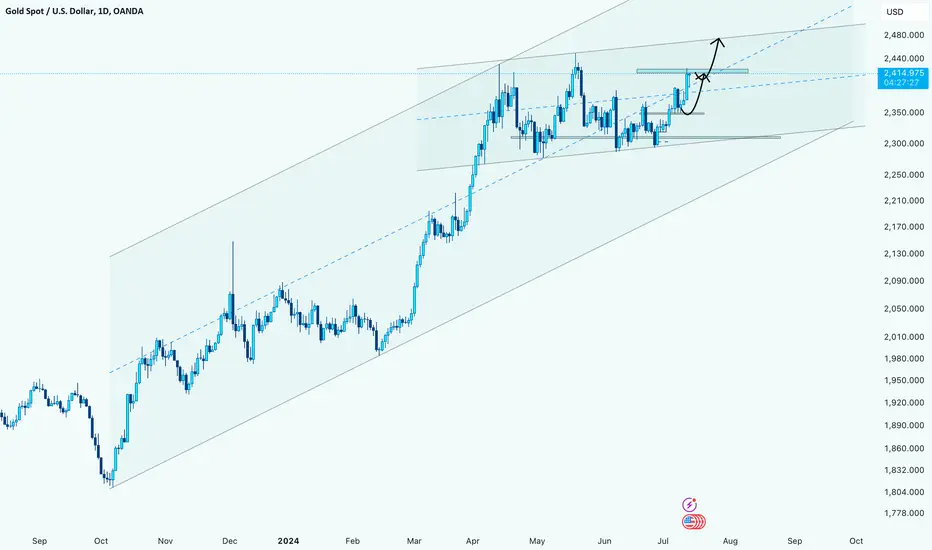
xauusd → the next move!hello guys.
as I published before:
the triangle broke and its target touched!
as you can see, there are two ascending channels there, and it seems you want to touch the next top line around $2480!
let's see what will happen!
___________________________
✓✓✓ Always do your research.
❒❒❒ If you have any questions, you can write them in the comments below, and I will answer them.
❤︎ ❤︎ ❤︎And please don't forget to support this idea with your likes and comment
SWING IDEA - HBL POWER SYSTEMSHBL Power Systems , a leading battery and power systems manufacturer, is exhibiting technical signals that suggest a promising swing trading opportunity.
Reasons are listed below :
Break of Symmetrical Triangle Pattern : The price has broken out of a symmetrical triangle pattern, indicating a potential bullish trend continuation.
Bullish Engulfing Candle on Weekly Timeframe : The recent formation of a bullish engulfing candle on the weekly chart suggests strong buying pressure and the potential for further upward movement.
Closed Above 560 Resistance : The stock has closed above the 560 level, which was a crucial resistance zone, indicating strong bullish momentum.
Higher Highs : The stock is consistently making higher highs, reinforcing the strength of the upward trend.
Trading Above 50 and 200 EMA on Weekly Timeframe : The stock is trading above both the 50-week and 200-week exponential moving averages (EMA), reinforcing the bullish sentiment and providing strong support levels.
Trading at All-Time High : The stock is trading at its all-time high, suggesting strong market confidence and potential for further gains.
Target - 655 // 755
Stoploss - weekly close below 495
DISCLAIMER -
Decisions to buy, sell, hold or trade in securities, commodities and other investments involve risk and are best made based on the advice of qualified financial professionals. Any trading in securities or other investments involves a risk of substantial losses. The practice of "Day Trading" involves particularly high risks and can cause you to lose substantial sums of money. Before undertaking any trading program, you should consult a qualified financial professional. Please consider carefully whether such trading is suitable for you in light of your financial condition and ability to bear financial risks. Under no circumstances shall we be liable for any loss or damage you or anyone else incurs as a result of any trading or investment activity that you or anyone else engages in based on any information or material you receive through TradingView or our services.
@visionary.growth.insights

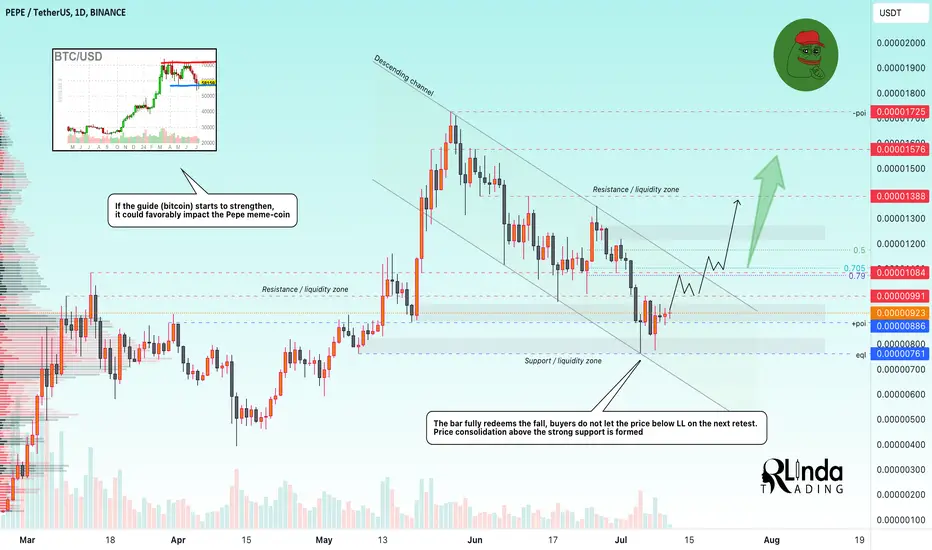
PEPE → A condition that will lead to growth. Is the buyer back?BINANCE:PEPEUSDT is undergoing a deep correction phase. The price is resting on the strong support and the "discount" zone appears the buyer, holding the market. The focus on the upper boundary of the range...
! For convenience, I will indicate key zones without zeros.
Bulls do not let the price below 0.0761, forming a limit support area, in the neighborhood of which a strong buyer appears, it can be determined by the growth of volumes and the pattern of redemption with the subsequent retest without updating the minimum.
At the moment it is not excluded that the coin can continue falling, but based on the general situation there is a chance that PEPE can move into the recovery phase, but provided that the coin can pass the area of 0.0951-0.0991 with the price fixing above this zone, which will generally define an intermediate bottom for the market.
Resistance levels: 0.0952, 0.0991, 0.1084
Support levels: 0.0886, 0.0761
Technically, the situation is complicated because of bitcoin, which is consolidating in the discount zone, but in general there are bullish prerequisites. If the guide (BTC) goes up, it may favor altcoins.
Rate, share your opinion and questions, let's discuss what's going on with PEPE / USDT ;)
Regards R. Linda!
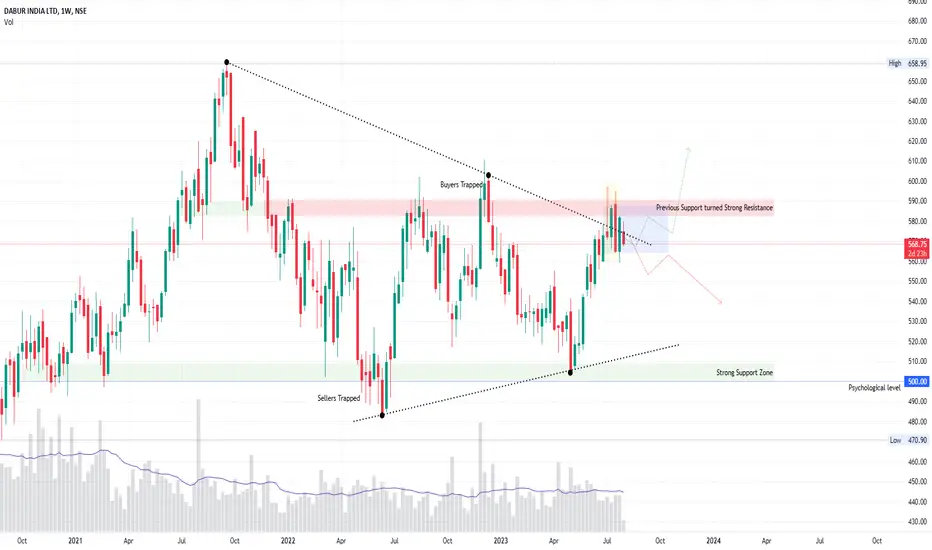
Dabur: Resistance Zone !Hey There,
- Like always, The chart is self-explanatory.
- We saw a triangle breakout which happened very close to a crucial resistance zone that acted like one.
- This is one previous support that turned crucial resistance
- Previously, the price has fallen 3 times after testing this level. The fourth time's a charm?
- We see a good consolidation at the resistance zone since the breakout
- NSE:MARICO sustained similar consolidation to fly high whereas NSE:HINDUNILVR failed to break it.
- What will DABUR do?
Have Insights or Questions? Let us know in the comments below.👇
While you do that, how about a boost for some motivation🚀
⚠️Disclaimer: We are not registered advisors. The views expressed here are merely personal opinions. Irrespective of the language used, Nothing mentioned here should be considered as advice or recommendation. Please consult with your financial advisors before making any investment decisions. Like everybody else, we too can be wrong at times ✌🏻
TATA STEEL: SYMMETRIC TRIANGLE- The chart is pretty self-explanatory
- The price tests a 2 year old resistance trendline
- The formation is one beautiful symmetric triangle that can have either outcome
- The consolidation has been solid so far. This means The momentum may be really good.
- The PE ratio is stagnant with the price
- Do check out our take on JSW Steel in the suggested ideas below.
What is your take on it? Feel free to comment. If it helped, Do Leave us a boost 🚀
Disclaimer: We are not registered advisors. The views expressed here are solely personal opinions. Irrespective of the language used, Nothing mentioned here should be considered as advice or recommendation. Please consult with your financial advisors before making any investment decisions. We like everybody else, have the right to be wrong :)

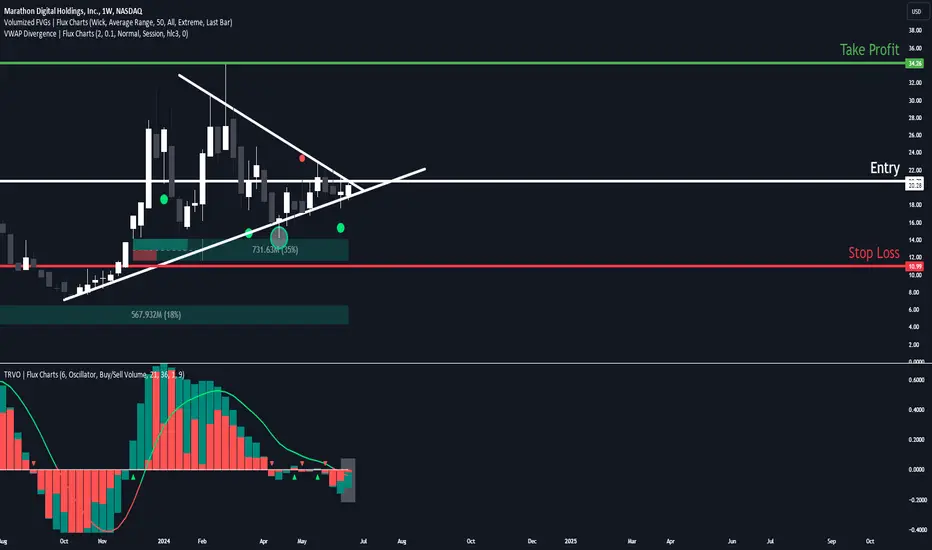
LONGING $MARAWhy I am bullish on NASDAQ:MARA
- About to break out of a symmetrical triangle pattern
- Recent bullish VWAP Divergence
- A lot more buying pressure vs selling on Time Relative Volume Oscillator
- Recently bounced off of a weekly Fair Value Gap
My personal trade:
Stop Loss / Take Profits:
- Entry: $20.72
- Take Profit: $34.26
- Stop Loss: $10.99
XRP hits target of green symmetrical triangle breakout.Target hit!nHopefully now that this target has been hit xrp will still hold support on all the MAs it rose above to hit this target including the weekly 20ma not shown here since this is the 1 day time frame. Nice to see price action send a wick above the top yellow trendline. Once it starts to close a few consecutive daily candles above the top yellow trendline and perhaps 1 to 2 consecutive weekly candles above it then it should really be go time. May take a second to flip it to support though after such a big pump. *not financial advice*

XRP hits target of green symmetrical triangle breakout.Target hit!nHopefully now that this target has been hit xrp will still hold support on all the MAs it rose above to hit this target including the weekly 20ma not shown here since this is the 1 day time frame. Nice to see price action send a wick above the top yellow trendline. Once it starts to close a few consecutive daily candles above the top yellow trendline and perhaps 1 to 2 consecutive weekly candles above it then it should really be go time. May take a second to flip it to support though after such a big pump. *not financial advice*

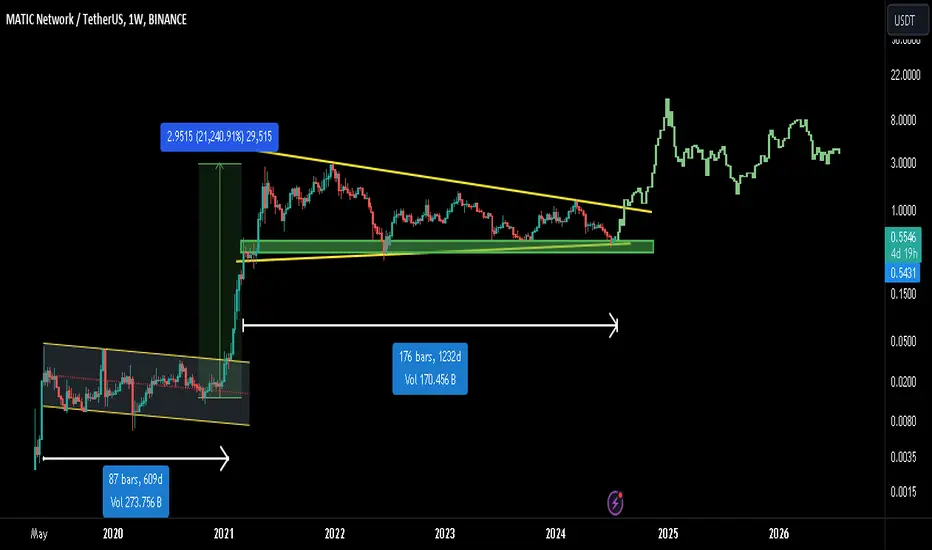
MATIC: GENRATIONAL BOTTOM IS IN!!Hey everyone!
If you're enjoying this analysis, a thumbs up and follow would be greatly appreciated!
Welcome to this MATIC/USDT UPDATE MATIC looks amazing in the weekly time frame.
Last time when MATIC accumulated in a 610-day channel it led to 20,000 Returns.
Now, it is forming a symmetrical triangle kind of structure and accumulated in the triangle for more than 1200 days. Right now, it is sitting at the lower trendline of the triangle and also holding good support here. Buy some now and add more in the dip.
Must Hit Targets:- $2.84/$4.72/$7.16/$9.88
Overall it's a double-digit potential, so leave some % for a moon bag🚀
What are your thoughts on MATIC's current price action? Do you see a bullish pattern? Share your analysis in the comments below!
Bitcoin Roadmap==>>1-hour time frameThese past few days, the cryptocurrency market has been affected by news about the Mt.Gox exchange and the German government's manipulations .
Bitcoin has managed to break the Heavy Support zone($61,100_$58,700) and 200_SMA(Daily) and is currently completing a pullback .
In terms of Classical Technical Analysis , it seems that Bitcoin has succeeded in forming a Symmetrical Triangle Pattern ( A symmetrical triangle is usually a continuation pattern ).
Regarding Elliott's wave theory , Bitcoin seems to have finished the Double Three Correction(WXY) .
I expect Bitcoin to fall at least to the Lower line of the Symmetrical Triangle Pattern and Cumulative Long Liquidation Leverage .
Note: An important point you should always remember is capital management and lack of greed.
Bitcoin Analyze (BTCUSDT), 1-hour time frame ⏰.
Do not forget to put Stop loss for your positions (For every position you want to open).
Please follow your strategy; this is just my Idea, and I will gladly see your ideas in this post.
Please do not forget the ✅' like '✅ button 🙏😊 & Share it with your friends; thanks, and Trade safe.

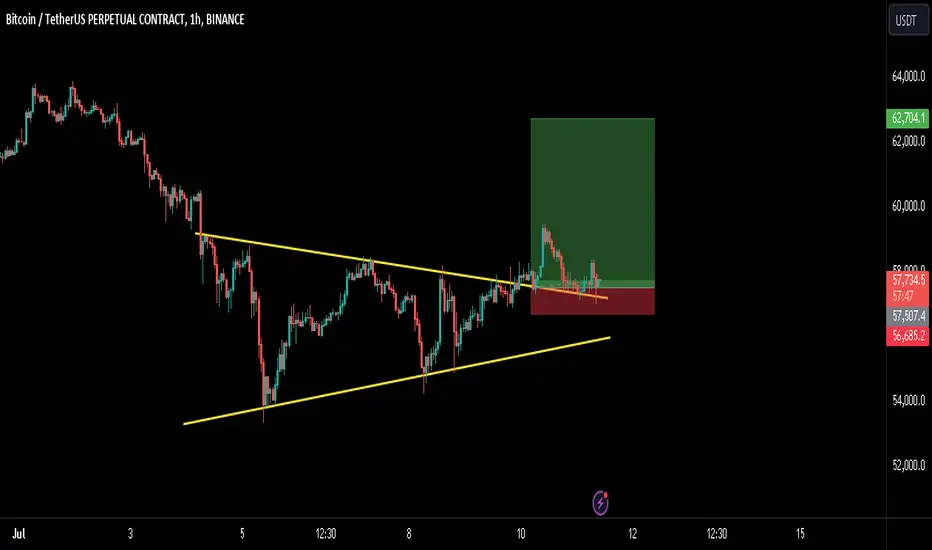
BTC: RETESTING AFTER THE BREAKOUT!!Hey everyone!
If you're enjoying this analysis, a thumbs up and follow would be greatly appreciated!
Welcome to this quick BTC update.
Bitcoin (BTC) is currently testing the support level of the symmetrical triangle it recently attempted to break out of.
Here's what we're watching:
Retest of Triangle: If BTC holds the support level of the triangle, it could indicate another attempt at a breakout.
$60k Resistance: A clean break and close above the GETTEX:59K -$60k resistance level would be a bullish signal, potentially leading to a price increase towards $62k.
Impact of CPI Data (Today):
The release of the Consumer Price Index (CPI) data today could influence market sentiment and potentially impact BTC's price.
Possible Scenarios:
A higher-than-expected CPI reading could indicate rising inflation and lead to a risk-off sentiment, potentially causing BTC's price to drop.
A lower-than-expected CPI reading could be seen as positive news, potentially boosting risk appetite and leading to a rise in BTC's price.
Looking Ahead:
The outcome of the retest and the CPI data release might favor bulls, and we might see a good pump up to the $62k level.
What are your thoughts on BTC's current price action? What are you watching from the CPI data? Share your analysis in the comments below!
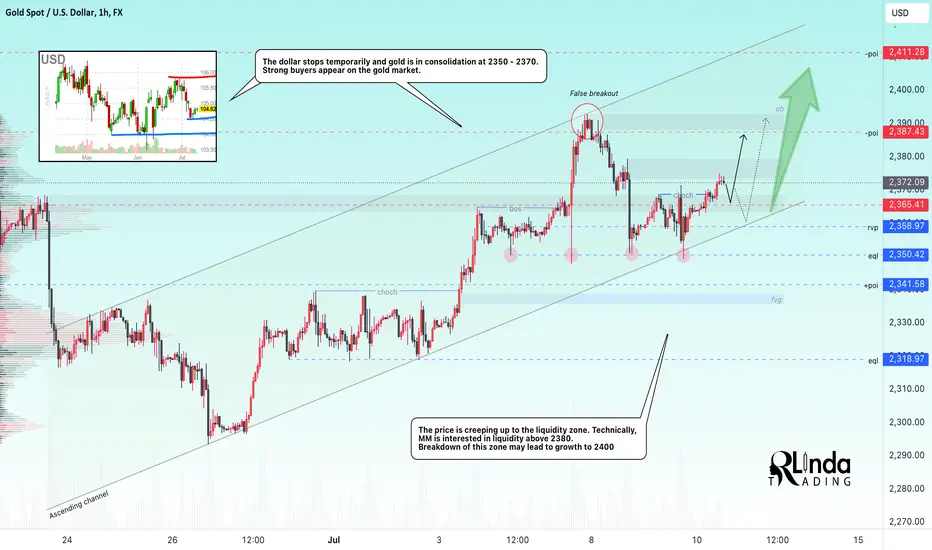
GOLD → An intermediate bottom of 2350 is forming. What's next?FX:XAUUSD is testing 2350, gathering liquidity below this zone. Bulls are actively holding the defense above the key area and the overall picture looks promising.... BUT!
Powell's speech continues today ahead of CPI and PPI. Things are heating up, the slightest hint of an unpredictable outcome could shake the market.
For now, there are some positive signs after Powell's words:
- Keeping rates high for too long could jeopardize growth in the U.S. economy
- A rate hike is unlikely to be the next step
- The Fed has made significant progress in bringing inflation down to the 2% target, recent monthly numbers show modest further progress
- Fed needs more favorable inflation data to cut rates
Overall, traders are not getting enough of this, the market is in consolidation and no one is in a hurry to take premature action yet. We are waiting for today's comments of the Fed chief.
Technically, gold is showing bullish dynamics after the bulls did not let the price go beyond 2350. The price is consolidating above the key level of 2365 and testing the area of interest and liquidity of 2375-2380. A breakout and consolidation of the price above this area may further strengthen the price, as the promising target, at the moment, is 2387 - 23400.
Resistance levels: 2373, 2380
Support levels: 2365, 2355, 2350
A bounce to the downside before further growth is possible, but price consolidation above the key zones could form an interim bottom for the bulls. All emphasis on Powell's comments.....
Rate, share your opinion and questions, let's discuss what's going on with gold ;)
Regards R. Linda!
EUR/USD: Awaiting a Breakout from the Symmetrical Triangle📅 Let's dive into today's analysis. We'll be focusing on the EUR/USD pair in the daily time frame.
🧲 Symmetrical Triangle Formation
In the daily time frame for EUR/USD, we can observe a symmetrical triangle pattern. Currently, the price is in the last third of this triangle, indicating that the best course of action is to hold off on trading this pair until one of the dynamic lines is broken.
🎲 Moving Averages
The moving averages are not particularly useful for analysis right now. As you can see, the SMA99 has flattened out, indicating a lack of momentum in the market.
🪤 Momentum Oscillators
Given the lack of momentum, there's no reason to use momentum oscillators like the RSI. These oscillators are only useful in markets with momentum, so checking the RSI would just provide unnecessary data.
🧩 Breakout Scenarios
If the descending trendline is broken and the price stabilizes above this area, we can expect the price to move up to the 1.11056 resistance level. The trigger for this scenario to be activated is at 1.09066.
⚡️ If the 1.09066 trigger is not activated, we need to wait for a new structure to form and draw new triggers on the chart accordingly.
If the ascending trendline is broken, the trigger for this scenario is 1.06774. The next support level is very close to the price, at 1.06057, which aligns with the 0.382 Fibonacci level in the weekly time frame, forming a crucial area.
📉 Downside Targets
If the price declines, the final target I see is 1.04225, which corresponds to the 0.5 Fibonacci level on the weekly chart. However, there is also a significant support zone between 1.04225 and 1.05007, where substantial demand is likely to enter the market, making it difficult to break through easily.
⌛️ Apex Point of the Triangle
The converging lines of the triangle always intersect at a point called the apex. From a timing perspective, this is an interesting point. Although it's not always exact, we can expect a potential structural change around November 29. This change could be a continuation of the trend, a reversal, or the end of the current trend. Typically, something significant happens around this time.
🎈 Range-Bound Market Scenario
If the price ignores the trendlines and starts ranging, the triggers at 1.09066 and 1.06774 can still be relevant. However, a ranging market will likely create a new structure and provide new triggers accordingly.
📝 Conclusion
The EUR/USD pair is currently trading within a symmetrical triangle, indicating indecision and low momentum in the market. The moving averages and momentum oscillators provide little insight due to the flat market. Traders should wait for a breakout from this triangle to confirm the next direction of price movement. Whether the breakout is to the upside or downside, it will set the stage for subsequent trading opportunities. Patience is key until clear signals emerge from this consolidation pattern.
🧠💼 Always remember that trading futures involves inherent risks, and improper risk management can lead to margin calls. Stick to your capital management principles and use stop-loss orders, aiming for an initial risk-to-reward ratio of 2.
🫶 If you found this analysis helpful and want to support me, please like and share this analysis. Feel free to leave your comments or suggest a coin you'd like me to analyze next.

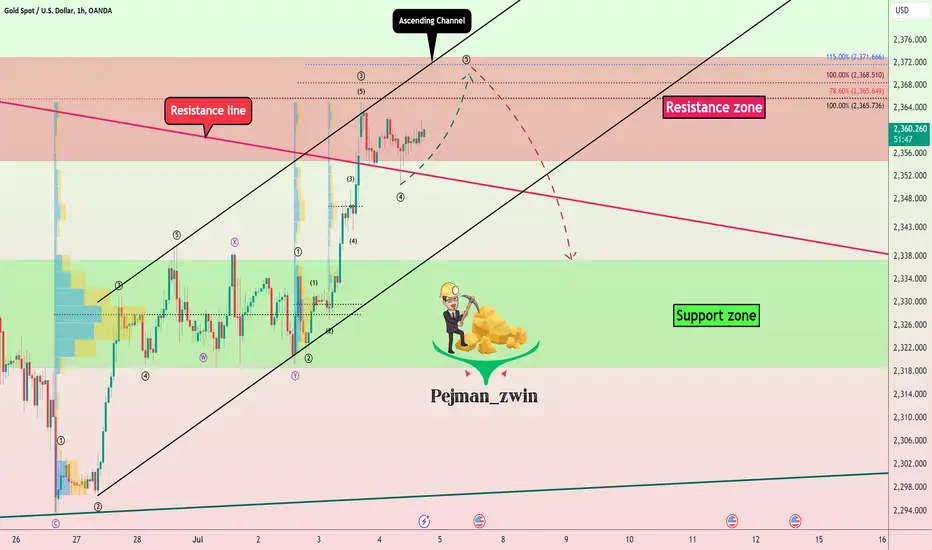
Gold Analysis==>Falling ScenarioGold is moving in the Resistance zone($2,373-$2,354) and Ascending channel .
According to the theory of Elliott waves , it seems that Gold has succeeded in completing the Zigzag correction(ABC/5-3-5) .
I expect Gold to attack the Support zone($2,338-$2,318) in the coming hours after breaking the lower line of the ascending channel .
Note: If Gold can break the Resistance zone($2,373-$2,354), scenario will be changed.
Gold Analyze ( XAUUSD ), 1-hour time frame ⏰.
Do not forget to put Stop loss for your positions (For every position you want to open).
Please follow your strategy; this is just my idea, and I will gladly see your ideas in this post.
Please do not forget the ✅' like '✅ button 🙏😊 & Share it with your friends; thanks, and Trade safe.
ETHEREUM → Long-squeeze before the rally? To the MOON, to $4800?BINANCE:ETHUSDT continues the phase of correction, the character of which is consolidation. The goal is to gather potential before possible growth on the trend. The target is 4000-4800
The main focus is on ETH-ETF, which, according to rumors, may be allowed to trade on July 2-4. This will be another positive signal for the cryptocurrency community, as this fact may expand the underlying demand for cryptocurrencies and attract additional capital.
Fundamentally, ETH is seeing an increase in the number of active wallets, traders are actively buying call options with strike 4000 and expiration in September, Ethereum Foundation is not selling ETH now as it usually did close to market tops, which together gives positive signs.
The asset price is in a downward correction at the moment. The essence of this movement is the asset's consolidation before further strengthening.
Resistance levels: descending wedge line, 3678, 0.5 fibo
Support levels: 3200, trend line, 0.79 fibo
Technically, liquidation of buyers in the liquidity area formed behind the trend support is possible, long-squeeze may lead to a rally.
Regards R. Linda!

TON/USDT LONG SCALP SETUP!!Hey everyone!
If you're enjoying this analysis, a thumbs up and follow would be greatly appreciated!
TON/USDT looks good here. Forming a symmetrical triangle-like structure here and trying to break out from it. After a successful breakout expecting a 15-20% from here. You can long now or wait for a confirmed breakout.
Entry:- At CMP and add more up to $7.62
Targets:- $7.98/$8.35/$8.68/$9.10
SL:- $7.44
Lev:- 5x-10x
What are your thoughts on SNX's current price action? Do you see a bullish pattern? Share your analysis in the comments below!

GBPUSD Sideways Consolidation and Potential Breakout MovesGBPUSD is currently in a sideways consolidation on the 1-hourly chart, presenting a potential for an expansion move or breakout in the coming week. Should the market break out to the upside, there are two potential shorting opportunities to consider.
Analysis:
- Sideways Consolidation: GBPUSD is in a range-bound phase on the 1-hourly chart.
- Potential Breakout: Watch for an expansion move.
Shorting Opportunities:
Traditional Resistance Level:
- Level: 1.2662
Strategy: Look for Magic Candle Confirmation around this resistance level to enter a short position.
Bearish Gartley Pattern:
- Completion Level: 1.2677
- Strategy: Monitor for the Bearish Gartley pattern completion and confirm with bearish signals to enter a short position.
Strategy:
- Monitor Breakout: Pay close attention to the price action for a breakout, should the market breakout to the upside, there are 2 resistance level you have to take note.
Shorting Levels:
- 1.2662: Traditional resistance level.
- 1.2677: Bearish Gartley pattern completion.
- Confirmation: Ensure to look for confirmation signals (such as bearish candlestick patterns or other technical indicators) before entering a short position.
- Risk Management: Use appropriate stop-loss levels to manage risk, and not risking more than 1% of your equity.
- Stay alert and be ready to act on these potential setups. What’s your take on GBPUSD?
Do you see any other potential setups or insights? Share your thoughts and strategies below!
