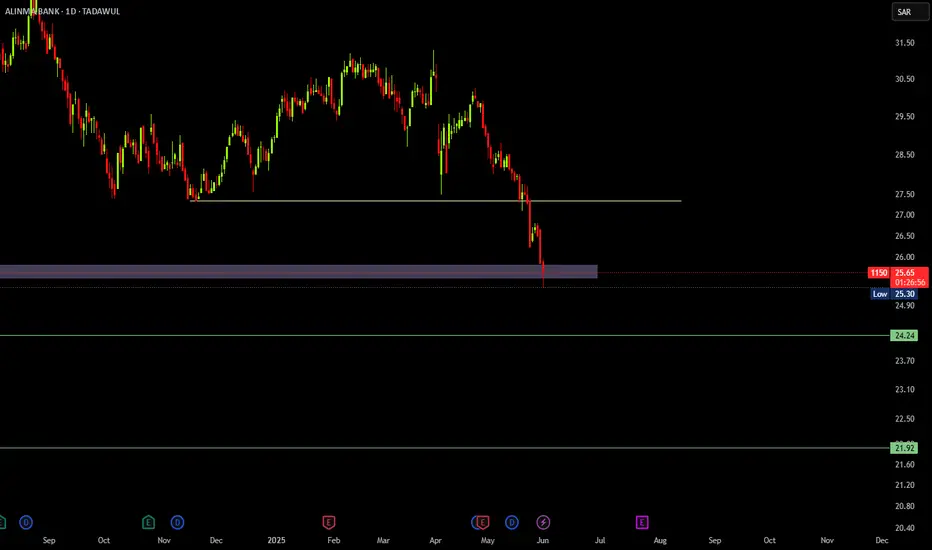
1150 IS PUSHING LOWERBack in January, I posted to buy 1150, but the market managed to take the opposite direction tp come lower and lower due to the conditions we currently have.
Now the price is pushing towards the level 24.24, we'll see how it will act around the level, but probably it will break through it and reach the next level at 21.92.
So for now don't buy anything on 1150.
Meanwhile, there's a golden opportunity for those who wants to learn how to trade Saudi Market, since it is in a level where you have all the possible configuration you'll face while running low.
Let me know if you got further questions!
Tadawul
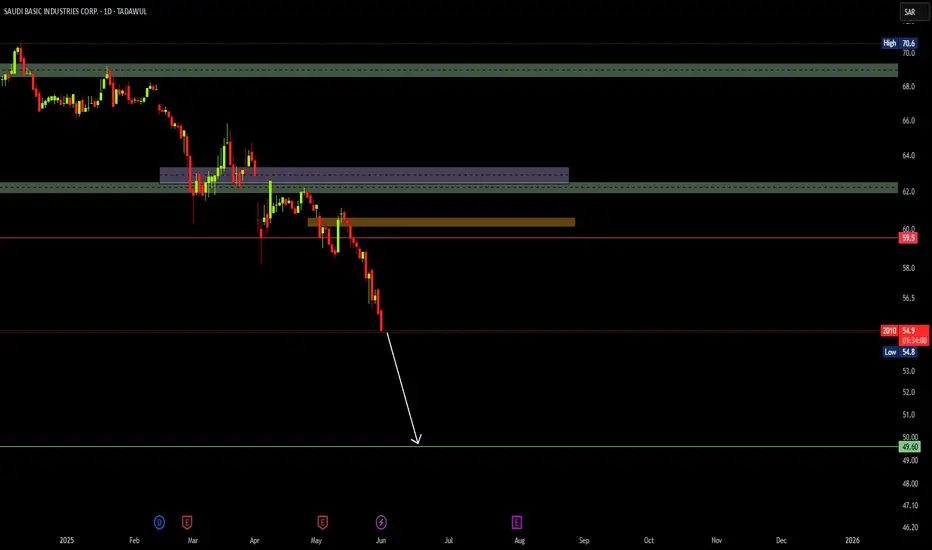
2010 WILL GO FURTHER LOWER2 Months ago, I posted that 2010 will go lower but some of you didn'tlisted and contacted me saying that it won't. As usual, time proves who's right and who's wrong.
Now as you can notice on the chart, the price reached the point I told you and went further lower, now we're looking for it to reach 49.60.
DON'T BUY FOR NOW!
Meanwhile, there's a golden opportunity for those who wants to learn how to trade Saudi Market, since it is in a level where you have all the possible configuration you'll face while running low.
Let me know if you got further questions!
A TRADE WE'RE HOLDING We've been holding this trade on 2040 for a month now in which we're doing great so far despite the Market slow movement.
The entry on this trade is based on liquidity and market gaps in case you wondered!
Meanwhile, there's a golden opportunity for those who wants to learn how to trade Saudi Market, since it is in a level where you have all the possible configuration you'll face while running low.
Let me know if you got further questions!

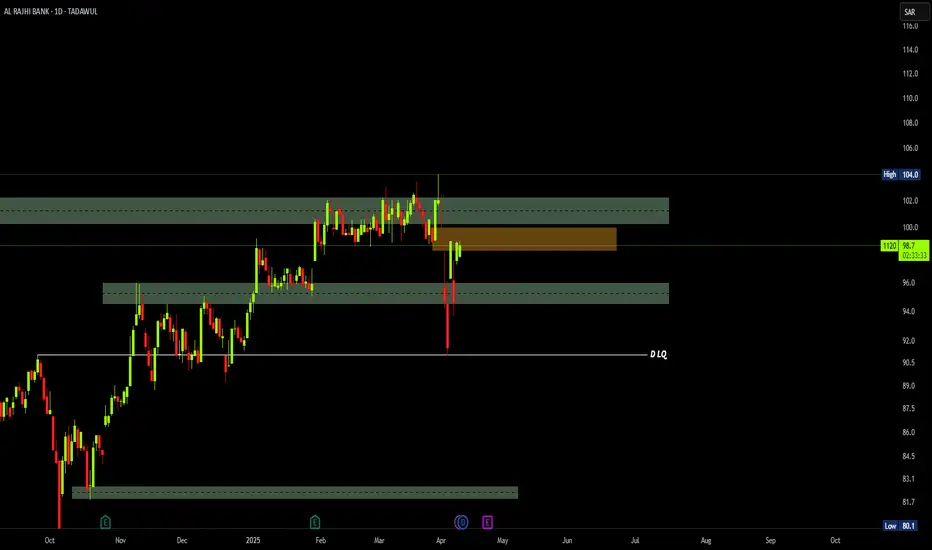
1120 IS GOING TOWARDS 82.6AL Rajhi is one of the stocks most of people buy,
I have read in a group yesterday that it's a golden oppoertunity to buy it now, but if we have a look at the chart, we'll see the opposite, the price just made a reversal as you can see, now it is heading towards 82.6 AT LEAST , don't rush and buy it, instead wait for the oprimal entry to take.
Meanwhile, there's a golden opportunity for those who wants to learn how to trade Saudi Market, since it is in a level where you have all the possible configuration you'll face while running low.
Let me know if you got further questions!

A TRADE I SHARED WITH MY CLIENTSI'm sharing with you this trade I gave to my clients which is still at the red side, we entered based on lots of criteria and we're waiting for the market now to do its job.
Note:
Tha market is slow and running low since we all know TASI is coming lower and lower, for now we could catch the 3 trades we have on Saudi Market, we'll hold them for the couple next months.
Meanwhile, there's a golden opportunity for those who wants to learn how to trade Saudi Market, since it is in a level where you have all the possible configuration you'll face while running low.
Let me know if you got further questions!
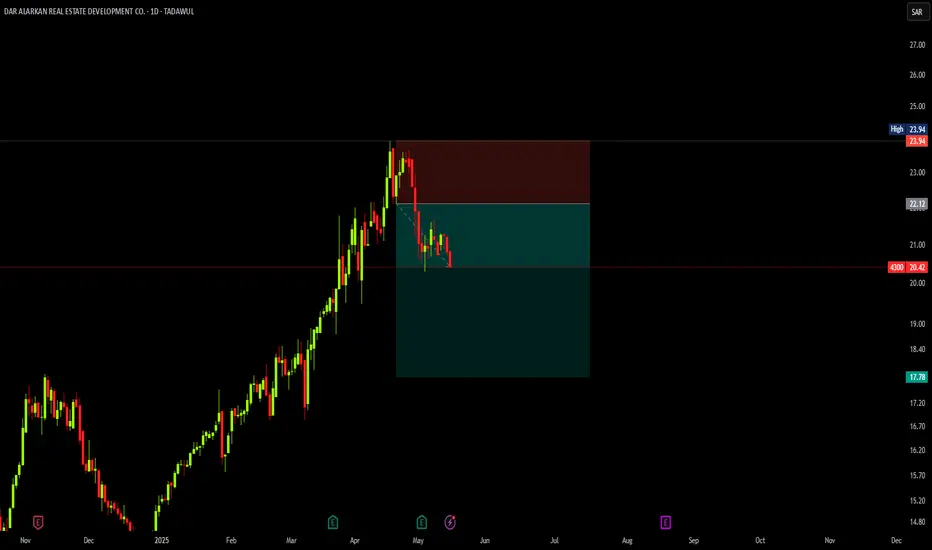
DON'T BUY 43004300 is going in a bearish movement after that it gave us a new high, for now it's not the right time to buy it, and if you just bought or holding shares any place nearby the high, you can close and wait for the next bullish rally.
Follow for more!
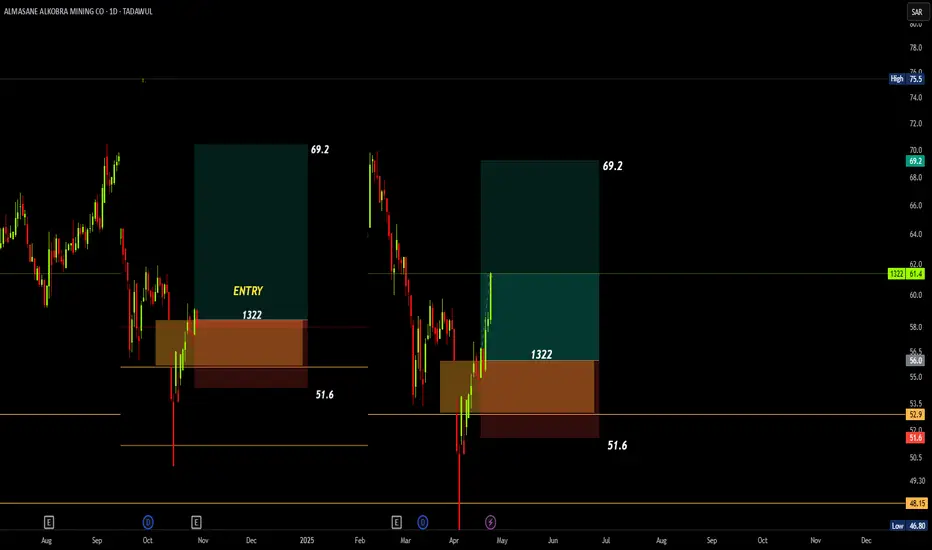
1322 GOING TOWARDS THE TARGETOne of the latest trades I shared with my clients is going towards the target, you still can buy but it won't be as safe as if you bought at the entry I gave them.
Follow for more!
For further questions, don't hesitate to ask!
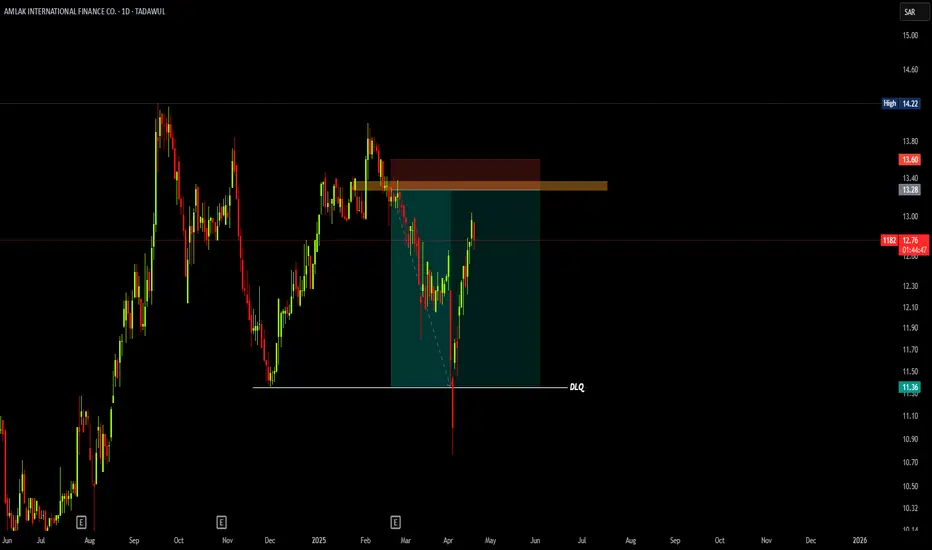
1182 IS PREPARING AN ENTRYA month ago, I posted that 1182 is going lower to reach 11.36 for a liquidity crab, now after that it did, we can prepare ourselves to take the entry it is preparing so we can recover from the loss we've been through in the market crash.
Follow for more updates!
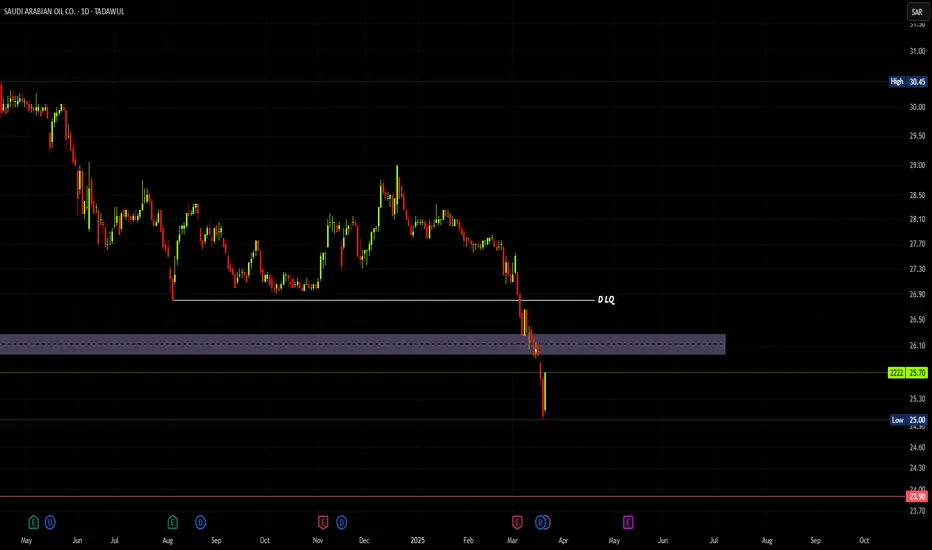
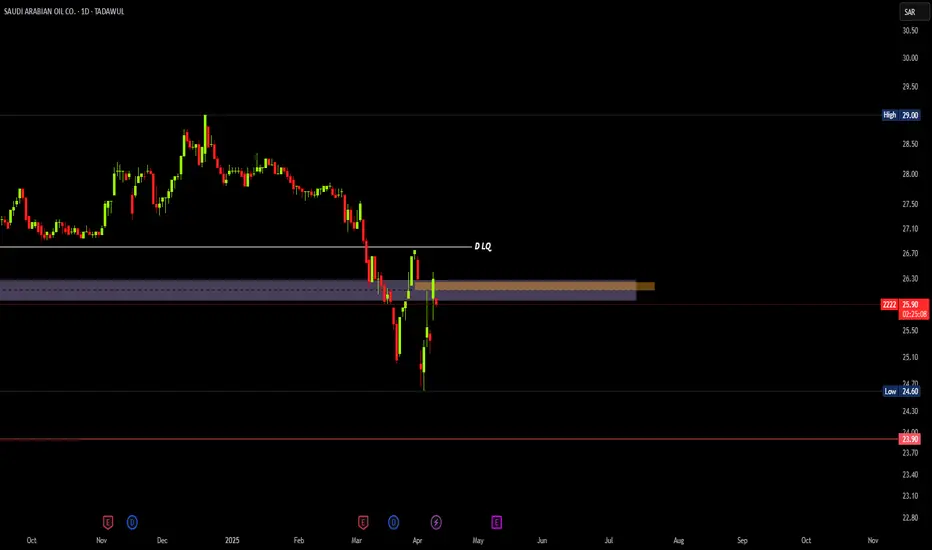
2222 WILL GO LOWERAramco is one of the stocks everyone's wanting to buy, but the problem is all it does is going lower and lower.
As you can notice on the cart, we have both an FVG (highlighted in purple) and a Gap (highlighted in orange), which both the price pulled back on and started going lower.
For now don't buy it, just hold your funds till I post about buying it.
The comment section is all yours for further questions!
Follow for more!
1120 IS PREPARING AN ENTRYDear Saudi Traders,
Been a while since I last posted, and here I am now with the pdates on the market.
We're all aware of the American-Saudi Business situation and how it affected the markets last week, yet we don't know for how long it will last and how lower the markets will get.
However, TASI shows that the price will continue in its normal movement before what happened last weekend.
Now we'll just wait for the market to fill the gap I highlighted in orange to get our entry based on it.
Mots of people lost their money in the market, some lost all of their wallets, my clients too lost a large mount of their portfolio, however we'll get through that and recover.
The comment section is all yours for any questions or help!
Follow for more!
1120 is entered into bearish zone 1120 (Saudi Arabia Stock Exchange) is entered into bearish zone. It could drop more and rapidly. Fresh buying is not recommended.
Note, this is not a buy sell trade call. Trade at your own will.

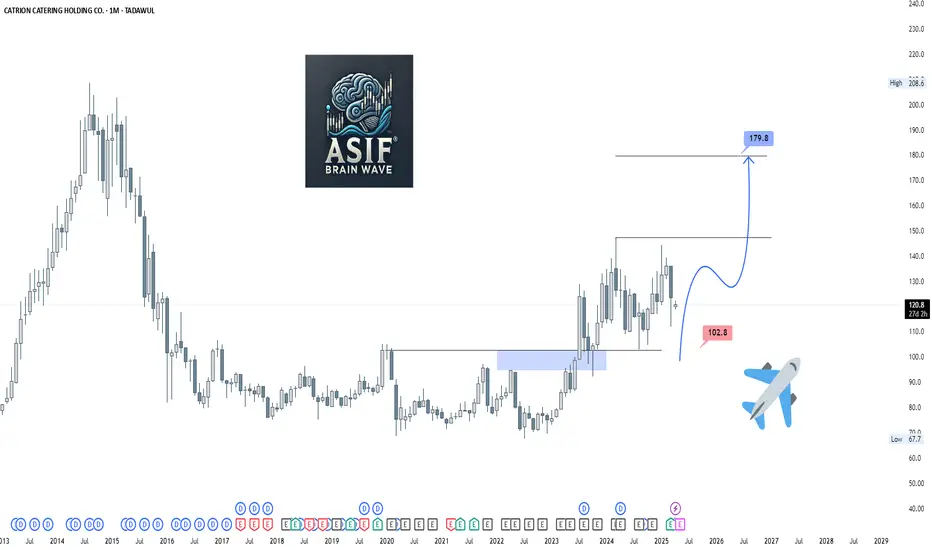
Catrion Catering Holding 6004✈️ Aviation-Themed Trading Captions
"Every flight needs a runway — the market is just taxiing before takeoff."
"Before soaring to 179.8, it’s just aligning on the runway. Fasten your seatbelts!"
"Just like a Saudi Airlines jet — a slight dip for alignment, then full throttle to the skies!"
"Descending slightly, not to fall — but to gather momentum for liftoff!"
"Markets, like planes, don’t take off from mid-air — they need the runway first."
"Runway 102.8 cleared. Destination: 179.8. Ready for takeoff!"
"Don't fear the pullback — it's just taxiing before liftoff."
"From the runway at 102.8, straight up to cruising altitude 179.8 — fasten your trading seatbelts!"
TARGET FILLED ON 1010A trade I gave to my clients the beginning of this month reached the target last week.
These are the kind of the trades we're taking, slow but profitable!
Join the community by following us!

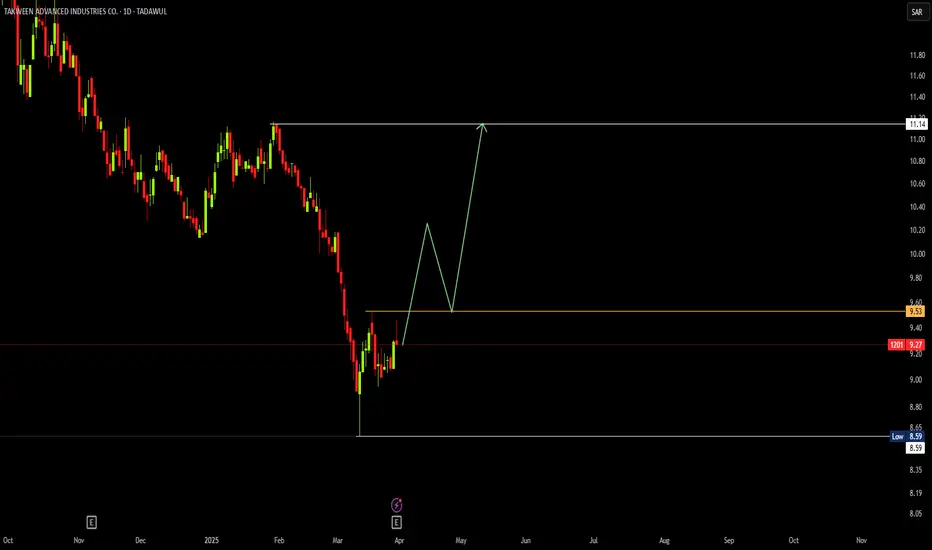
1201 IS ONE OF THE STOKS ON MY WATCHLISTEid Mubarak Said, Now since we're getting back to work sooner, I want to share with you some of the stocks I have on my watchlist.
For 1201, you can buy as soon as the price goes through 9.53 level to target 11.14, and your stop must be at 8.59.
Follow for more!
BUY TASIAnd yes, here is the opportunity y'all been waiting for, you can buy TASI now and set your levels as set on my chart!
This is one of the 7 trades I shared to my cients, you can follow so whenever I drop the others you can take them!

SAUDI ARAMCO BASE OIL - Daily Chart (TADAWUL)SAUDI ARAMCO BASE OIL - Daily Chart (TADAWUL)
"After a long bearish phase, the market finally pauses to breathe. If the next bullish leg confirms, it will unlock the roadmap to higher targets. With strong conviction, I believe the 2025 low is already in place. Eyes on 107.4 first, then 111.8. Let price reveal the story.

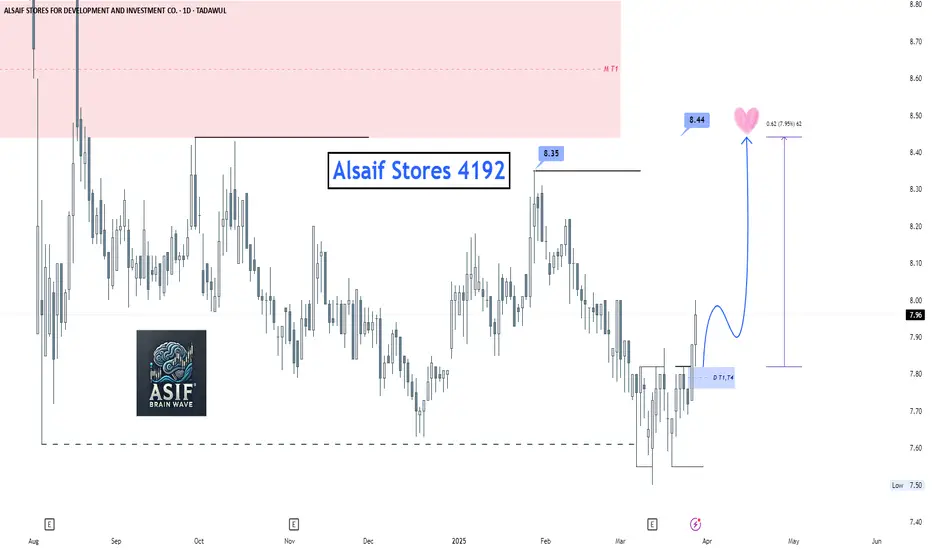
Trade Idea: ALSAIF STORES (TADAWUL: 4161)📈 Trade Idea: ALSAIF STORES (TADAWUL: 4161)
Timeframe: Daily (1D)
Current Price: 7.96 SAR
Setup Type: Breakout & Retest
🔍 Trade Narrative:
Price has broken above a recent consolidation zone (marked in light blue).
Strong bullish momentum is visible after reclaiming the key level of 7.80.
Market structure shows higher lows and a push towards previous liquidity zones.
🎯 Trade Plan:
Entry Zone: 7.80 – 7.90 (retest area)
Target 1 (T1): 8.35 (Previous High / Liquidity Grab)
Target 2 (T2): 8.44 (Final Target with Heart Marker 💗)
Stop Loss: Below 7.70 (below recent structure)
📊 Risk-to-Reward:
Approx. Risk: 0.20
Reward: 0.44 – 0.64
R:R Ratio: ~2.2 to 3.2
🔧 Confluence:
Daily structure shift confirmed
Liquidity resting above 8.35
Volume spike during breakout
Potential bullish continuation if price retests successfully
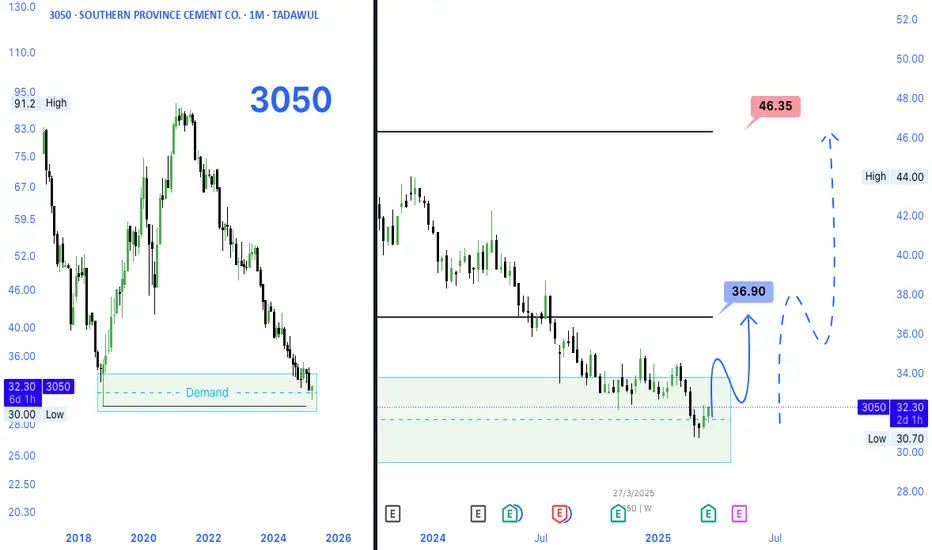
TADAWUL: 3050 (Southern Province Cement Co.)📈 TADAWUL: 3050 (Southern Province Cement Co.)
The stock has entered a long-term demand zone near 30.70–32.00, showing historical support. If this zone holds, a potential bullish reversal could take price first toward the 36.90 resistance, then to 44.00, with a final target around 46.35.
Trade Idea:
Entry: 32.00–33.00 (inside demand zone)
TP1: 36.90
TP2: 44.00
TP3: 46.35
SL: Below 29
Bias: Bullish (as long as price holds above 30.70)
Narrative: Accumulation in demand zone with a possible shift in trend.
Trading Idea - Saudi Ceramic (2040) | Monthly Chart with Inverte🧠 Trading Idea - Saudi Ceramic (2040) | Monthly Chart with Inverted FVG
🔍 Chart Context:
Price has reacted from a Monthly Inverted Fair Value Gap (IFVG ), indicating a potential premium-level supply zone.
This rejection confirms sellers’ presence at the premium pricing zone, causing a sharp drop.
Price has returned to the discount zone, inside the Monthly FVG (Buy Side Imbalance Sell Side Inefficiency - BISI), offering a potential long opportunity.
📌 Key Technical Concepts:
✅ IFVG = Zone of Previous Supply / Institutional Sell Orders – price rejected sharply from there.
🟦 FVG = Current demand zone (discount area) with potential to support a reversal.
Liquidity above 54.3 SAR remains untouched, showing a magnet for future price movement.
📈 Trade Plan:
Accumulate in the FVG zone (28–30 SAR).
Watch for bullish confirmation (e.g., engulfing candles or internal BOS).
Ride the move towards Buy Side Liquidity @ 54.3 SAR.
🎯 Target Zones:
TP1: 36 SAR (range high retest)
TP2: 48 SAR (pre-IFVG reaction zone)
TP3: 54.3 SAR (BSL target – possible liquidity sweep)
📉 Stop Loss: Below 24 SAR (FVG invalidation zone)
💬 Narrative Summary:
Price was rejected from the Monthly IFVG (supply), now resting in a Monthly FVG (demand). This is a classic Discount → Premium cycle setup, with potential for a bullish reversal targeting Buy Side Liquidity above the recent highs.

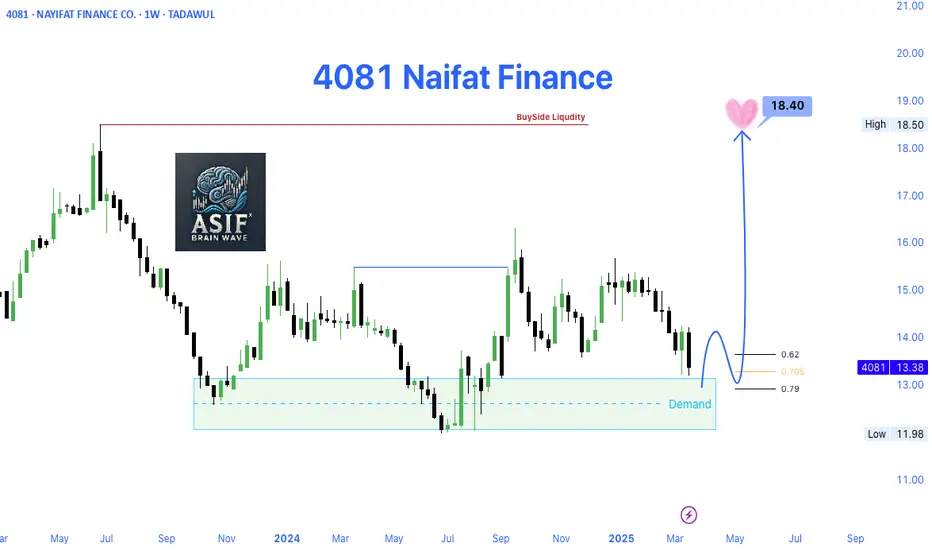
4081 Naifat Finance (TADAWUL)📊 Trade Idea Overview – Weekly Timeframe
✅ Key Technical Levels:
Demand Zone: Clearly marked between 12.00 – 13.00, showing strong historical buyer interest.
Current Price: 13.38
Fibonacci Retracement Levels: Price is reacting near the 0.705 - 0.79 zone, which often acts as a bullish reversal area.
Target Price: 18.40 — Identified as Buy-Side Liquidity Zone (BSL) and a previous significant high.
Resistance Zone: Around 18.40, where liquidity is likely to get captured by smart money.
📌 Narrative & Market Context:
Price has shown a bullish reaction from the Demand Zone, indicating accumulation or potential bottom formation.
Fibonacci confluence with demand strengthens the bullish setup.
Once price breaks above 14.00, a bullish market structure shift will be confirmed.
The chart also visualizes a projected path toward 18.40, indicating a strong bullish impulse wave ahead.
📈 Expected Price Path (as shown in chart):
Minor pullback toward 13.00 area (retest demand / Fibonacci zone).
Breakout above 14.00 – a key structural shift.
Bullish continuation toward 18.40 Buy-Side Liquidity.
📍 Trading Plan Suggestion:
Entry Zone: Between 13.00 – 13.20 (ideal demand re-entry).
Stop Loss: Below 12.00 (invalidate demand structure).
Take Profit: 18.40
Risk-Reward Ratio: Excellent (Potentially 1:3+ R:R)
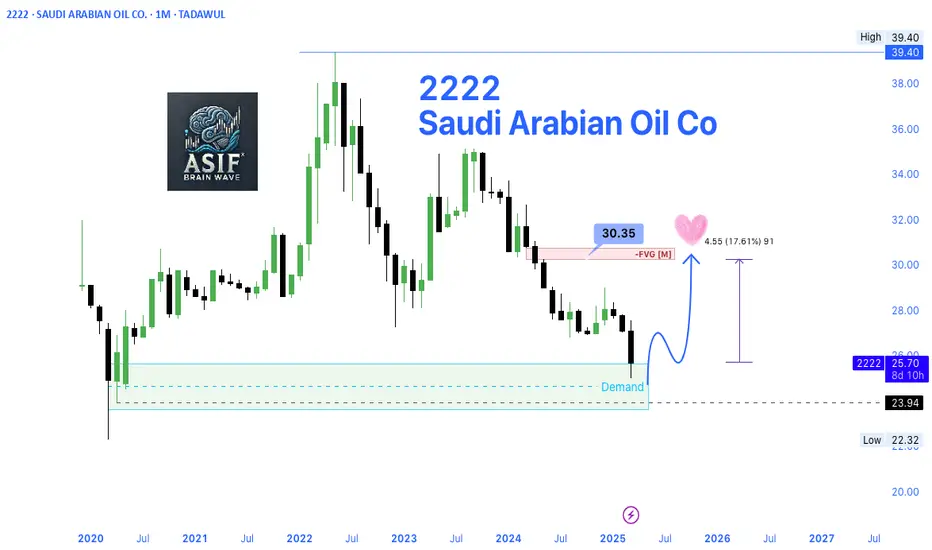
2222 – Saudi Arabian Oil Co | Long Idea – Monthly Chart Analysis📈 2222 – Saudi Arabian Oil Co | Long Idea – Monthly Chart Analysis
Price has reached a Monthly Demand Zone, where strong historical buying interest was seen. After a consistent downtrend, we are now approaching a potential accumulation zone.
🟦 Trade Idea:
Entry Zone: 23.90 – 25.50 (within Monthly Demand)
Stop Loss: Below 22.30 (Monthly swing low)
Target 1: 30.35 (Monthly Fair Value Gap – FVG)
Risk:Reward: Excellent potential with ~17.6% upside
📊 Narrative: This setup aligns with Smart Money Concepts (SMC) and ICT methodology:
Liquidity sweep at the low
Reversal from Demand
Targeting FVG imbalance above
❤️ A potential bullish move is anticipated, tapping into premium pricing around 30.35, which may act as a magnet for price.
🔔 Watch for bullish confirmation candle or a shift in structure (CHoCH) on lower timeframes for refined entry.
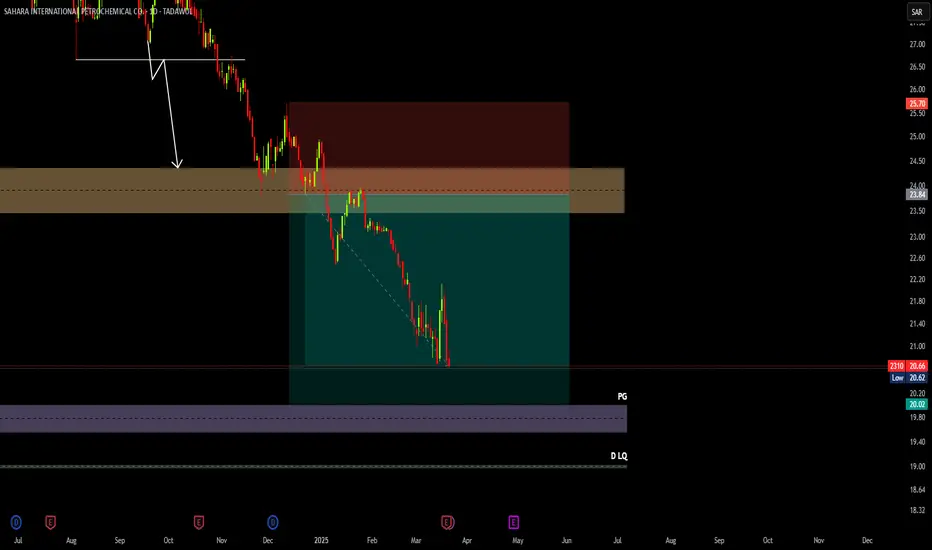
2310 ALMOST AT THE PRICE GAPCouple days ago, I posted that 2310 will continue going lower to reach 20.02 before starting to go higher again.
And here is the stock coming lower to our Price Gap to fill it before starting to raise.
Meanwhile, I'm waiting for the stocks I shared to my clients to get a bit far from the entry so they can make profits from them, then I can post them to the public.
Follow for more!
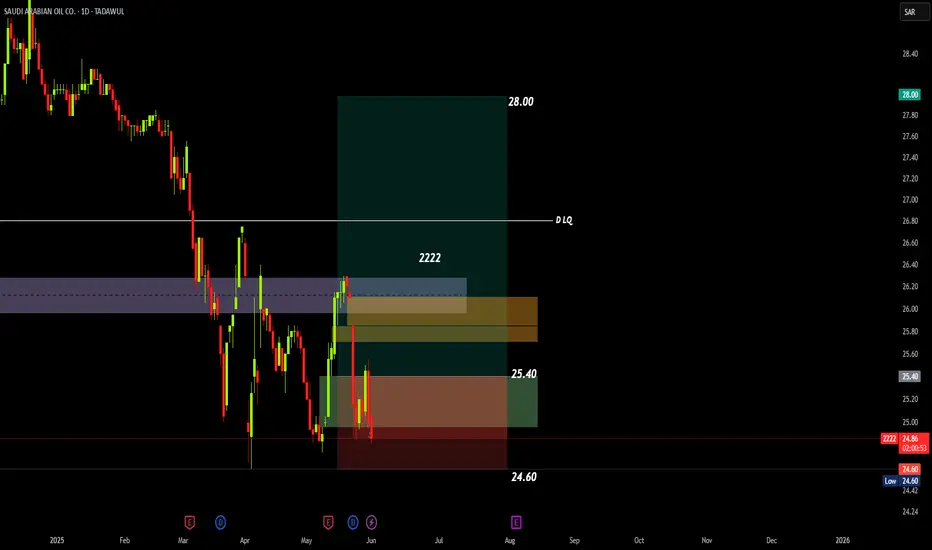
2222 WILL GO LOWER2222 is also one of the stocks that are showing no indication that it will come higher anytime sooner.
We'd expect from the price to drop to 23.90 before reversing, if you're welling to buy I advice you not to.
While waiting for other opportunities, my clients and I are holding on 3 other stocks I will post as soon as the market starts going higher.
Follow for more!