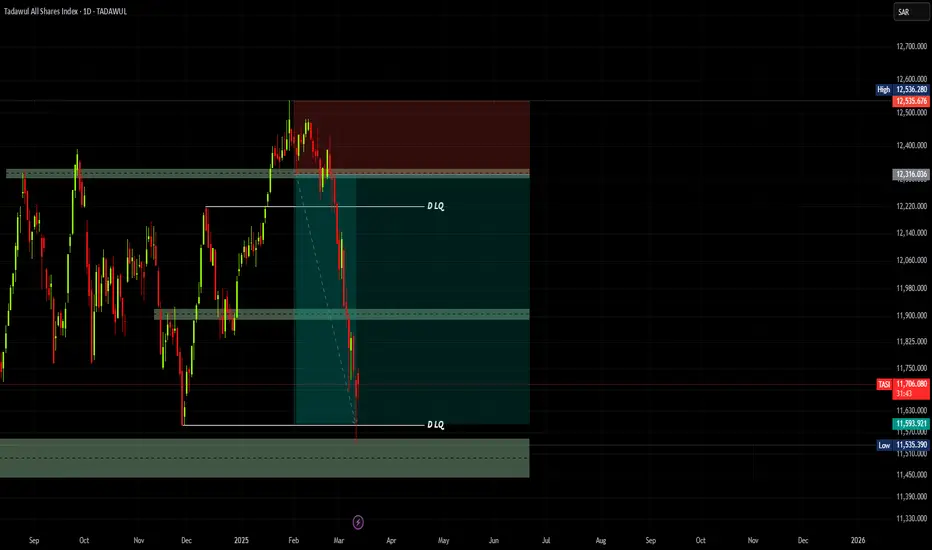
TASI IS PREPARING AN ENTRYAfter that TASI has taken the liquidity at 11,553, it just gave us an indication that it will start going bullish, no clean entry for now, but we'll keep waiting.
Meanwhile, my clients and I have taken other trades on 3 other stocks that are still in a safe zone, waiting for them to go higher so I can share them to the public.
As soon as I catch the entry and share it to my clients, I will share it to the public.
If you really care about taking clean entries, you must wait for the confirmation of the up movement then you can have a safe entry.
Follow for more!
Tadawul

1182 IS STILL GOING LOWER As you can notice on the chart, 1182 is still going in a bearish trend to reach at least 11.36 before it starts creating an entry to take, for now don't buy it since it will continue dropping down.
In few days I will share with you the trades I gave to my clients!
Follow for more!

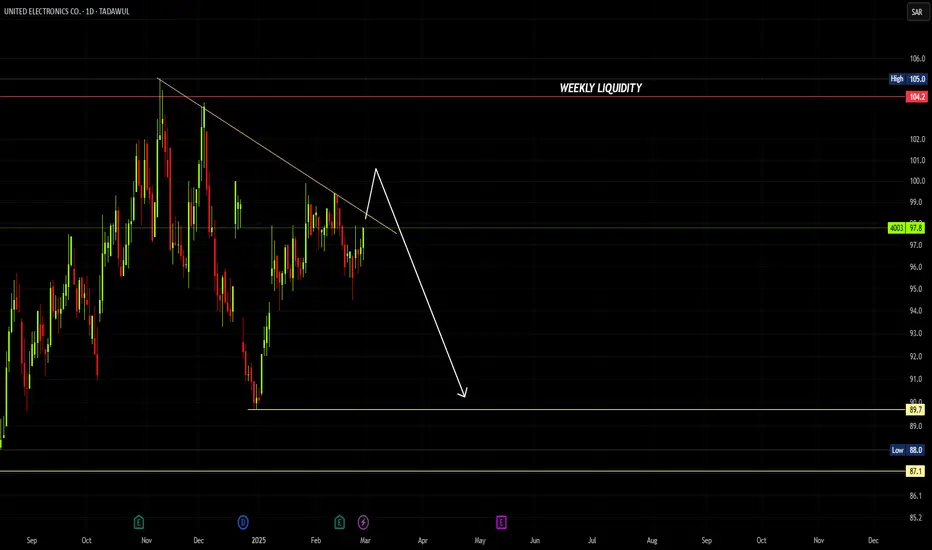
Bearish Setup on United Electronics Co TADAWUL Weekly TimeframeStructure & Market Behavior:
The market made a strong bullish move from the green highlighted zone labeled as "unmitigated order flow", pushing up with a clear Break of Structure (BoS) on the left side.
A strong rally continued until it peaked (highlighted by the blue dot).
After the peak, the price dropped, creating a Lower High (LH) and Lower Low (LL) structure, suggesting a bearish shift.
Key Elements Marked:
Order Block (OB): A bearish OB is marked on the right side near the current price level (~96.4). This could act as a resistance/supply zone.
Equal Highs (EQ_H): Indicating a liquidity pool where market makers may hunt before a reversal.
Market Pattern: A minor bullish bounce is expected from current levels before a sharp drop.
Forecasted Path:
Price might grab liquidity above EQ_H (false bullish move), then reverse sharply downward.
Target area: Green zone near 40-50 SAR — previously unmitigated order flow/demand zone.
Final projected low is marked around 31.75, which might be an exaggerated worst-case scenario.
Conclusion:
Your chart suggests that the price is in a distribution phase and likely to experience a major sell-off after a liquidity grab above EQ_H. The long-term bearish bias is supported by:
Order block rejection
Equal highs as liquidity targets
Previous bullish rally needing rebalancing (Fair Value Gap / Order Flow)

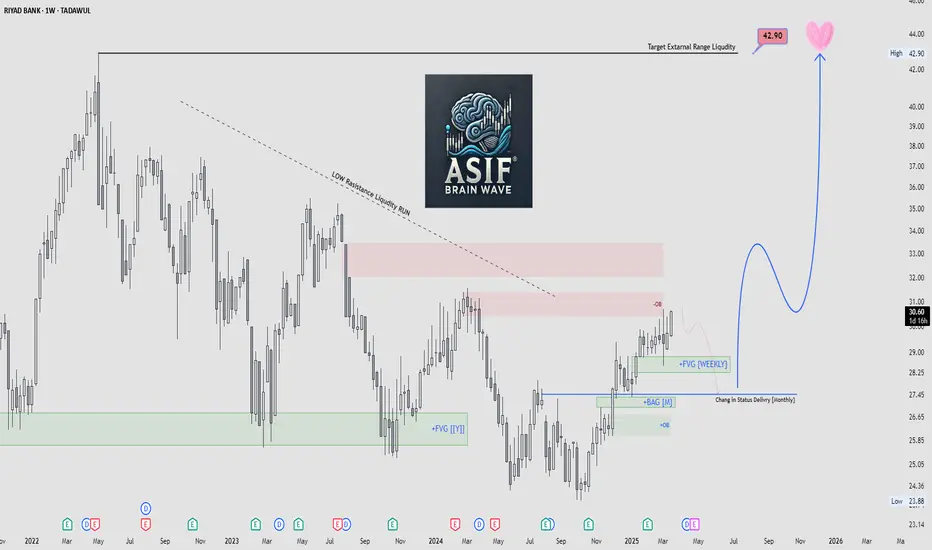
RIYAD BANK - Weekly Chart (TADAWUL)RIYAD BANK - Weekly Chart (TADAWUL)
Current Price: Around 30.60
Target Price: 42.90 (marked with a heart 💗 at the top)
Plan:
Price may first drop a little (towards 27–28 zone), then move up strongly toward the target (42.90).
Important Zones:
FVG: Areas where price may bounce or react.
OB (Order Block): A strong resistance zone.
Change in Status: A possible support area where the trend might change.
Overall Idea:
The chart shows a possible move down first, then a big upward move toward the 42.90 target.
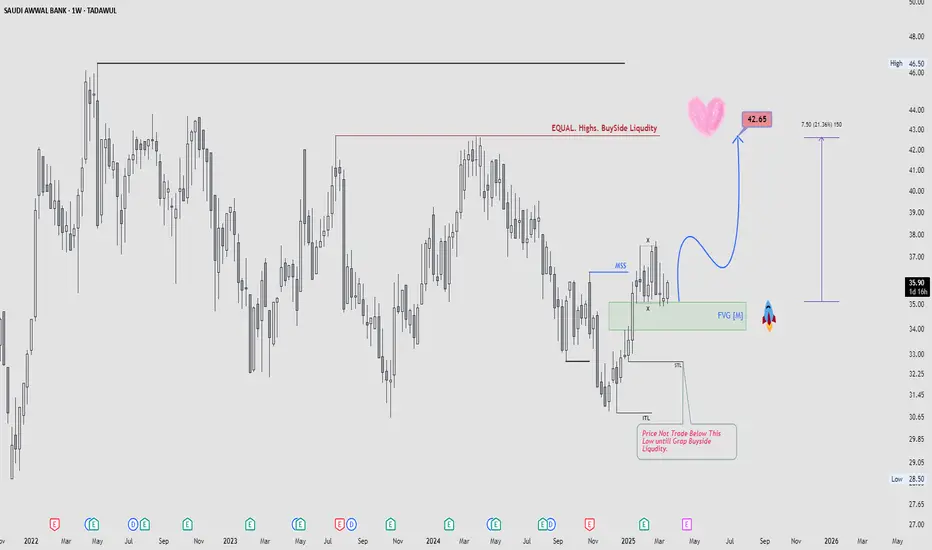
SAUDI AWWAL BANK | Weekly Timeframe (TADAWUL)Chart Analysis – SAUDI AWWAL BANK | Weekly Timeframe (TADAWUL)
Key Areas Highlighted:
Equal Highs (Buy-Side Liquidity): Marked at the top (around 46.50), indicating a liquidity pool where institutions might target to grab stop-losses above these highs.
Target Price: 42.65 is marked as a significant level where price is expected to move next (short-term target).
FVG (Fair Value Gap - Monthly): A green zone around the 33-36 range indicates an area of imbalance that price might fill before continuing upward.
Market Structure Shift (MSS): Marked on the chart showing a structural change, signaling a bullish reversal.
ITL (Internal Liquidity) & STL (Sell-Side Liquidity): Noted near the lows, highlighting liquidity zones. A note mentions:
“Price will not trade below this low until buy-side liquidity is grabbed.”
Overall Expectation:
Price may retrace into the FVG (Fair Value Gap) zone.
After that, it’s expected to move higher toward the 42.65 level and possibly target the liquidity above equal highs near 46.50.
A projected move of +21.36% is highlighted from current price zone to the 42.65 target.
TASI IS PREPARING A BULLISH MOVEMENTCouple days ago, I posted that TASI will come lower to 11,535.390, and here it is now on the level in which it will probably create us an entry to take to target higher levels.
Follow so you don't miss the future updates!
6015 IS ABOUT TO GIVE US AN ENTRY TO TAKECouple days ago, I posted that 6015 will come lower to 2.14, if you listened and followed my advice and closed your positions, congrats!
But if you don't and you kept holding, I hope you didn't lose too much of your funds.
For now there's no clear entry to take, we'll keep waiting for the price to give us a proper entry to follow, which I will post a bit late, 2/3d after I share it to my clients so you can see how it goes.
Follow for more!

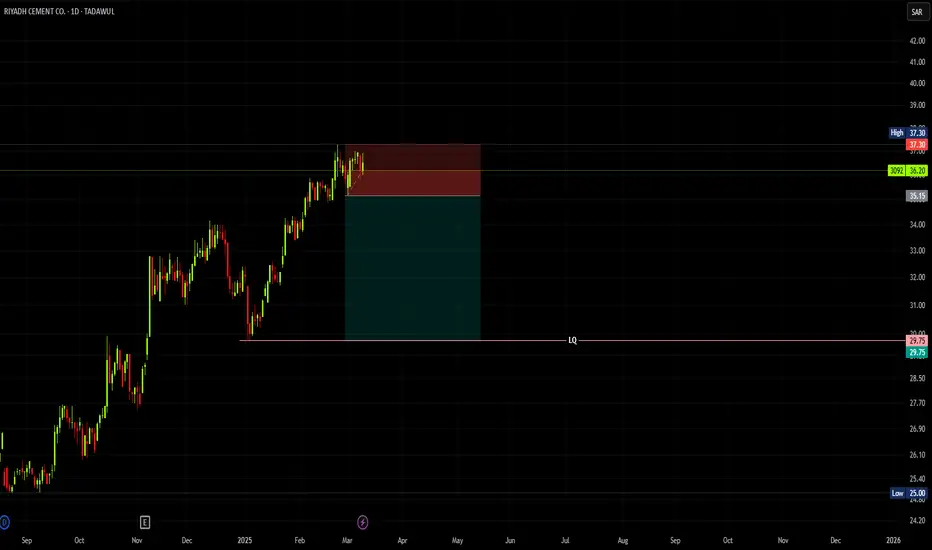
3092 IS GOING BEARISHWhile searching for some trades for my clients to buy, I found this on RIYADH CEMENT tn which the price is giving a reversal point in which it will go at least to 29.75.
If you're holding any profitable shares, you'd better close and enjoy your profits!
Follow for more!
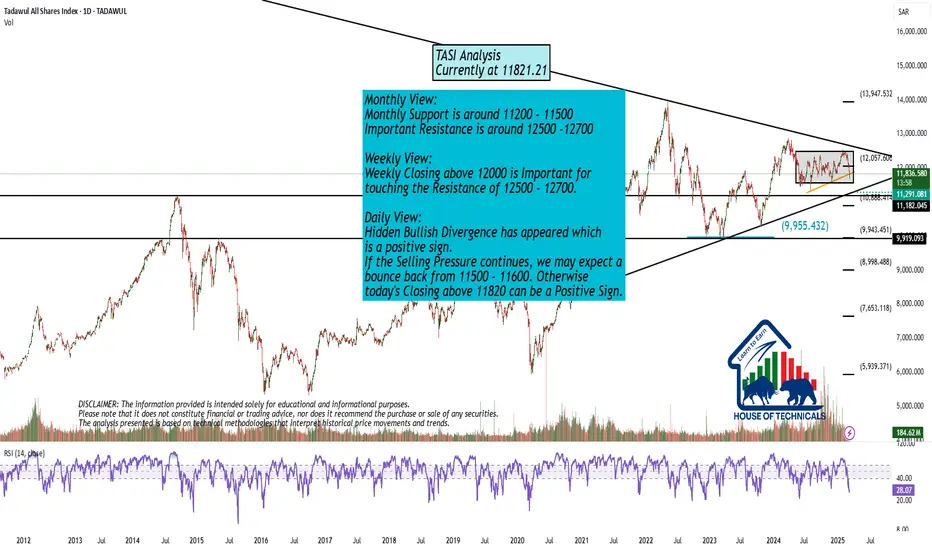
Different Time FramesMonthly View:
Monthly Support is around 11200 - 11500
Important Resistance is around 12500 -12700
Weekly View:
Weekly Closing above 12000 is Important for
touching the Resistance of 12500 - 12700.
Daily View:
Hidden Bullish Divergence has appeared which
is a positive sign.
If the Selling Pressure continues, we may expect a
bounce back from 11500 - 11600. Otherwise
today's Closing above 11820 can be a Positive Sign.
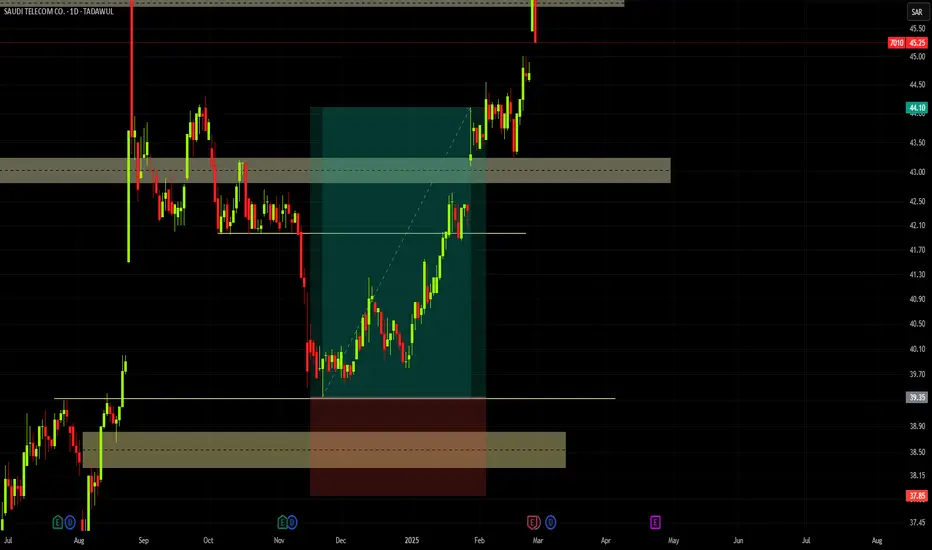
NOT A GOOD TIME TO BUY 4007If you have a look at the chart, you'll see that the price started going higher and higher since Dec 2024, grabbed the liquidities we have at 41.80 and 44.35, to give us a confirmation of a reversal right on the liquidity at 44.35.
Today the price grabbed the LQ we have at 41.80, and it will keep pushing down to 37.90 before giving us an entry to take.
For now, if you still haven't bought, you just wait. And if you already holding any shares, you can tell me in the comment section your entry so I can give you some help in your situation.
Follow for more!

6015 IS STILL GOING BEARISH DONT BUYAs you can notice on the chart, the price is still pushing bearish since Sept 2023 where it gave us the ATH.
In Jan 2025, it did a quick jump towards the LQ to grab it, and now ir is coming down towards the LQ level at 2.14, the least point we'll expect the price to reach is 2.19 where we have our OB.
Anything that than is just a wish.
NB: I follow the things I have in front of me on the chart combined with the Fundamentals. So please if you have any other POV you can discuss it politely.
Follow for more!

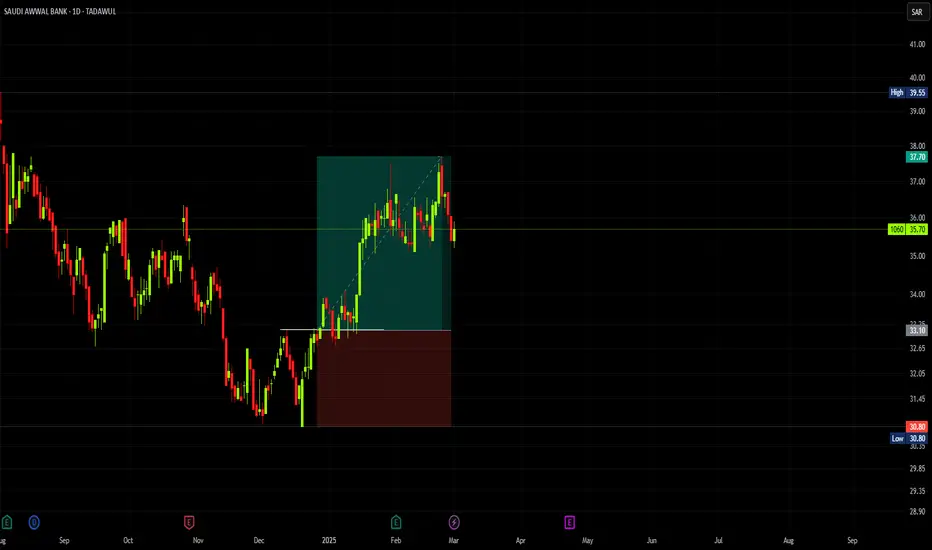
TARGET FILLED ON 10602 months ago, I posted to buy 1060, and the stock reached our TP couple days ago for a profit of 200% invested amount.
This is an example of the trades I share to my students and clients.
For further questions don't hesitate to ask!
Follow for more!
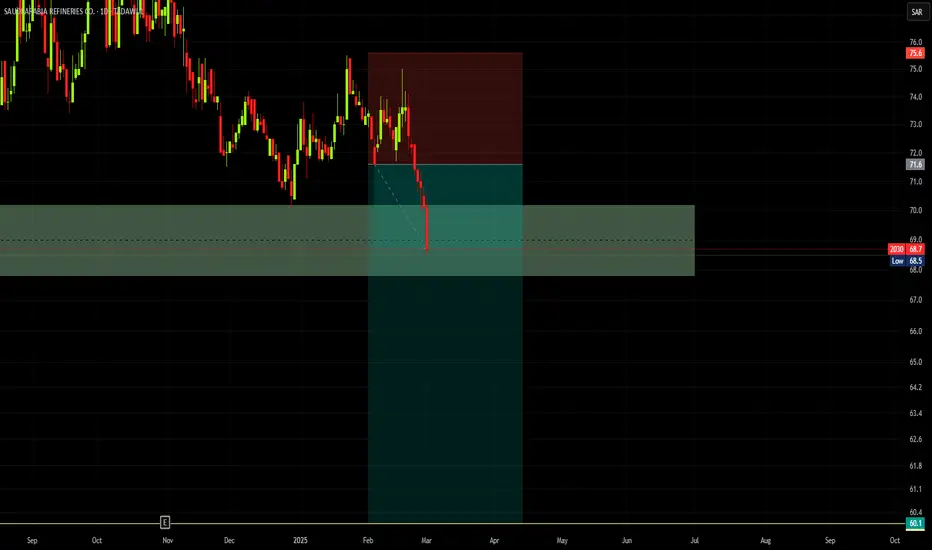
2030 IS STILL GOING BEARISH 2030 is one of the stocks people want to buy, but to do it in the current time is a wrong decision to make, since as you can see, it kept pushng lower and lower since Sep 2023.
For now, before we can take a small trade on it, we must wait for the stock to take the LQ we have in the level 60.1. As soon as it's done, we will search to see if we have our entry point to follow it.
For any further questions don't hesitate to ask!
Follow for more!
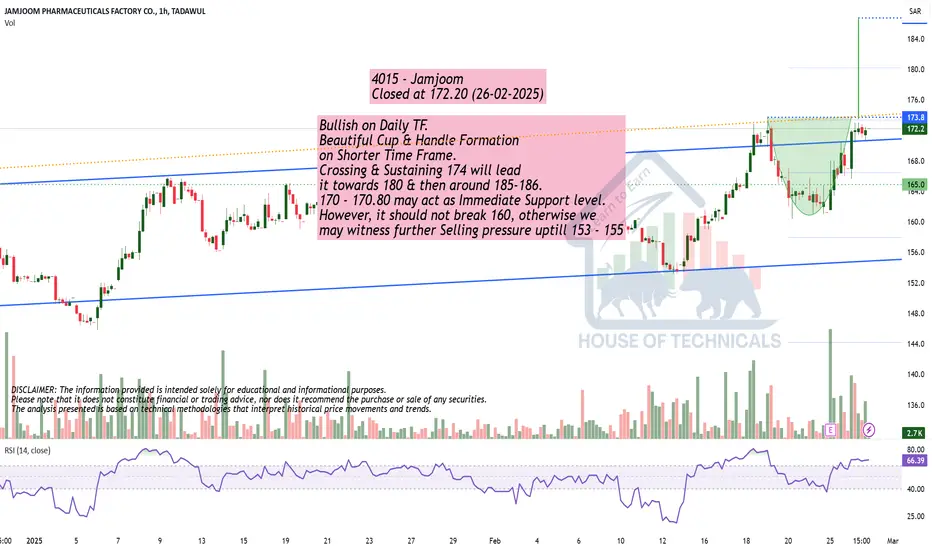
Bullish on Daily TF.Bullish on Daily TF.
Beautiful Cup & Handle Formation
on Shorter Time Frame.
Crossing & Sustaining 174 will lead
it towards 180 & then around 185-186.
170 - 170.80 may act as Immediate Support level.
However, it should not break 160, otherwise we
may witness further Selling pressure uptill 153 - 155
TASI IS GOING BEARISHAs you can notice on the chart, TASI as I told you in older posts, it grabbed the LQ at 12,302.190-12,333.861, gave us an entry point and now it is heading towards the level 11591.374 where it will grab the LQ.
For the people who have already bought, you can close and enjoy your profits, and for those who are willing to buy, the wise thing to do is hold your funds.
For further questions, don't hesitate to ask!
Follow for more!

A HIGH PROBABILITY 4003 WILL GO LOWERAs you can see on the chart, the price grabbed the ATH WK LQ, and now all it kept doing is giving us lower highs for the last 4 months since it grabbed the liquidity.
The wise thing to do is to sell if you're holding any shares, and if you haven't bought yet, just hold your funds and wait for the stock to give you a clear entry.
The comment section is all yours for further questions!
Follow for more!
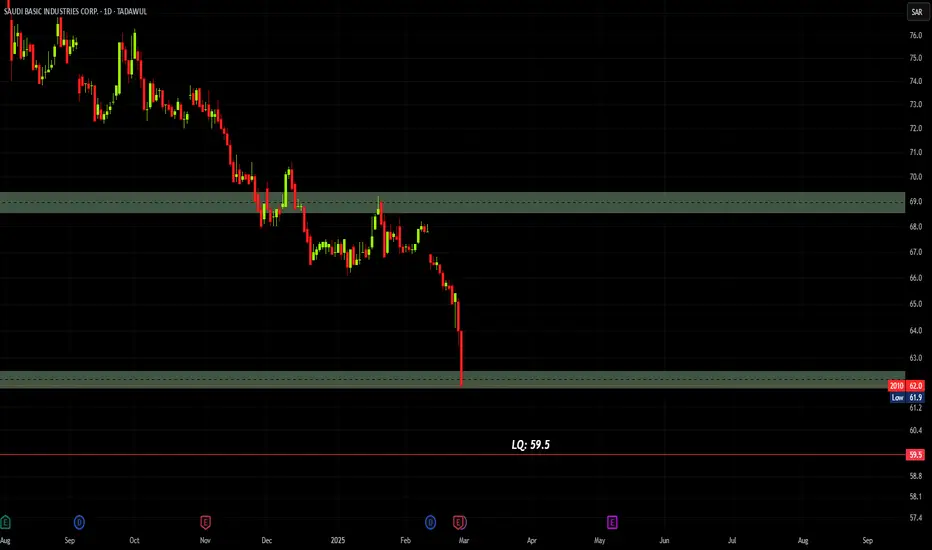
DONT BUY 2010 YETAs you can notice on the chart, the price is still pushing lower and lower since April 2024, for now we sill don't have an entry to take or any bullish indication, the price is still pushing lower and lower.
For the next 2 weeks, we'll see if the price will give us a confirmation of a reversal or no since it is already in a liquidity zone, don't get fooled by the big movement the market is going to the in the next couple days, that's just a manipulation.
For further questions the comment section is all yours!
Follow for more!
TP REACHED ON 2040One of the trades I gave to my clients and I shared to the public is this one on 2040, as you can see, the market have reached our TP and reversed right away.
BY the grace of Allah, all of the 5 trades we took for the past 2 month have reached the tp, and all of my clients are satisfied with the return they had from them after being in big losses, the least trade had a return of 200% of the invested amount.
Don't hesitate to ask if you got any further questions!
Follow for more!
TARGET REACHED ON 7010A trade I shared to the public at the same time I gave it to my clients have reached the target a month ago.
A trade that lasted for 2 month with a return of 300% of the amount invested.
These are the kind of the trades I give to my clients to make them satisfied of my service and make them safely invest and learn.
Follow for more!
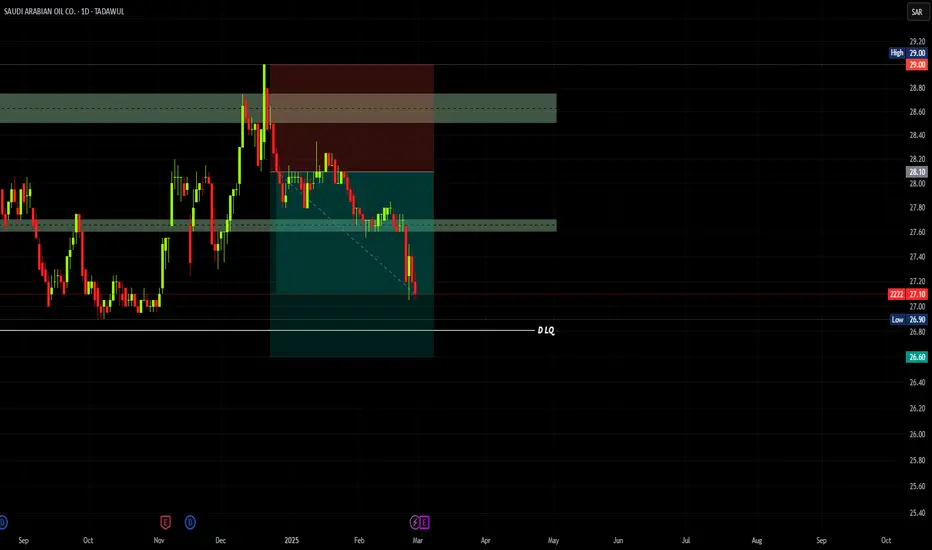
2222 IS STILL GOING DOWN | DONT BUYSince the beginning of the year, I been posting about 2222 that it will keep pusing lower and lower, however, as usual people who thinks we are just posting for views don't listen and buy lose their money and search for how to recover.
If you're reading this and you still haven't bought on 2222, don't do it since the price is still going lower and lower, you can ask me about the stocks to buy and I'll give them to you, just don't rush and throw your money in the river.
The comment section is all yours!
Follow for more!
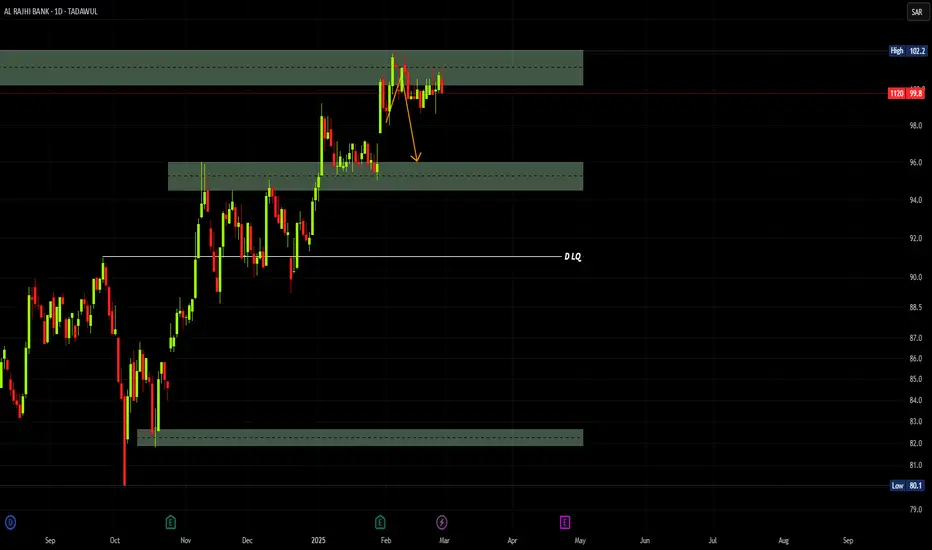
DONT BUY 1120 YETSome days ago, I posted not to buy 1120, and still some of you texted and argued about it, if you really are an investor you won't just throw your money away on Stocks.
However, you will get a consultation to know how the movement of the market is, how the market is reacting to the level it is in... which is the real purpose of consultations, not taking your money from you as some think.
Well, now on 1120 don't make any stupidity buying, you still need to wait until the price comes lower to give us an entry that we can follow to make the right decision.
For further questions, don't hesitate to ask!
Follow for more!
#3090 #Tabuk CementBased on the pattern identified on the weekly chart, a bullish flag pattern is currently forming. This suggests a continuation of the previous upward trend. Given the characteristics of the pattern, we can plan entries on a medium to long-term timeframe by closely monitoring the identified levels on the chart. Entries only a breakout.
"Non financial advice, do your own research"

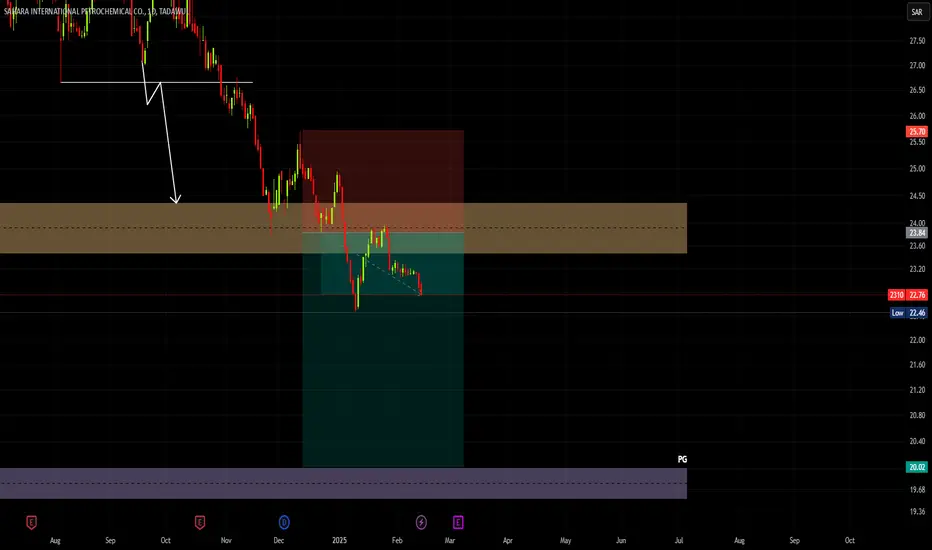
DONT BUY 2310Last month I posted not to buy on 2310, I explained why you shoudn't. Some people did buy and now they're in a loss.
You still can't buy since the market just pulled back on the liquidity zone again and continued going lower and lower.
Follow for more!