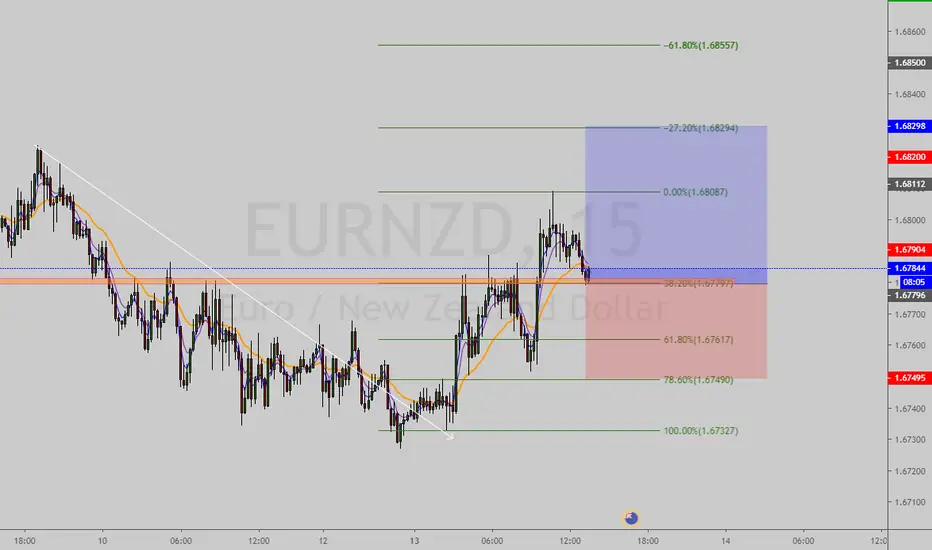
EURNZD LONG pequeñoobservamos rompimiento de estructura bajista anterior y como se esta creando una nueva tendencia alcista, entramos en compra al respetar la zona del ultimo alto mas bajo a la vez que hace confluencia con niveles claves de fibonacci
Takeprofit
I may have to give up my hopes of 5.4k....In my last post I called for 8.6-8.8k. We hit our target, and then some. I hope you guys took at least some profits.
A) Was our 14k* top. At which point we created a beautiful Chuva Fork on the WEEKLY Chart (Pale Orange Dotted Lines from 14k % 12k). We proceeded to correct down to 6.4k.
B) 6.4k saw a beautiful bounce after clearing the stops from 6.5k, and we haven't looked back since...
C) We're now dipping our toes into a Bearish 3Day Block, so I expect at least a minor correction. A pullback into the Bullish block in yellow (around 8-8.2k) would be ideal, and quite healthy. That being said, we can certainly grind further into this block before correcting.
Ultimately, I think this leg up has some more fuel, and probabilistic-ally, I see us testing that Daily Bearish Block around 11.1k (currently UnTested). So long as we hold that Yellow Box & or Pitchfork, I remain Bullish, targeting said areas. Should we lose the Pitchfork, I'd be flat on all leveraged positions, only holding my Long-Term Spot.
As always, practice solid Risk Management, and good luck trading!

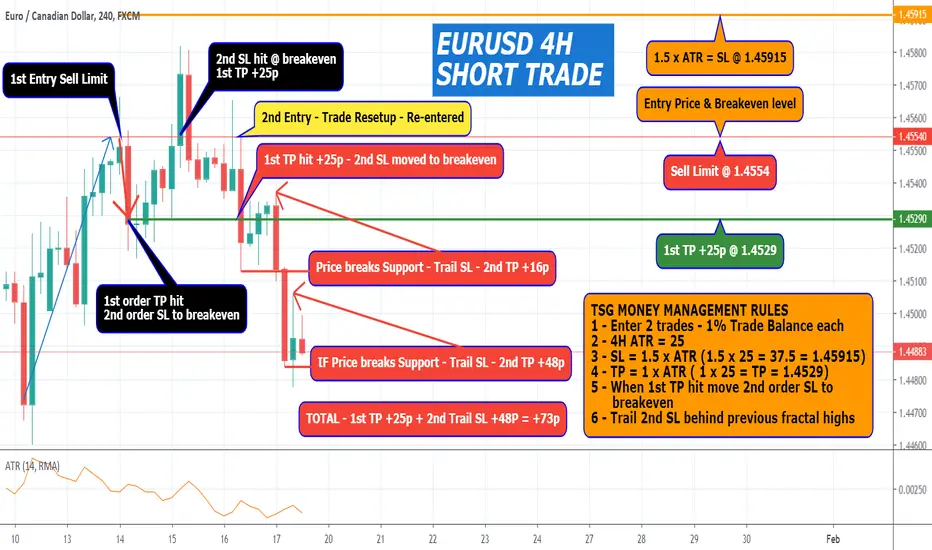
EURCAD 4H SHORT TRADETSG MONEY MANAGEMENT RULES.
1 - Enter 2 trades @ Sell Limit @ 1.4554 - 1% Trade Balance each.
2 - 4H ATR = 25.
3 - SL = 1.5 x ATR (1.5 x 25 = 37.5 = 1.45915) SL for both trades.
4 - TP = 1 x ATR ( 1 x 25 = TP = 1.4529) TP is for 1st order only, 2nd order no TP let profit run.
5 - When 1st TP hit move 2nd order SL to breakeven.
6 - Trail 2nd SL behind previous fractal highs.
Price moved up to retest a previous Sup/Res level.
Sell Limit made @ 1.4554 for 2 trades.
1st TP hit @ 1.4529, move 2nd trade SL to breakeven @ 1.4554.
Price had a bullish pullback and hit 2nd trade SL
Price stayed below the previous Sell Limit level of 1.4554.
Price re-setup short trade and re-entered another Sell Limit order @ 1.4554.
1st TP hit @ 1.4529, 2nd SL moved to breakeven.
Price created a new current fractal low support of 1.4513.
Moved Trail SL to current fractal high @ 1.4537.
Price created a 2nd current fractal low support at 1.4483.
If Price breaks that level then Trail SL to 1.4505 current fractal high.
Continue to trail SL if Price continues its bearish move.
This current EURCAD 4H Short trade was found by DACapitalTrading Jan 13th.
We added to this short trade our TSG money management trade plan.
JKS - time to take some profits?Since recommendation in November NYSE:JKS is +40%, and is now appraoching major resistance region. Therefore, it is wise to take some profits, with idea to reload after some period of consolidation.
Overall, chart is very constructive and healthy pullback with potential inverted H&S should build strength for much higher levels in the years to come.

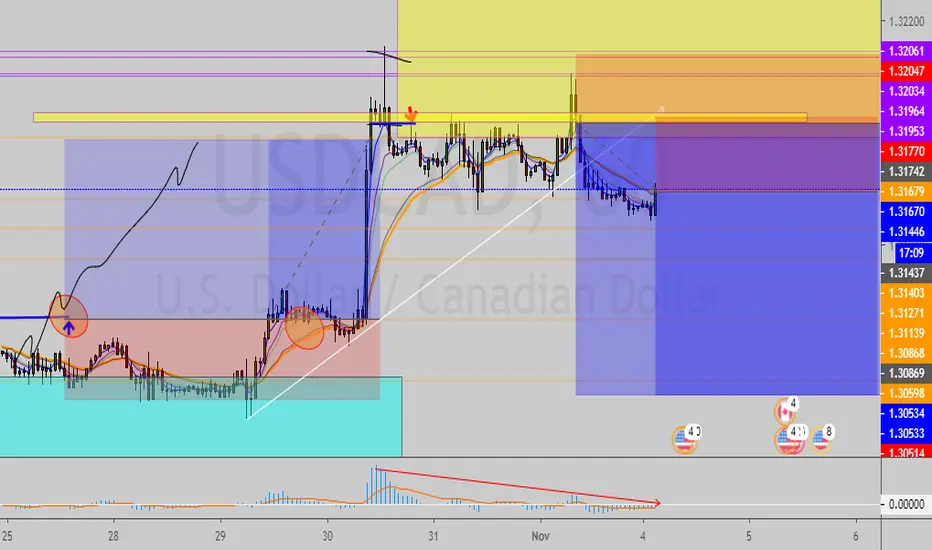
USDCAD Shortpodemos ver como el mercado nos marca una estructura alcista en 1h despues de salir de un box o acumulacion, tomamos el pullback y entramos a compra con gestion de riesgo 1-2

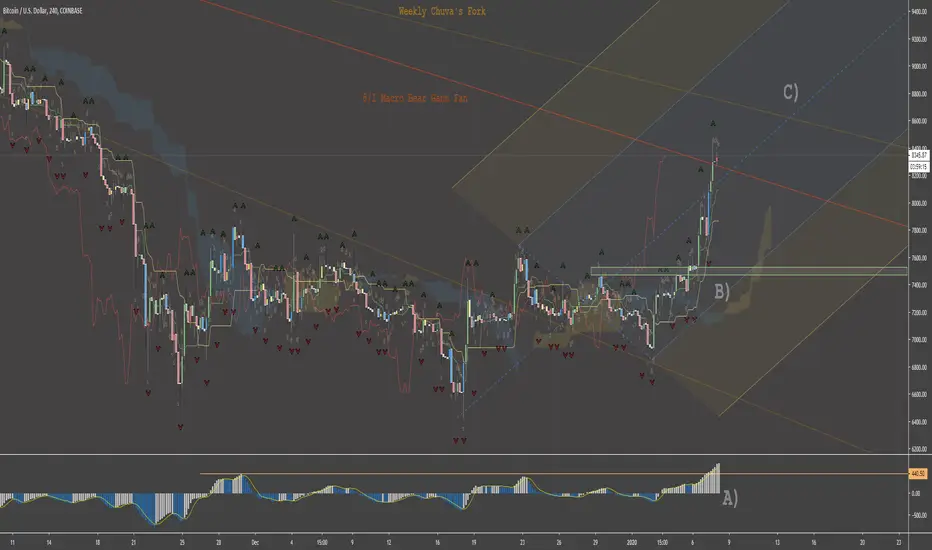
8.5 as anticipated, now what for BTC...Ok, you got me, $8470. In my previous post, Bull-still-not-giving-up/ , I set my sites on 8.5, which corresponded to the 8/1 Gann Fan coming down from 14k. A "Last Stand Level" for Bears, if you will. We tapped it (near), and got rejected (as anticipated). I hope you guys took some profit at/near these levels. No one ever went broke taking a profit!
A) Our Osci has put in a new high, leading me to believe we still have more Bull Juice in the tank.
B) The consolidation which led to this breakout, the green box, is Un-Tested. Should we correct, be it now, or at 8750, or 9.2 or <>...This would be an area I'd watch closely for an opportunity to Re-Enter Long (7.5ish).
C) This 8.6-8.8k still looks like a good area to stop and re-fuel (correct). I'd like to see us take 8.8 or so, then correct to 7.5 or 7.6, for another run at 10k+....but I digress, and we're just speculating now.
Ultimately, we're in the beginnings of a possible turnaround (mid term/macro scale). Breaking that 8/1 and holding (so far) is a very Bullish sign for BTC. Should BTC Break/Hold 8.6-8.8k region, the FOMO will likely start really ramping up. As always, practice strict risk management, enjoy yourself, and good luck trading.
7.5 or so is a clear Buy The Dip zone at this point. 8k may even be a possible opportunity, I'll be monitoring PA development closely.
TSM, Taiwan Semiconductor Manufactoring - Take ProftNYSE:TSM
How do we look for the classic patterns of technical analysis?
Every weekend we screen the markets of our interest and set alerts.
When do we enter our trades?
On our classic strategy, we enter on Friday, i.e. after the confirmation of the whole week.
In this case you can easily determine at first sight this head and shoulders of continuation.
So you think it is difficult to visually detect these patterns?
Good Trading to All!

IBM 3 DEC 2019 LONG Hello everyone, i see a bullish trend on the IBM, in the 1 chart.
Happy trading to all
TP1 134.40
TP2 135.85

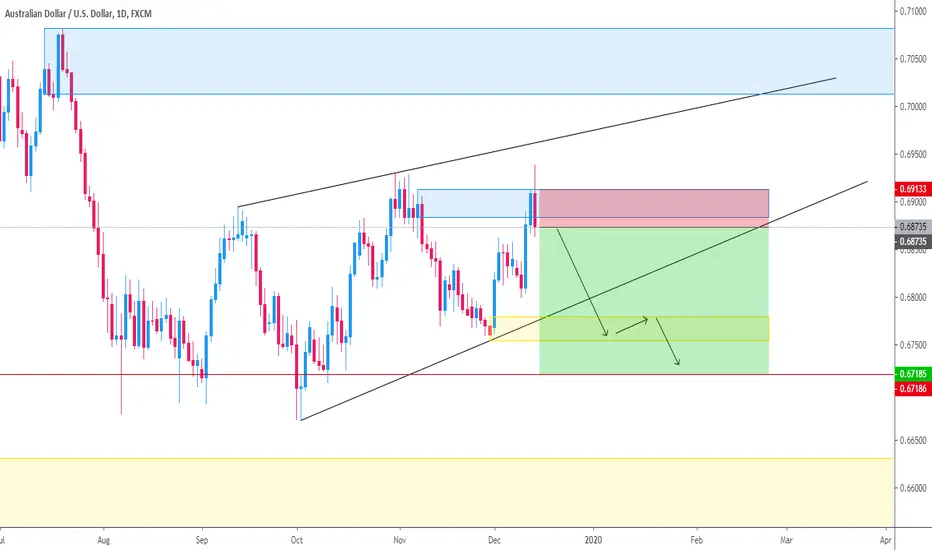
AUDUSD - trading analysis for 51. weekLast days of the year #2019 we can expect at this pair break the support trendline and move down with trend in which we can catch nice 240 pips
ATR MONEY MANAGEMENT FOR GBPAUD & EURUSD 4H & 1DUsing a set amount for SL and TP for different pairs and time frames is not effective money management.
Using the ATR for a specific pair and time frame lets you custom yur SL & TP for what that pair actually moves.
ATR 1D takes the last 14 candles and adds up then up together and then divides that figure by 14.
Now you have an average of how much that pair moves in a day.
GBPAUD 1D ATR moves 133 pips
GBPAUD 4H ATR moves 47 pips
EURUSD 1D ATR moves 42 pips
EURUSD 4H ATR moves 15,6 pips
This helps me determine a more accurate setting for my SL and TP for the pair I am trading and the time frame I am using.

GBPUSD | 1HIn this situation I see again a price drop where if it reaches TP1, SL can move up to 50% of TP1 and thus it will have a safe profit.
:)))))))))))
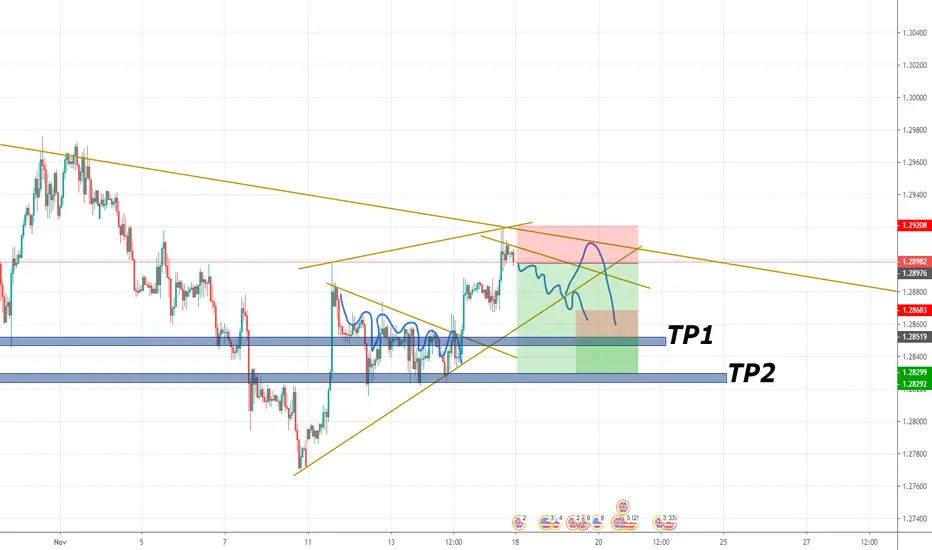
USDCAD SHORT TWING, SINGW & INTRADAY en las 2 entradas anteriores posteadas del USDCAD tomamos ganancia por un total de 300 pips ahora vemos como el precio llego a la zona marcada para buscar ventas en 4h y 1d y observamos que nos crea un patrón de doble techo junto con divergencia y confirmacion con fibonacci en temporalidad mayor, esperamos shift of momentum en 5M y tomamos una entrada a corto en swing, y la entrada en 1h la tomamos despues del doble techo y ahora esta dando reentrada al retesteo de la ema 20.
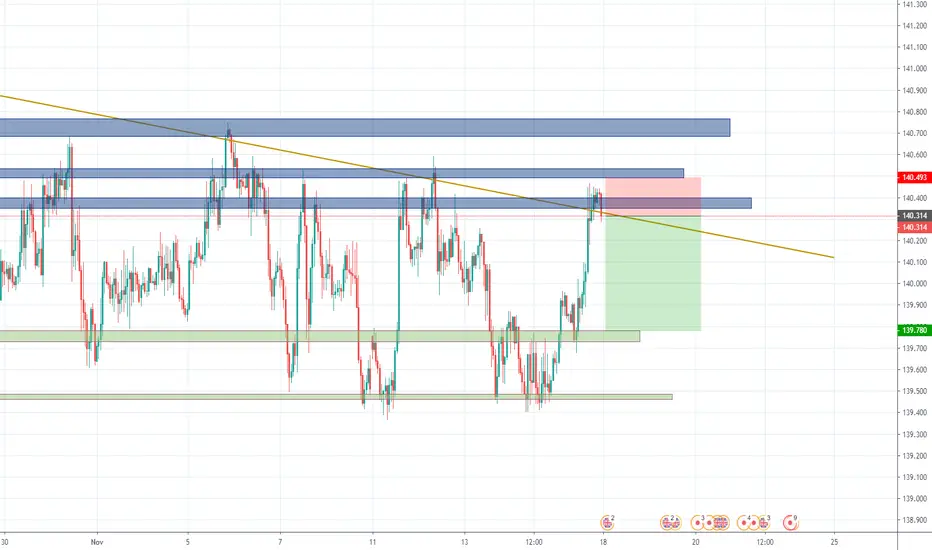
USDJPY CORTO TWIN, SWING y INTRADAYtomamos ganancia de las dos ultimas entradas publicadas en la idea anterior +120pips profit. tenemos una venta a swing abierta desde la semana pasada posteada en los comentarios y ahora el mercado nos esta dando una reentrada en 1h, vamos por 40pips de stoploss y 130 de takeprofit. Blessings
4H

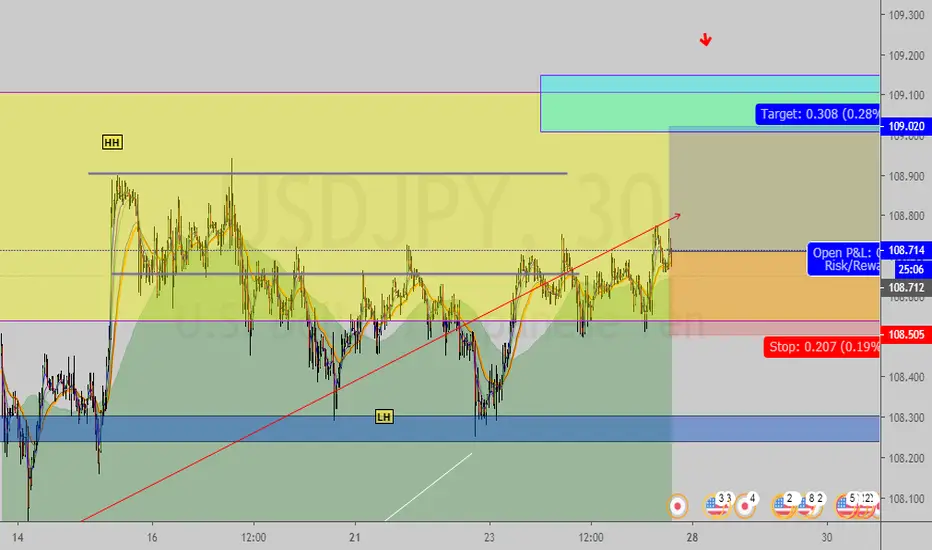
USDJPY LONG 30PIPSencontramos una pequeña entrada a compras mientras esperamos ventas en temporalidades mayores. ve a ver la explicacion del analisis en las ideas de formacion
Next Possible Move For XAUSD (GOLD)I see GOLD pushing up to 1510 which has some good resistance in that area.
Resistance trend line meets well with the 1510 resistance.
Good opportunity for the Bears to step in and send GOLD back to 1500 or lower.

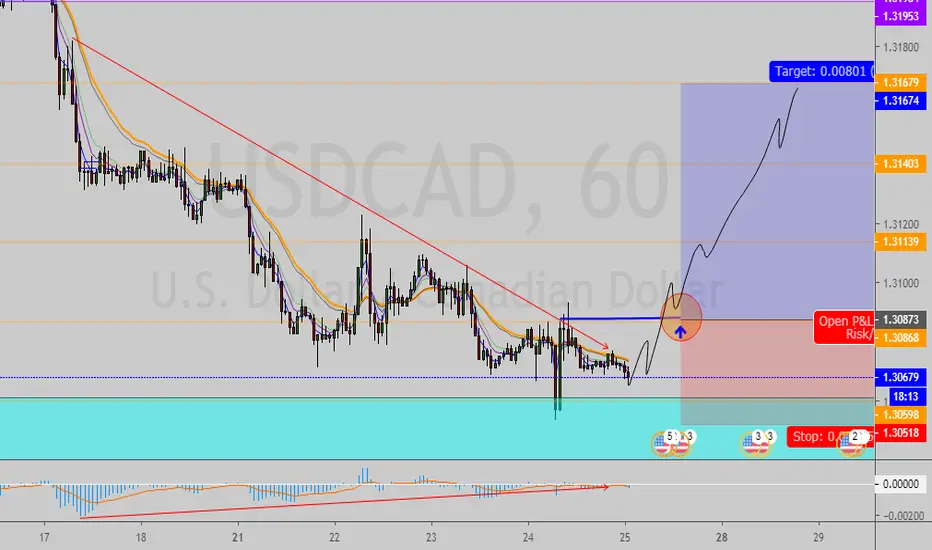
USDCAD LONG correcion bajistatomamos ganancia de 220 pips con la entrada de la anterior publicacion de USDCAD, ahora esperamos confirmacion para operar su respectivo retroceso, y vemos como ale llegar a la zona marcada como objetivo anterior, la tendencia se empieza a debilitar y observamos una divergencia en el macd desde temporalidad de 4H. espero que me rompa el alto mas bajo anterior en temporalidad de m15 o m5 y entro al retesteo despues de romper la estructura bajista asi como esta marcado en el grafico.
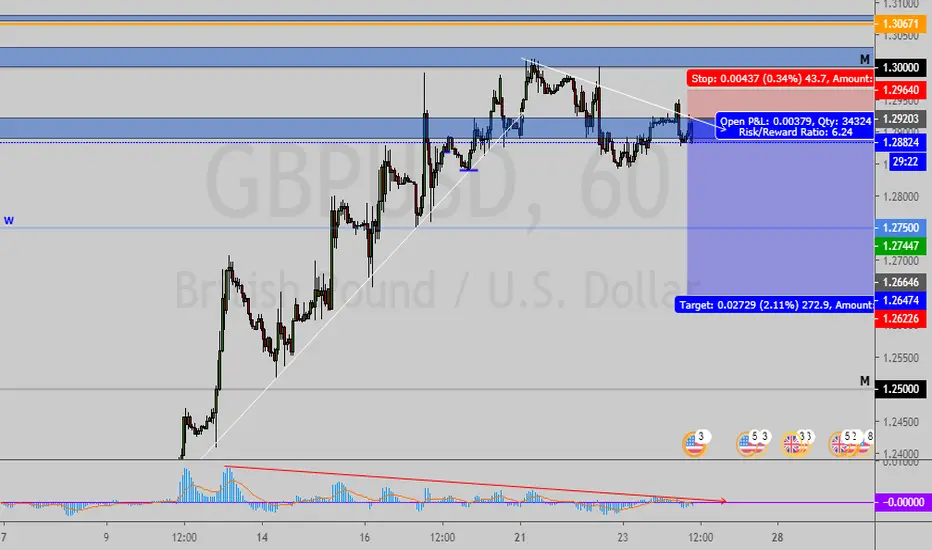
GPBUSD SHORTcansancio de estructura de mercado alcista, divergencia 4h y 1h. rompimiento de la estructura en temporalidad menor y entramos en el quiebre
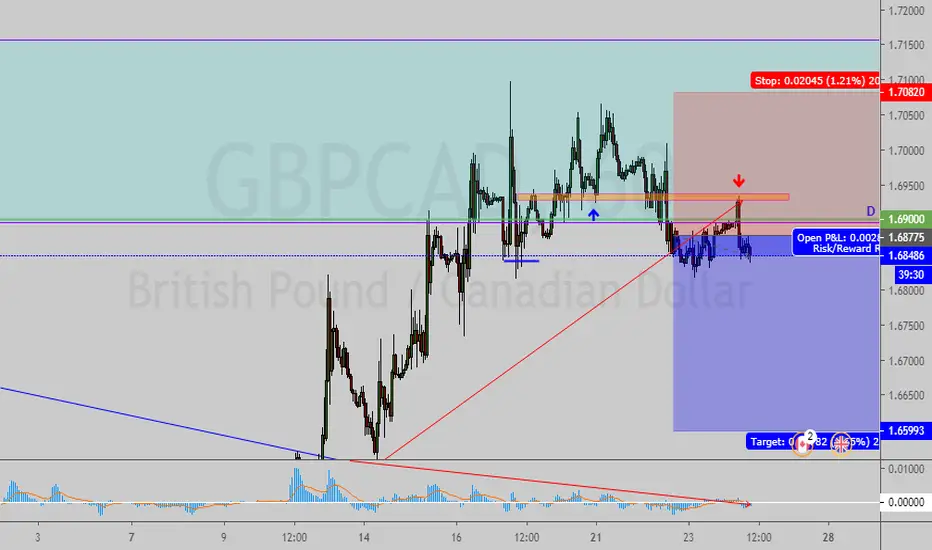
GBPCAD SHORTpodemos ver cansansio de la tendencia alcista, divergencia en 1h y 4h. descomponiendo el mercado observamos la ruptura de la estructura alcista y tomamos corto en el quiebre.
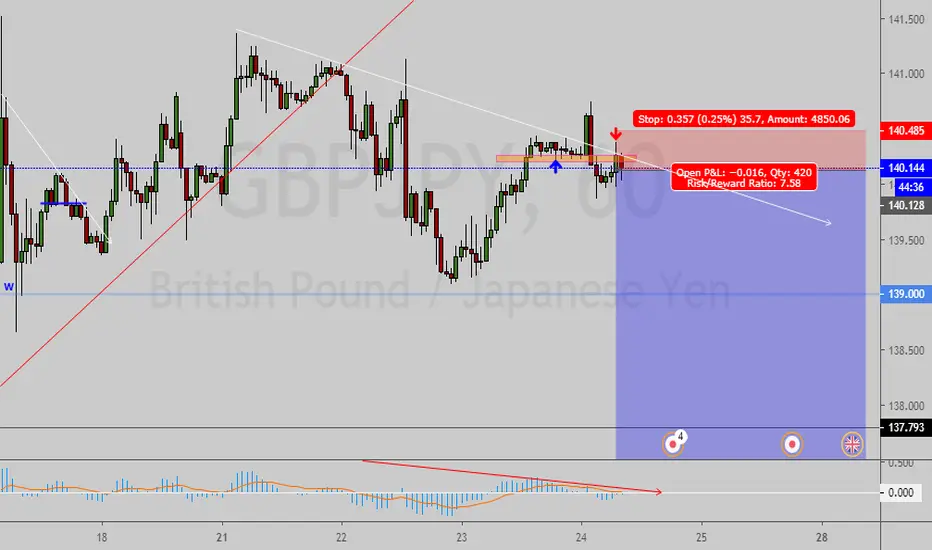
GBPJPY SHORTpodemos observar claramente cansancio del la tendencia alcista, divergencia en 4h y 1h, y en m15 y m15 confirmamos con shift of momentum en el rompimiento de la estructura alcista.
(M5 shif of momentum entry)
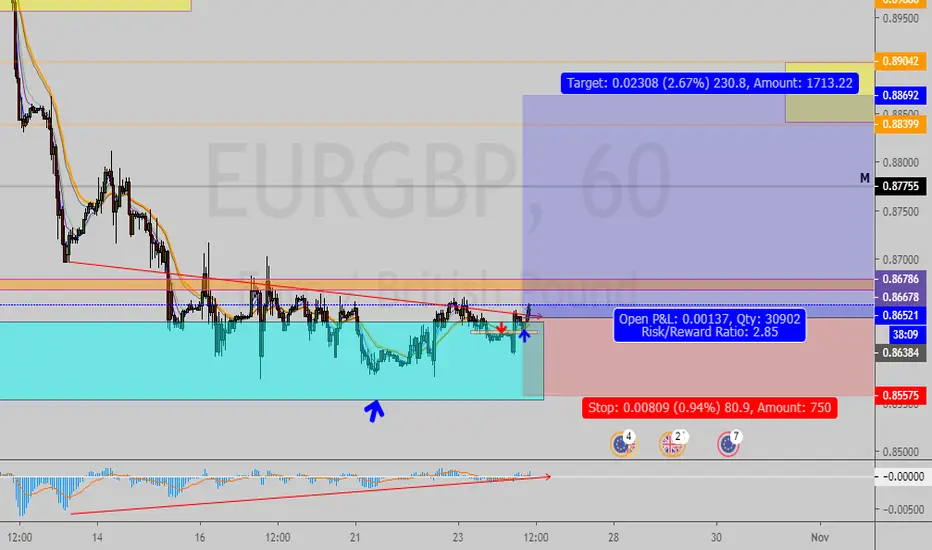
EURGBP LONGpodemos observar una clara divergencia en 4h y 1h, tanbien vemos como ya llego al objetivo diario y ahora busca un nuevo retroceso, vemos la consolidación, el cansansio de la tendencia bajista y el rompimiento de dicha estructura. tomamos entrada con (shif of momentum) en el quibre de estructura de 5min.
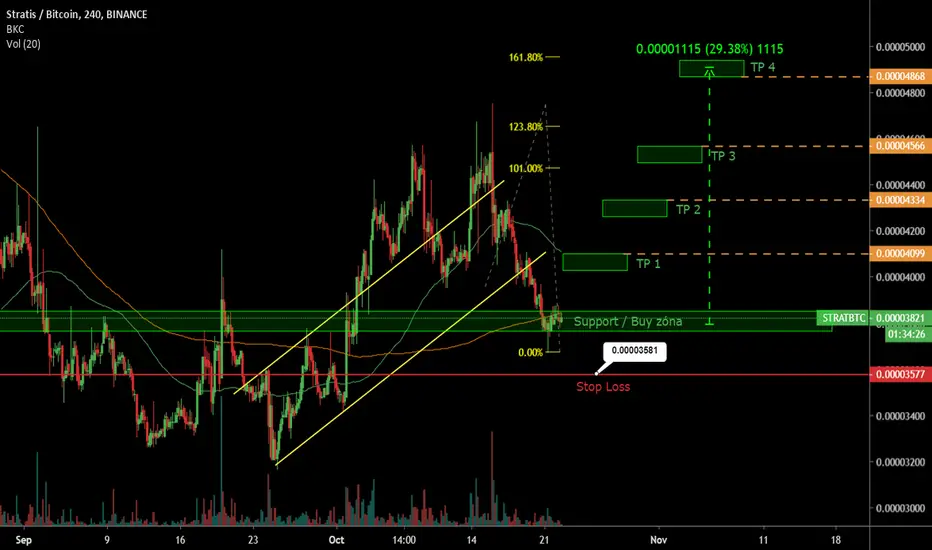
STRATBTC BullishSTRATIS is ending correcting structure. Right now is in Buy zone / Support so it is the best situation for perfect buy order ! :) I used resistance as following target. Stop Loss, Take Profits, Support, Buy zone, Resistance in chart ;)