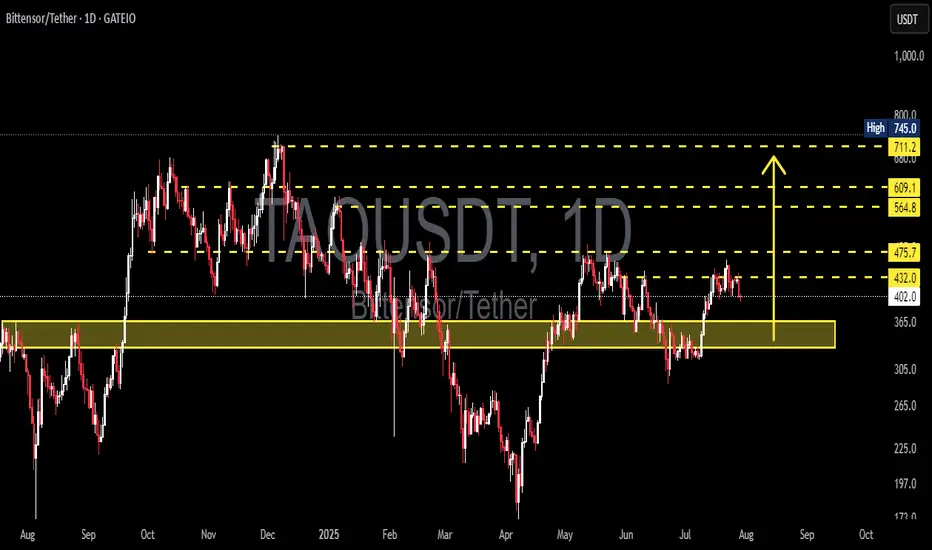
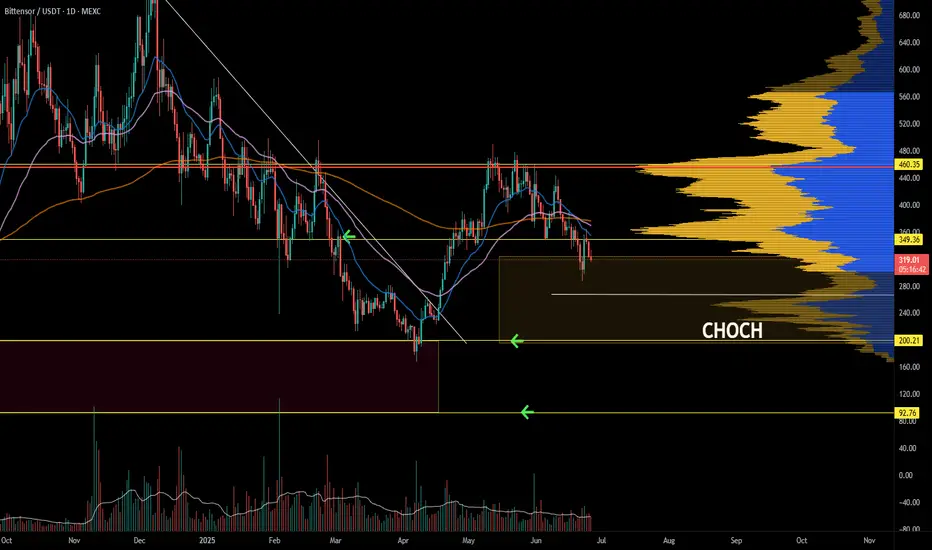
TAO/USDT: Price Likely to Retest Key Support Block 330–365 USDT?🟨 Key Zone: Yellow Support Block (330 – 365 USDT)
This zone has served as a major demand area since May 2025, acting as the base for the recent bullish move toward 475 USDT.
It represents a strong accumulation zone, where significant buying interest previously stepped in.
Given the current rejection from the 475 resistance, price is likely to revisit this block to test buyer interest and liquidity.
---
📉 Bearish Scenario: Breakdown Risk
After failing to break above 475.7 USDT, price shows signs of a short-term correction.
If bearish momentum continues:
🔽 A retest of the yellow support zone (330–365 USDT) is highly probable.
If this zone fails to hold:
📉 Next downside targets:
305 USDT – previous local low
265 USDT – next major demand level
A breakdown of the yellow block would invalidate the current bullish structure and open a new bearish leg.
---
📈 Bullish Scenario: Successful Retest and Bounce
If the price retests the yellow zone and forms a strong bullish reaction:
Confirmation signals:
Bullish reversal candles (hammer, bullish engulfing, etc.)
Increasing volume near the support zone
A successful retest could lead to:
✅ Continuation of the bullish trend
✅ Higher-low structure remains intact
Upside targets:
432 USDT – minor resistance
475.7 USDT – strong resistance zone
564.8, 609.1, and up to 711–745 USDT – extended targets
---
📌 Key Technical Levels:
Level Significance
330–365 USDT 🔲 Yellow Support Block / Demand Zone
432 USDT Minor Resistance / Previous Breakout
475.7 USDT Major Resistance (Recent Rejection)
564.8 USDT Mid-Term Resistance
609.1 USDT Next Key Resistance
711–745 USDT Long-Term Target / Supply Zone
305 USDT Support if Breakdown Happens
265 USDT Next Demand Zone Below
---
📊 Structure & Market Behavior:
No clear classic pattern (e.g., H&S or double bottom), but:
Current price is moving within a range-bound structure
Holding the 330–365 block would form a new higher low, strengthening the bullish outlook
Market is watching how price responds on retest of the yellow support
---
🧠 Notes for Traders:
Watch for volume and candle structure as price enters the 330–365 zone
This zone is a classic re-entry / reload area for institutional buyers
Conservative entry: Wait for bullish confirmation candle above 365
Aggressive entry: Ladder buys inside 330–365 with stop loss below 330
---
🏁 Conclusion:
TAO/USDT is undergoing a healthy pullback after rejection at 475.7 USDT. A retest of the yellow support zone (330–365 USDT) is highly likely. This area is crucial for the next move — either a bullish continuation with a strong bounce or a bearish breakdown signaling trend reversal.
#TAOUSDT #TAO #CryptoAnalysis #RetestSupport #DemandZone #BullishScenario #BearishScenario #AltcoinWatch #TechnicalAnalysis #PriceAction #TradingView #SupportAndResistance #GateIO #ReentryZone
TAO
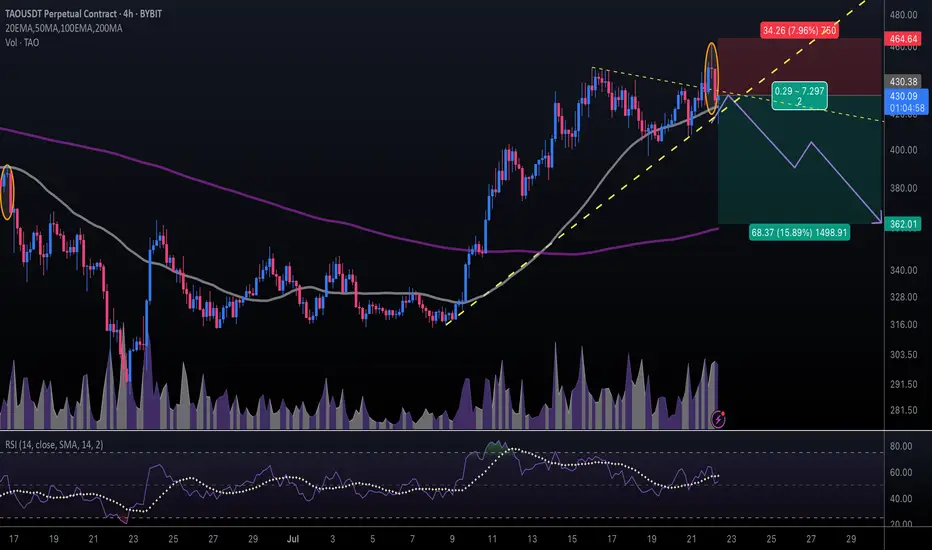
#TAOUSDT #4h (ByBit) Ascending trendline near breakdownBittensor printed an evening doji star deviation, a retracement down to 200 MA support seems next.
⚡️⚡️ #TAO/USDT ⚡️⚡️
Exchanges: ByBit USDT
Signal Type: Regular (Short)
Leverage: Isolated (5.0X)
Amount: 5.0%
Entry Targets:
1) 430.38
Take-Profit Targets:
1) 362.01
Stop Targets:
1) 464.64
Published By: @Zblaba
GETTEX:TAO BYBIT:TAOUSDT.P #4h #Bittensor #AI #DePIN bittensor.com
Risk/Reward= 1:2.0
Expected Profit= +79.4%
Possible Loss= -39.8%
Estimated Gaintime= 1 week
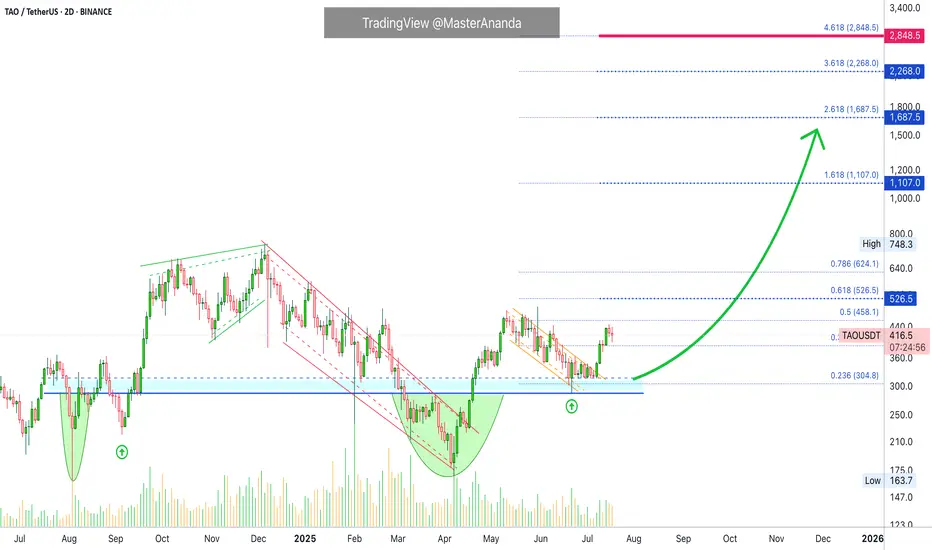
TAO's (Bittensor) True Potential Exposed · How About $3,000?Remember when I kept saying these are "conservative targets"? Why should we look for conservative targets when we know the market will do magic in the coming months? Why?
Let's focus more on realistic targets, optimistic targets, strong targets, good targets, successful targets; higher is better, less is not more.
We've been here many times before. I am happy and grateful to be able to count with your continued support. You can count with my analyses, great entry prices and timing. You can count with a unique market perspective 100% free of outside influences. I am not paid through USAID. 100% independent and everything you see is my mind, my soul, my heart and my spirit. It is my understanding of the market based on thousands of charts, thousands of publications, thousands of successful trades and more than a decade of experience. We are here to win and to trade. We trade to win, make no mistake.
Bittensor's (TAO) bottom is in, a long-term double-bottom; the beauty of TA.
A major low in August 2024. A new low in April 2025. The fact that these two happened at the same price is good news and it is already confirmed. Something as simple as the same level being hit twice helps us predict the future when it comes to the price of this, and others, trading pairs.
With the bottom in we can focus on growth. TAOUSDT is still early considering the bigger picture because the action is still happening below its May 2025 high. But conditions are good, very good I should say, because TAOUSDT is trading daily above EMA55, EMA89 and EMA233, a long-term moving average.
The break just happened days ago. If we are set to experience growth for 3-6 months, minimum, after this signal shows up, this opens the doors for prices much higher to what we've been considering in the past few months.
$1,100 is a good target but an easy hit. Only 30% higher compared to the last major high in December 2024.
$1,687 is the first strong resistance that TAO will face during its bull market bull-run. My bet is that it will break.
Going higher, we can see TAO trading at $2,268 later this year and even higher, just below 3K.
Now, this chart is very young so even while being optimistic we do not have enough data to project higher targets but there is no limit to how far-up a project can go during the price discovery phase. When we enter new all-time high territory and the final fifth (speculative) wave, all bets are off. You can aim for the moon or higher.
Namaste.
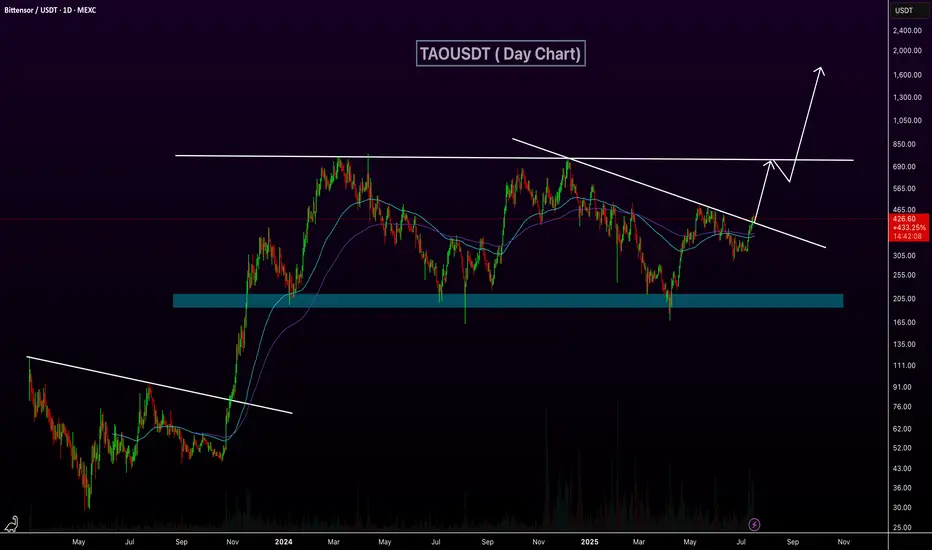
TAOUSDT Breaks Descending Trendline!BINANCE:TAOUSDT daily chart is showing a potential bullish breakout as price moves above a long-term descending trendline. This breakout, combined with support from the 100 and 200 EMAs, indicates growing upward momentum. If price holds above this trendline, the next key resistance lies around the $750 level. A successful breakout and retest could pave the way for a major rally toward $2,000. GETTEX:TAO
Regards
Hexa
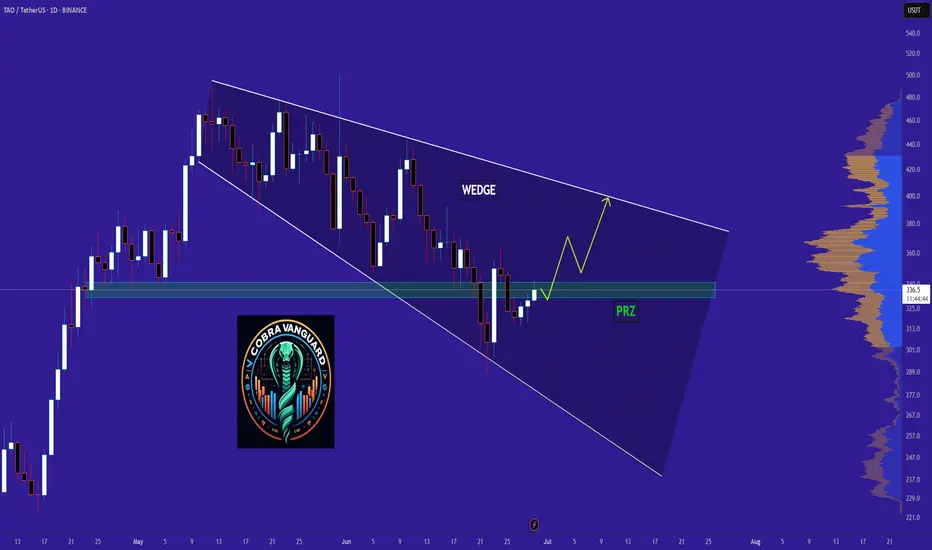
TAO It will grow soon...The TAO will increase $60 and reach to the top of the wedge in the coming days .
Best regards CobraVanguard.💚
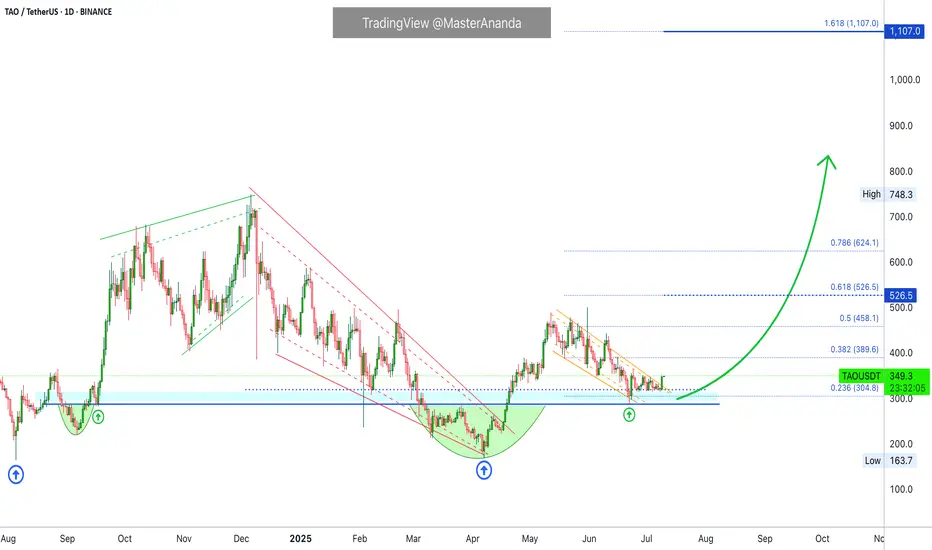
Bittensor Goes Bullish · $1,107 Price Target Within 6 MonthsHere is a very interesting piece of information. The same 22-June low worked as support back in September 2024. Needless to say, the test of this level propelled a major bullish phase. Conditions are similar now, not the same but similar. Bittensor is stronger now compared to late 2024, so we can expect the bullish wave that follows also to be stronger and thus a $1,107 price target mid- to long-term. Within 3 to 6 months.
Today we have a bullish breakout from the current structure with confirmation of long-term support and the higher low. TAOUSDT is now entering a new wave of growth. This is a long-term event, this wave should last all through 2025 and possibly beyond.
You can find additional details on the chart.
Leave a comment if you have any questions. Follow if you enjoy the content and would like to see more.
Namaste.
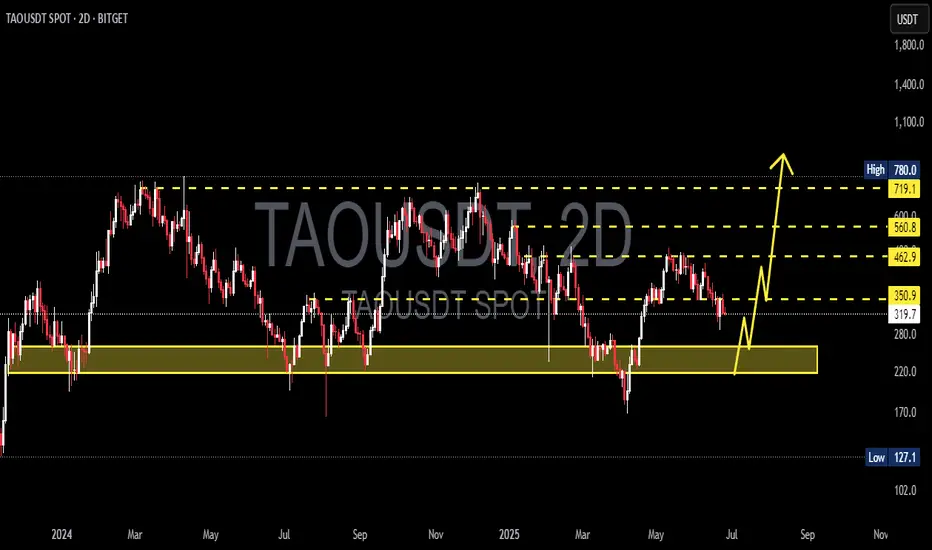
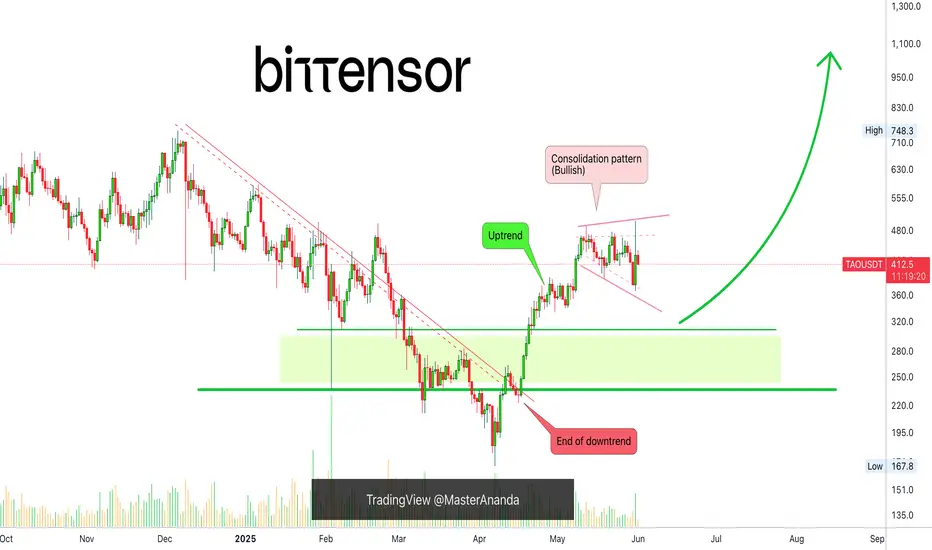
TAO/USDT Potential Reversal Zone – Major Bounce OpportunityTAO/USDT is currently testing a critical support zone (highlighted in yellow) between $220 – $280, which has historically acted as a strong accumulation area. The price has shown multiple reactions from this region throughout 2024 and 2025, signaling that bulls may be preparing for a reversal.
🔍 Key Technical Levels:
Major Support Zone: $220 – $280
Immediate Resistance Levels:
$350.9
$462.9
$560.8
$600
$719.1
Long-Term Resistance: $780 (local high)
🔄 Scenario: If TAO successfully holds this support zone, a bullish reversal could be triggered with a potential rally toward the $350 level first. A break and retest above this could open the door for a sustained move towards $560 and beyond. The bullish projection is illustrated with the yellow arrow path, showing a potential multi-stage rally through key Fibonacci and structural levels.
📉 Invalidation: A confirmed break below $220 would invalidate this bullish setup and could push TAO toward lower lows, potentially retesting $170 or even $127 support levels.
📌 Summary: TAO is approaching a historically strong support base. If the structure holds and volume supports the reversal, we could see a powerful leg up toward $560 and possibly $719 in the medium term. Risk management is essential, especially with volatility around macroeconomic events and Bitcoin price movements.
TAO looking for a bullish confirmation. TAO retracing for a confirmation low is bullish. The real concern is that this turns into a dead cat bounce and the price makes a LL. As long as the price stays above the previous low, as momentum and trend oscillators get oversold, the structure is intact.
Full TA: Link in the BIO
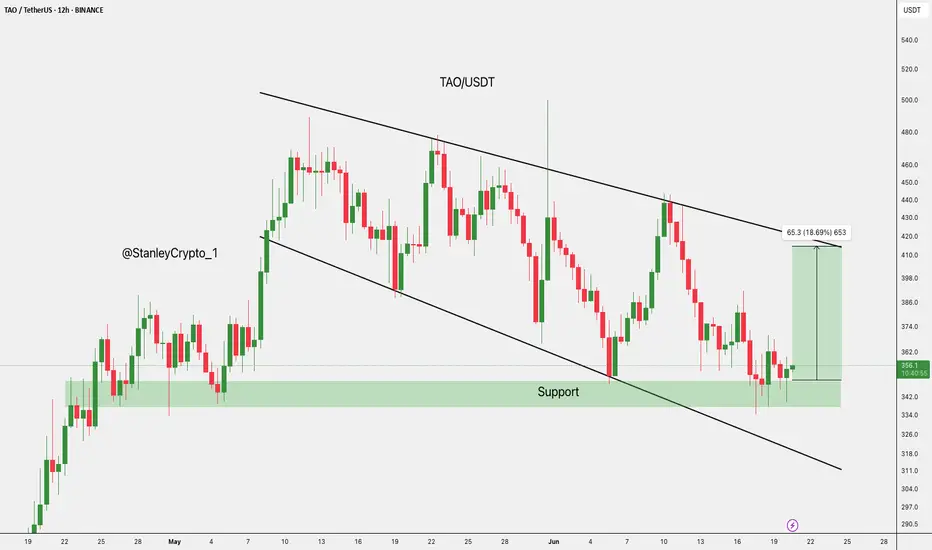
$TAO/USDT Eyes 18%$TAO/USDT is bouncing off a strong support zone around $340–$350.
It’s trading inside a descending channel and could target $420, an 18.60% potential move if support holds and momentum builds.
DYRO, NFA
TAOUSDT - This can't belast year, I had an experience with a trader and he said that this was an impossible move.
look at this move prnt.sc
it is similar:
- the growth was
- the sideways has started
- now a fall is needed
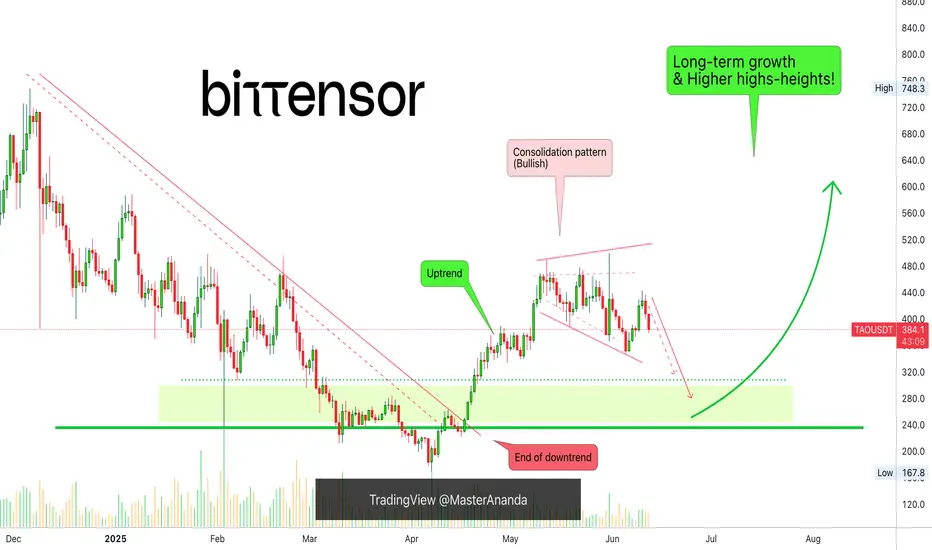
Bittensor Won't Go Much Lower (Long-Term Growth Explained)I am not concerned when looking at TAO (Bittensor) because I know that it won't go much lower and I also know, based on the chart, that it won't be bearish for much longer... And this is all great news.
Good... Good, good, good.
Good afternoon my fellow reader, I am happy to receive once more your undivided attention. It is my pleasure to receive your support.
Please, allow a minute of your time for me to read this chart.
It is the same pattern all over again, when the market is set to grow, it grows; but, long-term growth means months of prices moving higher and the market is never in a hurry to make you rich. So, it will grow but it takes time and time we have, time we want more, time we need but also we waste lots of time in things that are not productive, so let's use this time to plan for what will be coming next.
The moment is now, true. TAOUSDT and Crypto are bearish now and that's ok. You know why this is great news? Because being bearish now means that soon this phase will end. The market can only be bearish for so long. When it is bullish, at some point it turns bearish but, when it is bearish then again it moves back up.
TAOUSDT is already very close to strong support and this support will be the end of the bearish wave. Give or take one week and this will mark the start of the next bullish phase. Three months of sustained growth, another retrace and the more growth, on and on and on.
So, prepare now to be able to profit from the incoming bullish wave. The market will continue to fluctuate but with a strong bullish bias, and that is all that matters. We want to see our market grow because we will grow together with the market. If you are reading this, you are part of this market and that's very wise because Crypto is young.
Joining a new financial market in its early days... The opportunity of a lifetime and it was made for you to take.
Thanks a lot for your continued support.
It is truly appreciated.
Namaste.
Bittensor Hits A New High, Bullish Altcoins ExplainedYesterday Bittensor (TAOUSDT) hit a daily high. The highest price since early January. The highest price in five months.
This is a strong signal and reveals the overall conditions of the market.
There was a shakeout but not all pairs/projects are the same. Those pairs trading really high, BTCUSDT is a great example, move to produce a retrace or correction.
Those pairs coming out of strong market bottom in early April, continue with their newly developed uptrend and the shakeout is nothing more than short-term noise. The market will continue to grow long-term.
Each chart/pair/project needs to be considered individually.
Manual stop-loss should be preferred.
Some pairs went on to test their 7-April low. With a limit stop-loss order, this shakeout would produce a loss. With our system of a manual stop-loss, the next day prices are back to baseline. This is what the manual stop-loss system is for, to avoid becoming a victim of a stop-loss hunt event.
Here we have TAOUSDT moving higher and higher, slowly. The market moves in waves.
It is a rising trend; higher highs and higher lows. But, invariably, there will be retraces and corrections along the way. Prices can still drop lower before additional growth, anything goes. The market can fluctuate wildly but the end result will be a new all-time high when we reach the bull run phase.
It takes time. The whole cycle needs 6-8 months to fully develop. This is only the start. For TAOUSDT, this start produced a total of 200% growth in less than two months. This is really good, but there will be more. Buy and hold.
Namaste.
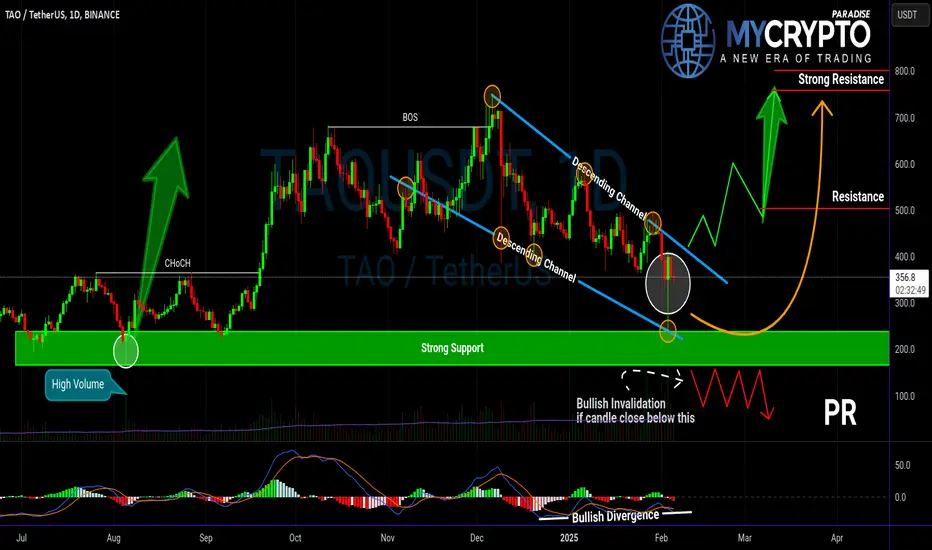
TAOUSDT at a Crucial Level – Breakout or Breakdown?Yello, Paradisers! Is TAOUSDT gearing up for a strong bounce, or is a deeper correction on the horizon? Let’s break it down.
💎TAOUSDT has completed a healthy retracement, forming a descending channel alongside a Dragon Butterfly candlestick pattern—both backed by high volume. Historically, when this pattern appeared with strong volume, we saw a solid upside move. This time, we also have a bullish divergence, adding confluence to the bullish case. However, to increase the probability of a breakout, we need to see price breaking above the descending channel with strong volume.
💎Now, what if price drops further or shows panic selling? In that case, we must wait for clear bullish confirmations before jumping in. Ideal signals include - Bullish I-CHoCH formation, W pattern or Inverse Head and Shoulders on lower timeframes. Any of these would significantly increase the probability of a strong bounce from the strong support zone.
💎 However, If price closes a candle below the strong support zone, it will invalidate our bullish outlook. If that happens, the best move is to stay patient and wait for better price action before considering any long positions.
🎖Patience is what separates pros from amateurs. If you want to make it in this game, trade smart, stay disciplined, and always wait for high-probability setups. The market will always test your emotions—don’t let it break your strategy.
MyCryptoParadise
iFeel the success🌴
TAO ROADMAPTo me the view is pretty clear.
* The purpose of my graphic drawings is purely educational.
* What i write here is not an investment advice. Please do your own research before investing in any asset.
* Never take my personal opinions as investment advice, you may lose your money.

TAO BULLISH SETUPTAOUSDT on a major hourly support, where we are looking for a possible short term reversal for a high accuracy opportunity.

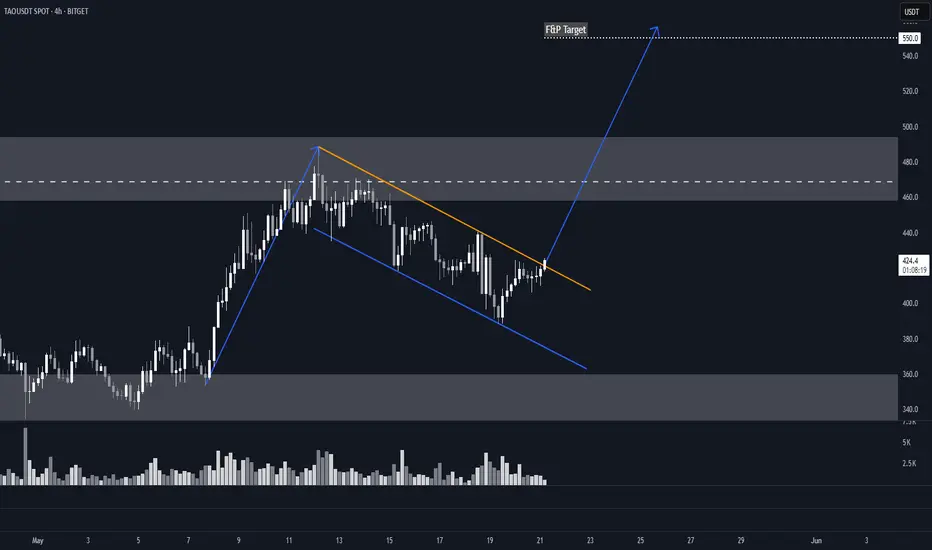
TAO Potential 4H Flag & PoleBITGET:TAOUSDT has printed a clean impulsive move followed by a descending consolidation channel — resembling a bull flag or falling channel continuation.
The retracement went deeper than usual (down to ~$388, ~75% of the pole), which softens the textbook bull flag narrative — but doesn't invalidate the setup.
Key Elements
• Pole: ~$354 → ~$489
• Flag Low: ~$388
• Retracement: ~75% of the pole — a deep pullback, but still valid.
• Target: ~$550 — measured from breakout point, equal to the pole’s height projected upward.
Keep in mind that $460-$490 is a key S/R and the midline of a longer-term rectangle, so it could offer resistance. See here .
Volume Note
No clear volume contraction during consolidation, which weakens the classic flag interpretation. That said, volume could still confirm strength if it expands on a breakout.
Target Logic
Measured move from pole height points to ~$550 — only in play if a full breakout with strong volume follows.
#TAO/USDT
#TAO
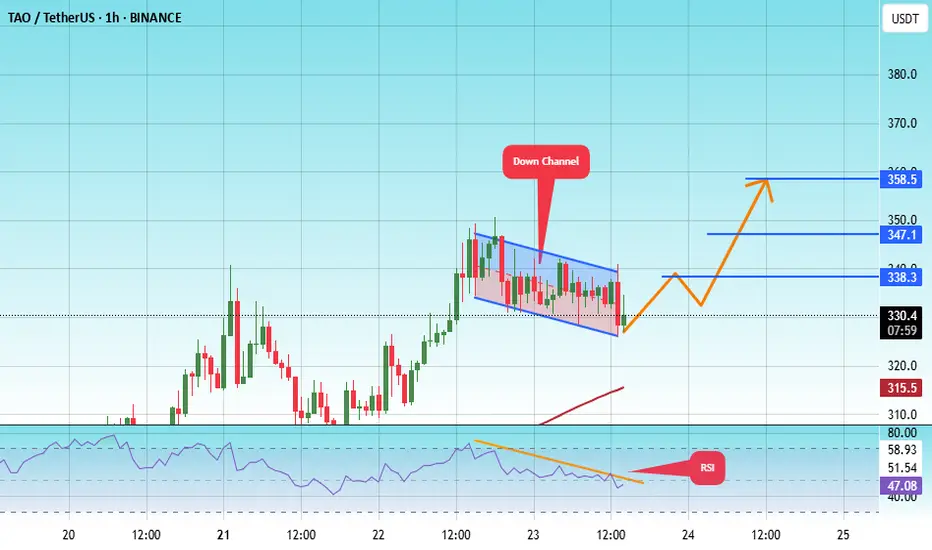
The price is moving within a descending channel on the 1-hour frame, adhering well to it, and is heading for a strong breakout and retest.
We are seeing a bounce from the lower boundary of the descending channel, this support is at 326.
We have a downtrend on the RSI indicator that is about to be broken and retested, which supports the upward trend.
We are looking for stability above the 100 moving average.
Entry price: 330
First target: 338
Second target: 347
Third target: 358
Bittensor Turns Bullish Moving Averages (Soon Above $1,100)Here Bittensor (TAOUSDT) can be seen trading safely above EMA55/89, as well as two long-term moving averages (EMA233/377):
This is a bullish bias fully confirmed.
This confirmed bullish bias will put TAOUSDT above $1,100 within 3 months, most likely. But this isn't all, there is room for additional growth. See this chart:
Overall, trading volume is good and this pair has been pretty active lately.
After the last advance, the action is happening at resistance and stays there, no significant retrace is present on the chart. When a project is weak, a challenge of resistance immediately sends prices lower. When the market is bearish, a challenge of resistance leads to a crash.
Let me give you some examples. Notice the peak March 2024, the market was bearish and the drop that follows is fast and strong, also long-term. The same is true for October and December 2024. When the market is bearish, reaching resistance leads to a very strong bearish candle.
Currently, resistance was hit 25-April but the market went sideways rather than crashing, and, yesterday, a full green candle just to keep the action as close to resistance as possible. The more a resistance level is challenged, the weaker it becomes.
» Bittensor is good, TAO is good and ready to grow. It will grow long-term for months. Up and up, more and more; over and over, again and again.
Namaste.

TAO/USDT – Long Setup ActivatedA potential bottom might be in place here.
🔍 Key confluences:
– Strong CVD rebound (spot + futures)
– Funding rate turning positive
– Top traders ratio shifting bullish (smart money buying the dip)
– Open Interest stabilizing after a clean flush
– And above all: my Scalp Cloud Signal just fired a bullish confirmation ✅
🎯 Targeting a short-term move to the 365–373 zone.
SL clearly defined below the local sweep.
💡 Tool used: Scalp Cloud Signal by The Degen Company
— Precision tool for scalping and micro trend shifts.

Can we be optimistic that this will come true?( road to $350 )I might be wrong and this might never happen, but it might come true From a technical perspective!!!
Give me some energy !!
✨We spend hours finding potential opportunities and writing useful ideas, we would be happy if you support us.
Best regards CobraVanguard.💚
_ _ _ _ __ _ _ _ _ _ _ _ _ _ _ _ _ _ _ _ _ _ _ _ _ _ _ _ _ _ _ _
✅Thank you, and for more ideas, hit ❤️Like❤️ and 🌟Follow🌟!
⚠️Things can change...
The markets are always changing and even with all these signals, the market changes tend to be strong and fast!!

TAO double bottom TAO / USDT
Potential double bottom in HTF
looks like it will go to supply zone in my chart
After that if breakout happens
it will continue fly to the target of this pattern 🎯
Keep following this chart

Bearish Head and Shoulders Pattern🚨 GETTEX:TAO
Forms Bearish Head and Shoulders Pattern 🚨
GETTEX:TAO
has formed a bearish head and shoulders pattern, which typically indicates a potential reversal to a bearish trend. However, for the bullish trend to continue, GETTEX:TAO
needs to break out above the significant red resistance zone.
📈 Technical Overview:
Pattern: Bearish Head and Shoulders
Resistance Zone:
Bullish Continuation: A breakout above this red resistance zone is crucial for the continuation of the bullish trend.
.

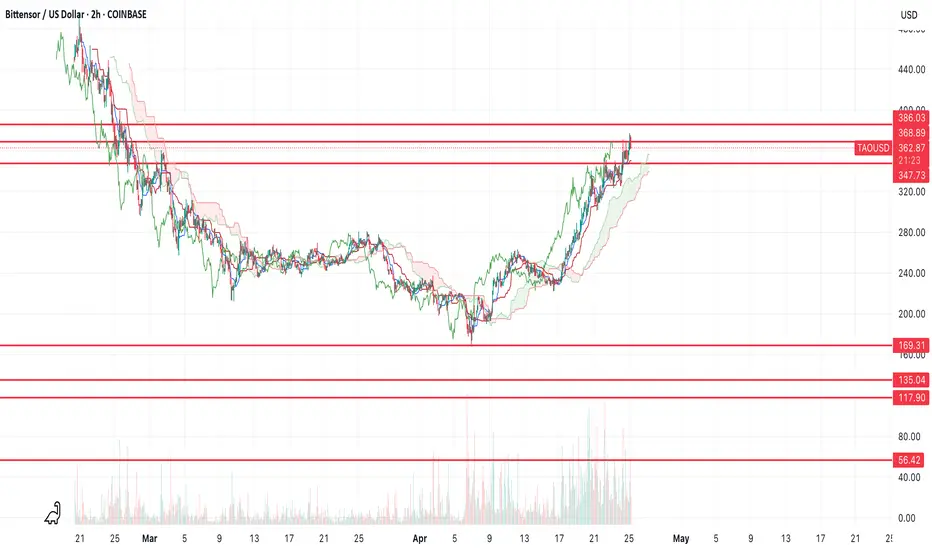
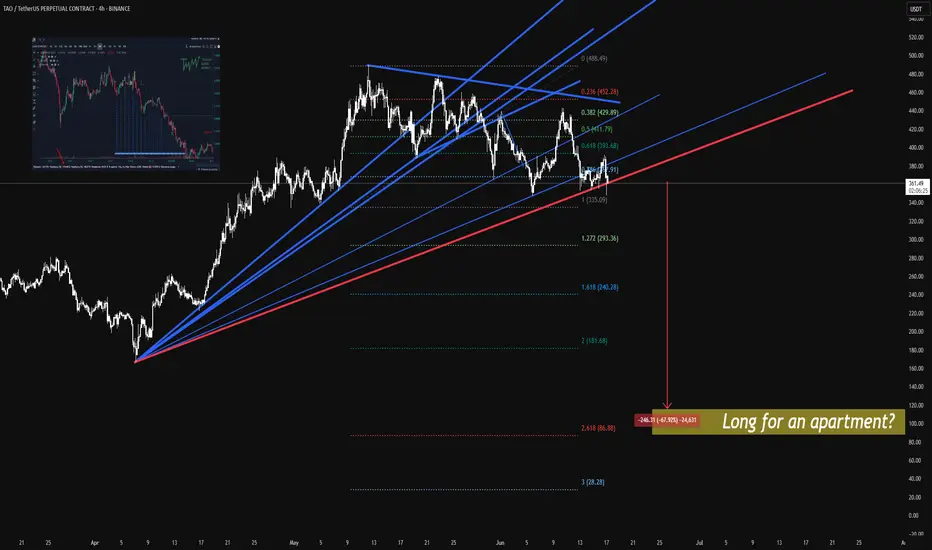
$TAO back to the lows at sub $200 (or lower)Tao looks like it's topping here, I originally thought we'd stop at $247, but price has gone a little bit further. There's more confluence in resistance at this level and one more level above, but I think gains are limited here.
I think it's likely that from here we correct back down to the lows and break them. The most likely target is the $117-135 levels. However, won't rule out the possibility that we find support at the previous low, or that we potentially go lower all the way down to $56.
Let's see how it plays out over the coming weeks.