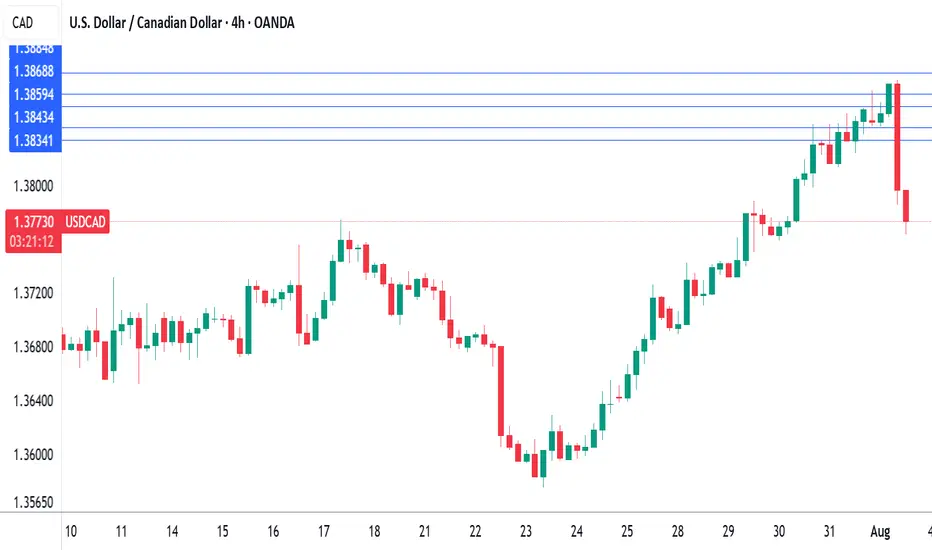
Canada's GDP contracts, US nonfarm payrolls misses forecastThe Canadian dollar continues to lose ground against its US counterpart and is trading at two-month lows. In the European session, the Canadian dollar is trading at 1.3875, down 0.13% on the day. USD/CAD has risen for six straight days, climbing 1.9% during that time.
US nonfarm payrolls for July were softer than expected at 73 thousand, compared to the forecast of 110 thousand. The June report was revised sharply downwards to 14 thousand from an initial 147 thousand.
Canada's GDP posted a small decline of 0.1% m/m in May, matching the market estimate. This followed an identical reading in April, as the economy is essentially treading water. A drop in retail trade was a significant factor in the weak GDP reading, particularly in motor vehicles and parts.
The decline in GDP in April and May can be squarely blamed on the trade war with the US, which has put a chill in economic activity. The markets are expecting a slight improvement in June, with an estimate of a 0.1% gain.
The Bank of Canada held the benchmark rate at 2.75% on Thursday for a third consecutive meeting. The rate statement noted that US trade policy remains "unpredictable" and Governor Macklem reiterated this at his press conference, saying that "some level of uncertainty will continue" until the US and Canada reach a trade agreement.
Meanwhile, the trade war between the two sides is heating up. President Trump announced on Thursday that the US was slapping 35% tariffs on Canadian products, effective Aug. 1. The new tariff will not apply to goods covered under the US-Mexico-Canada Agreement.
Canada's Prime Minister Mark Carney said he was "disappointed" with the US decision and vowed that "Canadians will be our own best customer". These are brave words, but Carney will be under pressure to reach a deal with the US, as 75% of Canadian exports are shipped to the US and Canada can ill-afford a protracted trade war with its giant southern neighbor.
Tariffs
What a turnaround on copper futuresManipulation? Smells like it, but of course, this is just the market we are currently living in.
Let's dig in.
MARKETSCOM:COPPER
COMEX:HG1!
Let us know what you think in the comments below.
Thank you.
75.2% of retail investor accounts lose money when trading CFDs with this provider. You should consider whether you understand how CFDs work and whether you can afford to take the high risk of losing your money. Past performance is not necessarily indicative of future results. The value of investments may fall as well as rise and the investor may not get back the amount initially invested. This content is not intended for nor applicable to residents of the UK. Cryptocurrency CFDs and spread bets are restricted in the UK for all retail clients.

USDCHF Signals Wave 3 With Double Bottom!OANDA:USDCHF has not only formed a Double Bottom Pattern but also may be generating a potential Elliot Impulse Wave!
Bulls are giving the April & June Lows of .8038 - .8088, another go for a second time today after surpassing the first attempted High created July 17th to break above the level.
So far Price today has broken above July 17th Highs and if Bulls are able to hold this level, this would Confirm:
1) A Breakout of the Double Bottom
2) Wave 3 continuing the Impulse Wave in the Elliot Wave Theory!
The Higher Low @ .79106 created on July 25th, broke the downtrend structure as a 78.6% retracement of the Lower Low @ .78719 created July 1st which was a new 14 Year Low, finishing Wave 2 and initiating Wave 3 of the Impulse Wave.
The Extension of Wave 3 typically will end at the 1.236% or 1.618% level which gives us 2 potential Price Targets to start:
Price Target 1) .81479 - 1.236%
Price Target 2) .82213 - 1.618%
Once Wave 3 has ended, we will look for opportunities at the Wave 4 - Wave 5 juncture!

Why Are Markets Rising Despite the Tariffs?Because of the
1) Set timeline on finalizing the tariff rates and
2) The ongoing negotiations,
They aimed at striking a balanced deal between the U.S. and its trading partners.
The Liberation Day tariffs were announced on 2nd April, and markets initially crashed in response. However, just seven days later, on 9th April, the U.S. postponed the higher tariff increases for most countries by 90 days. Since then, markets have rebounded and even broken above their all-time highs set in December last year.
Now that the dust is settling with the expiration of timeline and ongoing negotiations, the big question is:
Where will the markets head next?
Mirco Nasdaq Futures and Options
Ticker: MNQ
Minimum fluctuation:
0.25 index points = $0.50
Disclaimer:
• What presented here is not a recommendation, please consult your licensed broker.
• Our mission is to create lateral thinking skills for every investor and trader, knowing when to take a calculated risk with market uncertainty and a bolder risk when opportunity arises.
CME Real-time Market Data help identify trading set-ups in real-time and express my market views. If you have futures in your trading portfolio, you can check out on CME Group data plans available that suit your trading needs tradingview.sweetlogin.com

Countdown to Powell’s rate decision: What to watch WednesdayFederal Reserve Chair Jerome Powell is under mounting pressure from President Donald Trump to begin cutting interest rates.
Markets and analysts overwhelmingly expect the Fed to hold rates steady this Wednesday.
But what if the political heat is becoming too much to bear, and Powell and the Fed board advocate for a cut this week? Some Fed governors, Chris Waller and Michelle Bowman , have already signaled support for an early cut.
FX pairs to watch
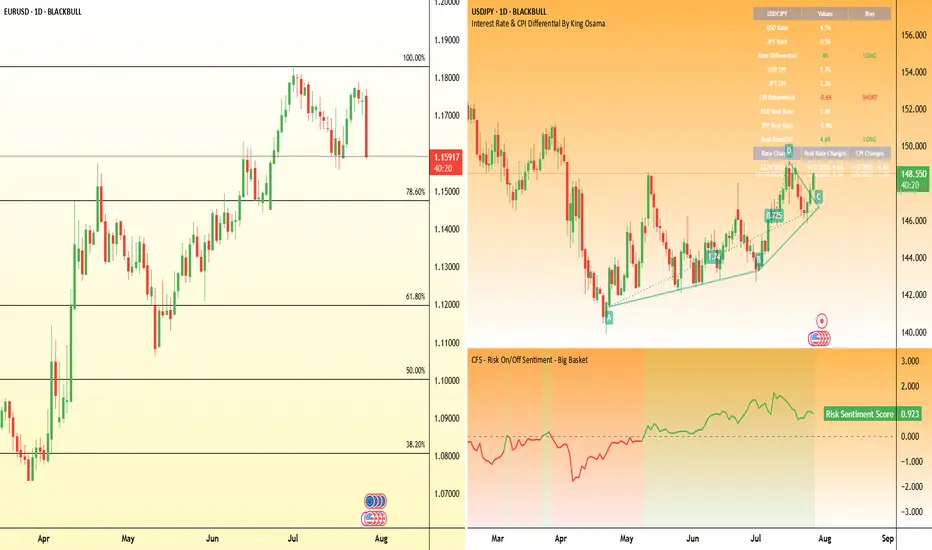
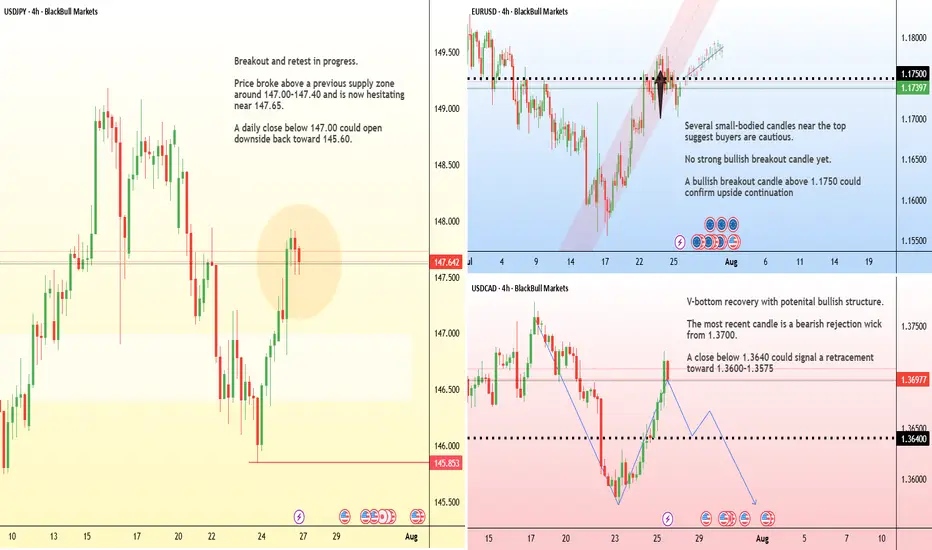
USD/JPY:
This pair remains highly sensitive to yield differentials and broader risk sentiment. However, any hawkish resistance or emphasis on data dependency may keep the pair supported, especially if risk appetite holds.
EUR/USD:
The euro has shown relative strength in recent sessions, but the pair has been hit by the announcement of the trade deal struck between the EU and US. If the Fed clearly signals it's not ready to ease, the USD could regain even ground.
Australian dollar down, eyes US GDP, Australian CPIThe Australian dollar is down for a third straight trading day. In the North American session, the US dollar has posted gains against most of the major currencies, including the Aussie. The greenback received a boost after the US and the EU reached a framework trade agreement after protracted negotiations.
The data calendar is bare on Monday, with no events out of the US or Australia. Things get very busy on Wednesday, with Australian inflation, US GDP and the Federal Reserve rate decision.
Even with no US releases, the US dollar has posted gains against most of the major currencies, including the Aussie. The greenback received a boost after the US and the EU reached a framework trade agreement after protracted negotiations.
President Trump had threatened to impose 30% tariffs on European goods if a deal was not reached by Aug. 1. With the deal, a nasty trade war between the world's two largest economies has been avoided and the US will tariff most EU products at 15%.
The deal with the EU comes on the heels of a similar agreement with Japan, bringing a sigh of relief from the financial markets that have been worried about the economic fallout from Trump's tariff policy. The agreements remove a great deal of uncertainty and investors are hopeful that the US and Chinese negotiators will wrap up their talks with an agreement in hand.
The Federal Reserve meets on Wednesday and is virtually certain to maintain interest rates for a fifth straight meeting. It will be interesting to see if President Trump, who has been sharply critical of Fed policy, reacts to the decision. The money markets are expecting at least one cut before the end of the year, with the money markets pricing in a 61% likelihood a cut in September, according to FedWatch's CME.

Markets face a PACKED schedule this weekThe tariff truce between the U.S. and several major trading partners is set to expire on August 1 . A deal with Japan has already been reached, but talks with the EU, Canada, and Mexico remain active.
In monetary policy, the Federal Reserve is widely expected to hold rates steady at 4.5% during its midweek meeting .
Across the border, the Bank of Canada is also expected to leave its interest rate unchanged at 2.75% . After cutting rates twice earlier this year, the BoC is seen as entering a wait-and-see phase.
In Asia, the Bank of Japan will announce its decision on Wednesday . While the BoJ isn’t expected to hike this month, recent U.S.–Japan trade progress has opened the door for policy tightening later this year.
Finally, the week concludes with the U.S. Non-Farm Payrolls report on Friday. Economists expect job gains of around 110,000 in July, down from 147,000 in June.
ECB holds rates as expected, Euro steadyThe euro is showing limited movement on Thursday. In the North American session, EUR/USD is trading at 1.1763, down 0.03% on the day. Earlier, the euro climbed to a high of 1.1788, its highest level since July 7.
The European Central Bank's decision to maintain the key deposit rate at 2.0% was significant but not a surprise. With the hold, the ECB ended a streak of lowering rates at seven consecutive meetings. The ECB has been aggressive, chopping 250 basis points in just over a year.
The ECB statement said that inflation was falling in line with the Bank's forecasts and that future rate decisions would be data dependent. President Lagarde has said that the easing cycle is almost down, but the markets are expecting at least one more rate cut before the end of the year.
The European Union and the United States are locked in negotiations over tariffs, with hopes that an agreement can be reached, on the heels of the US-Japan deal earlier this week. US President Trump has threatened to hit the EU with 30% tariffs if a deal is not made by August 1, but there are signals that the sides will agree to 15% tariffs on European imports, as was the case in the US-Japan agreement.
If an agreement is reached, it will greatly reduce the uncertainty around tariffs and will make it easier for the ECB to lower rates and make more accurate forecasts for inflation and growth.
In the US, Services PMI rose to 55.2 in July, up from 52.9 in June and above the market estimate of 53.0. This pointed to strong expansion and marked the fastest pace of growth in seven months. Manufacturing headed the opposite direction, falling from 52.6 in June, a 37-month high, to 49.5. This was the first contraction since December, with new orders and employment falling.

Tariffs incoming...July 23: Markets are booming.
August 1st: Tariffs.
I'm just saying, it might be a nice discount...
#market #finance #tariff #trump #crypto #forex #stocks #economy #trading
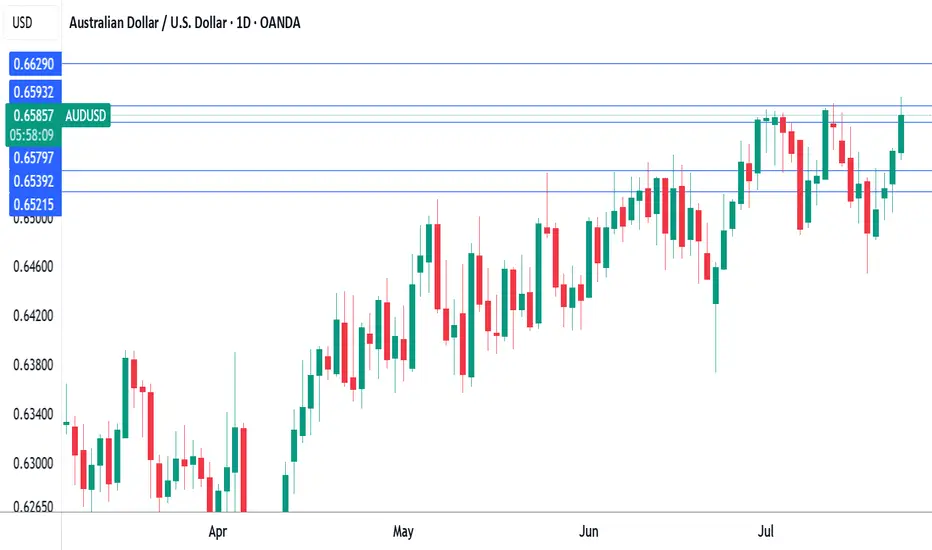
Australian dollar hits eight-month high on risk-on moodThe Australian dollar has rallied for a fourth sucessive day. In the North American session, AUD/USD is trading at 0.6588, up 0.50% on the day. The red-hot Aussie has jumped 1.6% since Thursday and hit a daily high of 0.6600 earlier, its highest level since Nov. 2024.
The financial markets are in a risk-on mood today, buoyed by the announcement that the US and Japan have reached a trade agreement. Under the deal, the US will impose 15% tariffs on Japanese products, including automobiles. As well, Japan will invest some $550 billion into the US.
Global stock markets are higher and the Australian dollar, a gauge of risk appetite, has climbed to an eight-month high.
Investors also reacted positively today to reports that negotiations between the US and China were speeding up and the US could grant an extension of the August 12 deadline to reach an agreement. The latest positive developments on the tariff front have raised hopes that the US will also sign trade deals with the European Union and South Korea.
The White House continues to put pressure on the Federal Reserve. Earlier this week, Treasury Scott Bessent called for a thorough review of the Federal Reserve. Bessent echoed President Trump's calls for the Fed to lower interest rates.
Fed Chair Jerome Powell hasn't shown any signs of plans to cut rates and has fired back that the uncertainty over Trump's trade policy has forced the Fed to adopt a wait-and-see policy. The Fed is widely expected to hold rates at the July 30 meeting but there is a 58% likelihood of a rate cut in September, according to CME's FedWatch.
AUD/USD has pushed above resistance at 0.6579 and tested resistance at 0.6593 earlier. Next, there is resistance at 0.6629
0.6539 and 0.6521 are the next support levels
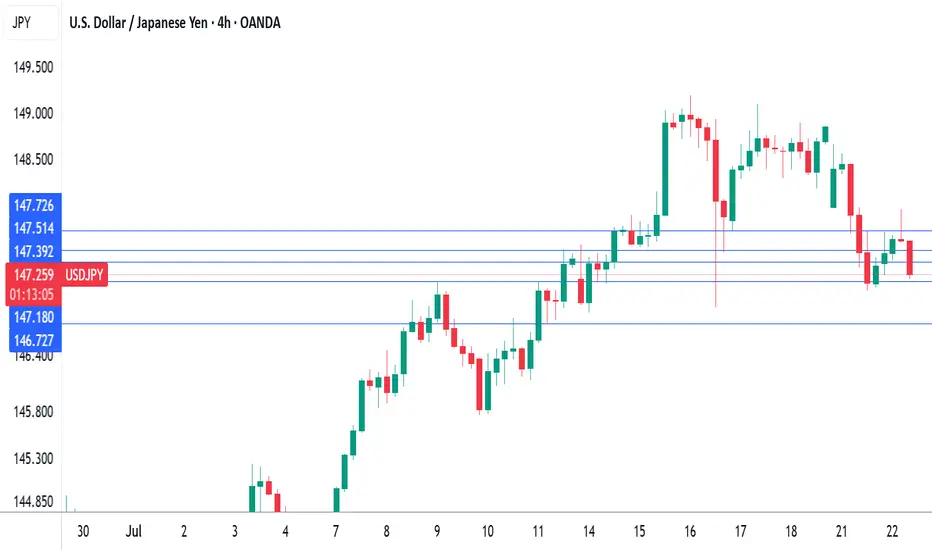
Japan's coalition loses majority, yen higherThe Japanese yen has started the week with strong gains. In the European session, USD/JPY is trading at 147.71, down 0.07% on the day.
Japanese Prime Minister Ishiba's ruling coalition failed to win a majority in the election for the upper house of parliament on Sunday. The result is a humiliating blow to Ishiba, as the government lost its majority in the lower house in October.
The stinging defeat could be the end of the road for Ishiba. The Prime Minister has declared he will remain in office, but there is bound to be pressure from within the coalition for Ishiba to resign.
The election result was not a surprise, as voters were expected to punish the government at the ballot box due to the high cost of food and falling incomes. The price of rice, a staple food, has soared 100% in a year, causing a full-blown crisis for the government, which has resorted to selling stockpiled rice from national reserves to the public.
The election has greatly weakened Ishiba's standing, which is bad news as Japan is locked in intense trade talks with the US. President Trump has warned that he will impose 25% tariffs on Japanese goods if a deal isn't reached by August 1. Japan is particularly concerned about its automobile industry, the driver of its export-reliant economy.
The Bank of Japan meets on July 31 and is widely expected to continue its wait-and-see stance on rate policy. The BoJ has been an outlier among major central banks as it looks to normalize policy and raise interest rates. However, with the economic turbulence and uncertainty due to President Trump's erratic tariff policy, the Bank has stayed on the sidelines and hasn't raised rates since January. Japan releases Tokyo Core CPI on Friday, the last tier-1 event before the rate meeting.
There is resistance at 148.39 and 149.08
147.95 and 147.70 are the next support levels
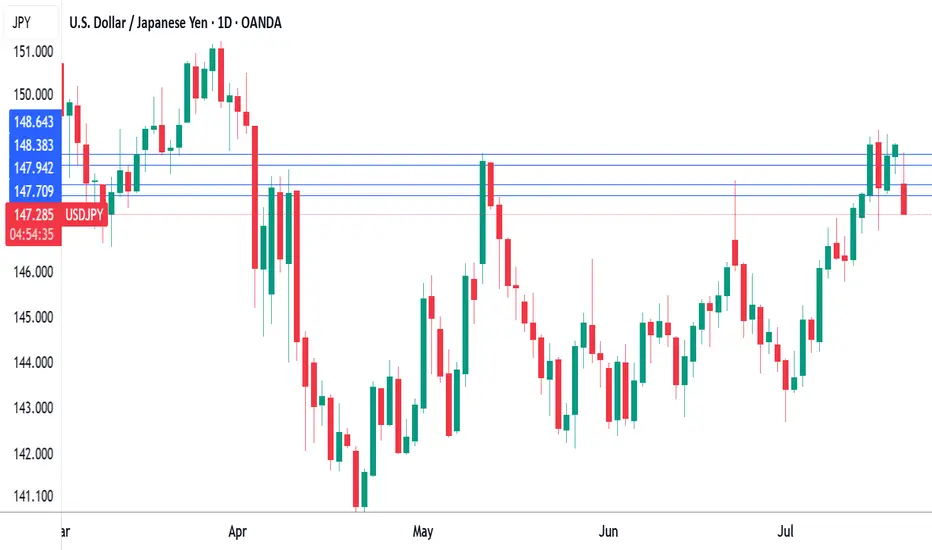
Japan's coalition loses majority, yen higherThe Japanese yen has started the week with strong gains. In the European session, USD/JPY is trading at 147.71, down 0.73% on the day.
Japanese Prime Minister Ishiba's ruling coalition failed to win a majority in the election for the
upper house of parliament on Sunday. The result is a humiliating blow to Ishiba, as the government lost its majority in the lower house in October. The stinging defeat could be the end of the road for Ishiba. The Prime Minister has declared he will remain in office, but there is bound to be pressure from within the coalition for Ishiba to resign.
The election result was not a surprise, as voters were expected to punish the government at the ballot box due to the high cost of food and falling incomes. The price of rice, a staple food, has soared 100% in a year, causing a full-blown crisis for the government, which has resorted to selling stockpiled rice from national reserves to the public.
The election has greatly weakened Ishiba's standing, which is bad news as Japan is locked in intense trade talks with the US. President Trump has warned that he will impose 25% tariffs on Japanese goods if a deal isn't reached by August 1. Japan is particularly concerned about its automobile industry, the driver of its export-reliant economy.
The Bank of Japan meets on July 31 and is widely expected to continue its wait-and-see stance on rate policy. The BoJ has been an outlier among major central banks as it looks to normalize policy and raise interest rates. However, with the economic turbulence and uncertainty due to President Trump's erratic tariff policy, the Bank has stayed on the sidelines and hasn't raised rates since January. Japan releases Tokyo Core CPI on Friday, the last tier-1 event before the rate meeting.
UK employment,wage growth falls, US retail sales shineThe British pound showing limited movement on Thursday. In the North American session, GBP/USD is trading at 1.3406, down 0.09% on the day.
Today's UK employment report pointed to a cooling in the UK labor market. The number of employees on company payrolls dropped by 41 thousand in June after a decline of 25 thousand in May. Still, the May decline was downwardly revised from 109 thousand, easing concerns of a significant deterioration in the labor market.
Wage growth (excluding bonuses) dropped to 5.0% from a revised 5.3%, above the market estimate of 4.9%. The unemployment rate ticked up to 4.7%, up from 4.6% and above the market estimate of 4.6%. This is the highest jobless level since the three months to July 2021.
The latest job data will ease the pressure on the Bank of England to lower rates, as the sharp revision to the May payroll employees means the labor market has not deteriorated as much as had been feared. Still, the employment picture remains weak and the markets are expecting an August rate cut, even though UK inflation was hotter than expected in June.
US retail sales bounced back in June after back-to-back declines. Consumers reacted with a thumbs-down to President Trump's tariffs, which took effect in April and made imported goods more expensive.
The markets had anticipated a marginal gain of just 0.1% m/m in June but retail sales came in at an impressive 0.6%, with most sub-categories recording stronger activity in June. This follows a sharp 0.9% decline in May.
The US tariffs seem to have had a significant impact on retail sales, as consumers continue to time their purchases to minimize the effect of tariffs.
Consumers increased spending before the tariffs took effect and cut back once the tariffs were in place. With a truce in place between the US and China which has slashed tariff rates, consumers have opened their wallets and are spending more on big-ticket items such as motor vehicles, which jumped 1.2% in June.
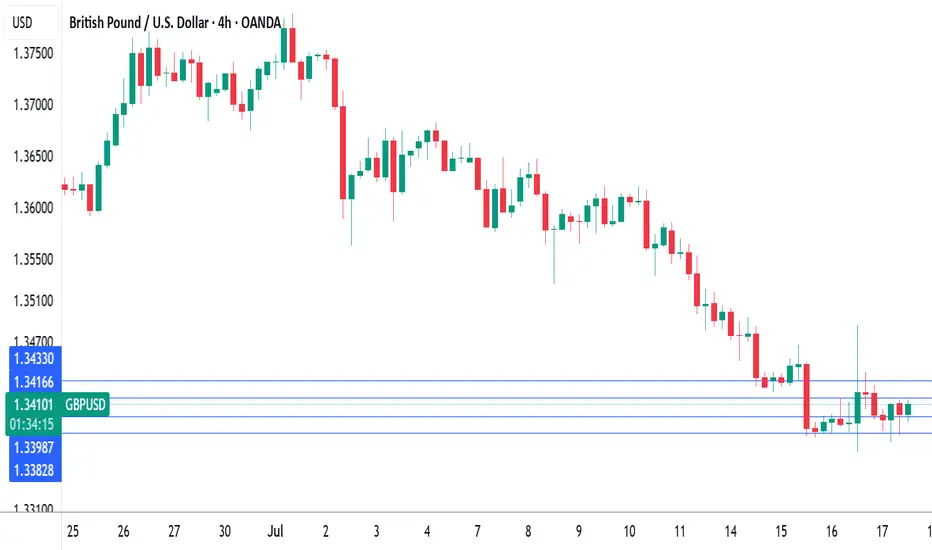
Pound under pressure ahead of US, UK inflation reportsThe British pound has edged up higher on Tuesday. In the European session, GBP/USD is trading at 1.3453, up 0.21% on the day. Earlier, GBP/USD touched a low of 1.3416, its lowest level since June 23.
All eyes will be on the UK inflation report for June, which will be released on Wednesday. Headline CPI is expected to remain unchanged at 3.4% y/y, as is core CPI at 3.5%. Monthly, both the headline rates are expected to stay steady at 0.2%.
Has the BoE's battle to lower inflation stalled? The BoE was looking good in March, when inflation eased to 2.6%, but CPI has rebounded to 3.4%, well above the BoE's inflation target of 2%. Services data has been especially sticky, although it dropped to 4.7% in May, down from 5.4% a month earlier.
At 3.4%, inflation is stuck at its highest level since February 2024 and that will complicate plans at the BoE to renew interest rate cuts in order to kick-start the weak UK economy. The central bank has lowered rates twice this year and would like to continue trimming the current cash rate of 4.25%. The Bank meets next on Aug. 7 and Wednesday's inflation data could be a significant factor in the rate decision.
In the US, if June inflation data rises as is expected, fingers will quickly point to President Trump's tariffs as finally having an impact. Recent inflation reports have not shown a significant spike higher due to the tariffs, which were first imposed in April. However, the tariffs may have needed time to filter throughout the economy and could be felt for the first time in the June inflation reading.
The Fed meets next on July 30, with the markets pricing in a 95% chance of a hold, according to CME's FedWatch. For September, the odds of a rate cut stand at 59%. Today's inflation report could cause a shift in these numbers.
GBP/USD tested resistance at 1.3454 earlier. Above, there is resistance at 1.3484
1.3396 and 1.3366 are the next support levels

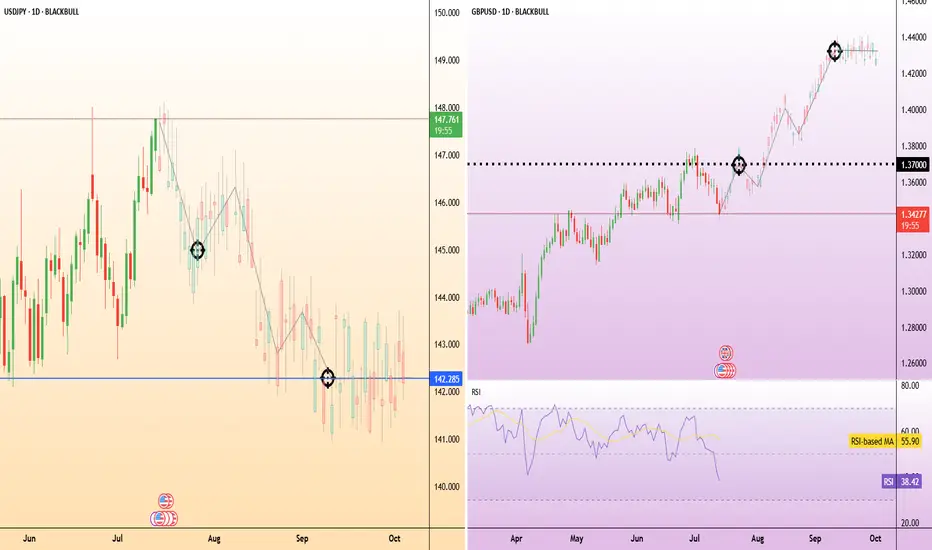
What Happens the Day Jerome Powell Is Fired or Quits?A sudden exit by Fed Chair Jerome Powell would create both a political and monetary shock.
While the Chair is technically protected from arbitrary removal. Recent reports confirm that President Trump and his allies are scrutinising the Fed’s $2.5 billion renovation project—potentially laying the groundwork for a “for cause” dismissal.
A surprise departure would undermine confidence in the Fed’s independence. The U.S. dollar could fall sharply across major pairs.
USD/JPY could fall toward ¥145, with safe-haven demand favouring the yen. However, the reaction may be less severe than in pairs like Swiss franc which we have noted in the past is the potentially preferred safe haven. A panic selloff could extend to 142.20—a prior consolidation floor.
GBP/USD could surge as traders anticipate a more dovish Fed stance under the new Trump-stooge Fed Chair. From a technical perspective, GBP/USD is maybe already oversold and potentially poised for a potential rebound anyway—Powell’s resignation or firing could potentially exacerbate this. The first level to watch being a return to 1.3700, assuming the likely expectation of Fed rate cuts rise.
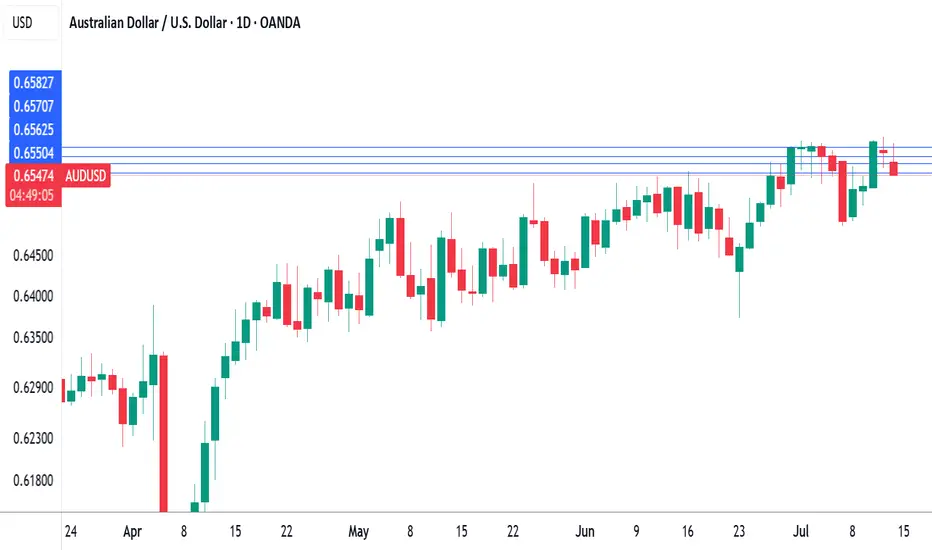
Australian dollar eyes China GDPThe Australian dollar has edged lower on Monday. In the North American session, AUD/USD is trading at 0.6555, down 0.32% on the day. The Aussie took advantage of US dollar weakness last week as it touched a high of 0.6593, its highest level since November 2024.
China's economy is expected to have grown by 5.1% in the second quarter, after back-to-back quarters of gains of 5.4%. The government's annual growth target is around 5.0%, and policymakers won't complain if this target is exceeded for a third consecutive quarter.
China's exports were up 5.8% y/y in June, above the consensus of 5.0% and well above the May gain of 4.8%. The jump in exports was driven by a trade truce with the US that lowered tariffs on Chinese goods from 145% to 55%. Still, the economic picture is uncertain as the tariff truce ends in August.
China will also release industrial production and retail sales for June, with the markets forecasting weaker numbers. Industrial production, which has been decelerating in recent months, is expected to ease to 5.6% from 5.8%, while retail sales are expected to fall to 5.6%, down from 6 .4% in May, which was the strongest level since December 2023.
Australia releases Westpac Consumer Sentiment on Tuesday, with a forecast of a 0.4% gain for July . This follows a 0.4% gain in June. Consumers remain cautious, despite the Reserve Bank of Australia's rate cut in May and lower inflation.
The RBA shocked the markets last week when it maintained the cash rate at 3.85%, as all signs appeared to point to a quarter-point cut. The RBA meets next on August 12.
AUD/USD is testing support at 0.6562. Below, there is support at 0.6550
There is resistance at 0.6570 and 0.6582
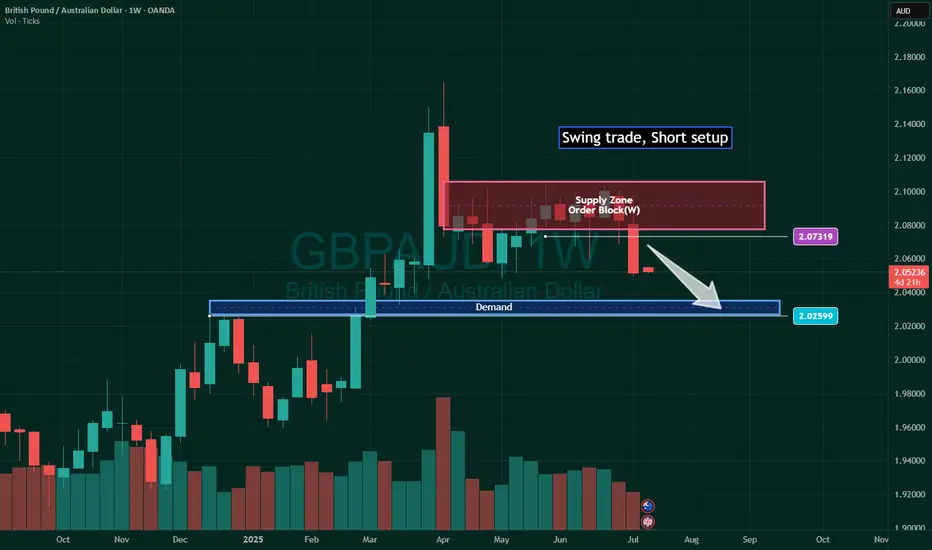
GBPAUD Weekly Chart Short setup for Swing trade💫Hello Traders, here is a new ICT Short setup in GBPAUD weekly chart.
This idea can be used for Swing trade and intraday trade main direction.
We expect GBPAUD will land on a Swing high marked by the blue Demand Zone.
Good luck.💝
Why election risk means yen volatility could rise this weekThe Japanese yen remains vulnerable ahead of Japan’s Upper House election on July 20.
Polls suggest the ruling LDP-Komeito coalition may lose its Upper House majority. Such an outcome would further weaken Prime Minister Shigeru Ishiba’s position, with his government already operating as a minority in the Lower House.
Adding to the pressure, the U.S. is set to impose 25% tariffs on Japanese goods from August 1—part of a broader protectionist push.
USD Strengthens Against GBP With New Tariff AnnouncementsThis is the Weekly FOREX Forecast for the week of July 14 - 18th.
In this video, we will analyze the following FX market: GBPUSD
The latest headlines tell the story. The tariffs are triggering a slow run to the USD safe haven. The previous week showed the USD Index closed pretty strong, while GBPUSD weakened.
There's a good chance we'll see more of the same this coming week.
Look for the strength in USD to continue to be supported by fundamental news, and outperform the other major currencies, including the GBP.
Buy USD/xxx
Sell xxx/USD
Enjoy!
May profits be upon you.
Leave any questions or comments in the comment section.
I appreciate any feedback from my viewers!
Like and/or subscribe if you want more accurate analysis.
Thank you so much!
Disclaimer:
I do not provide personal investment advice and I am not a qualified licensed investment advisor.
All information found here, including any ideas, opinions, views, predictions, forecasts, commentaries, suggestions, expressed or implied herein, are for informational, entertainment or educational purposes only and should not be construed as personal investment advice. While the information provided is believed to be accurate, it may include errors or inaccuracies.
I will not and cannot be held liable for any actions you take as a result of anything you read here.
Conduct your own due diligence, or consult a licensed financial advisor or broker before making any and all investment decisions. Any investments, trades, speculations, or decisions made on the basis of any information found on this channel, expressed or implied herein, are committed at your own risk, financial or otherwise.

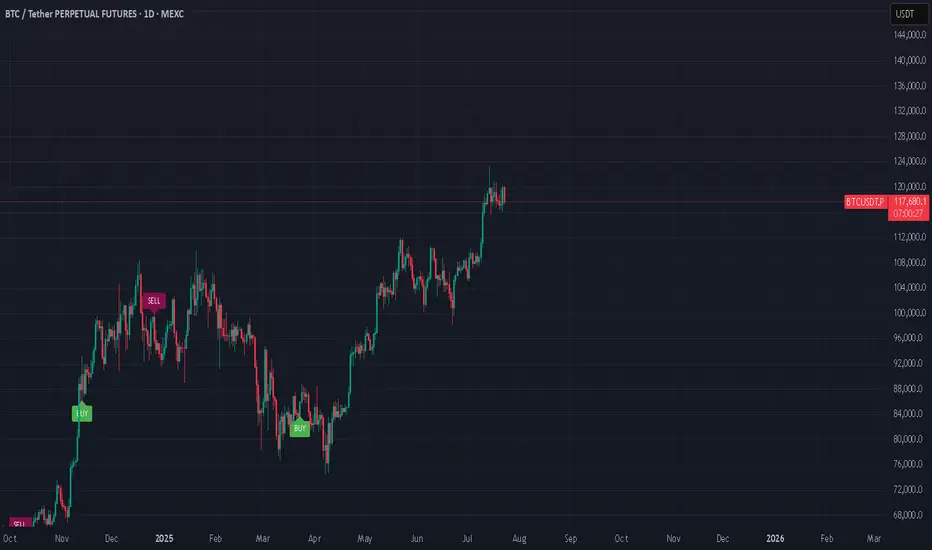
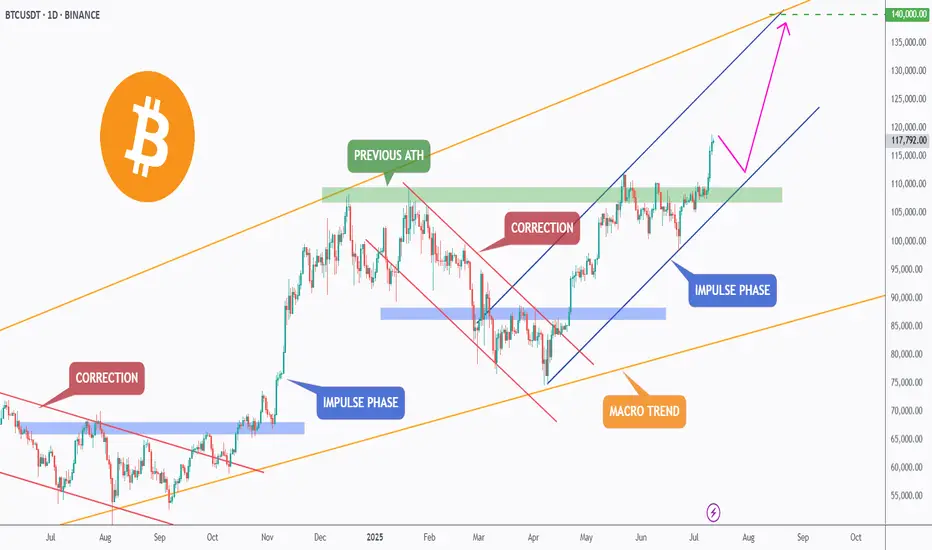
BTC is Back in Price Discovery Mode — Targeting $140K!After a clean break above the previous all-time high, Bitcoin has officially entered a new impulse phase, trading within a steep rising channel.
The green zone around the previous ATH is now acting as a strong support zone, confirming the shift in market structure.
🟠 The macro trend remains intact, and bulls are clearly in control.
🌀 Corrections continue to offer opportunities for trend-following entries, and if momentum holds, BTC could be on its way toward the $140,000 mark — the upper boundary of the macro channel.
Until then, every dip is a gift in this bullish cycle. 🔥
🧠 Trade with the trend. Manage your risk. Stay ready.
📚 Always follow your trading plan regarding entry, risk management, and trade management.
Good luck!
All Strategies Are Good; If Managed Properly!
~Richard Nasr
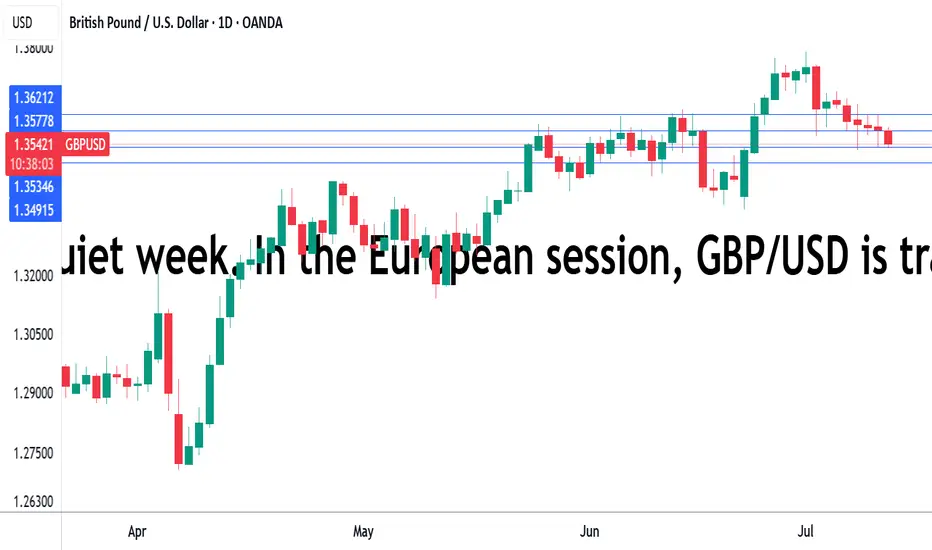
UK GBP contracts, pound dipsThe British pound continues to have a quiet week. In the European session, GBP/USD is trading at 1.3530, down 0.30% on the day.
The UK wrapped up the week on a down note, as GDP contracted in May by 0.1% m/m. This followed a 0.3% decline in April and missed the consensus of 0.1%. The decline was driven by a 1% decline in manufacturing and a 0.6% contraction in construction, which cancelled out a 0.1% expansion in services.
The GDP contractions in April and May point to a weak second quarter of growth, after an impressive 0.7% gain in the first quarter. The economic landscape remains uncertain and the Bank of England has projected weak growth of 1% for 2025. Governor Bailey has said that the rate path will be "gradually downwards" but hasn't hinted as to the timing of the next cut.
The weak GDP data supports the case for an August rate cut, even though headline inflation is running at 3.4% and core inflation at 3.5%, well above the BoE's target of 2%. The money markets have priced in a quarter-point cut in August at 80%, which would lower the cash rate to 4.0%.
The BoE released its financial stability report earlier in the week, noting that the outlook for UK growth over the coming year is "a little weaker and more uncertain". The Bank highlighted President Trump's tariffs and the conflict in the Middle East. The UK has recently signed a trade deal with the US but some tariffs on UK products remain in effect.
GBP/USD is testing support at 1.3534. Below, there is support at 1.3491
The next resistance lines are 1.3577 and 1.3620
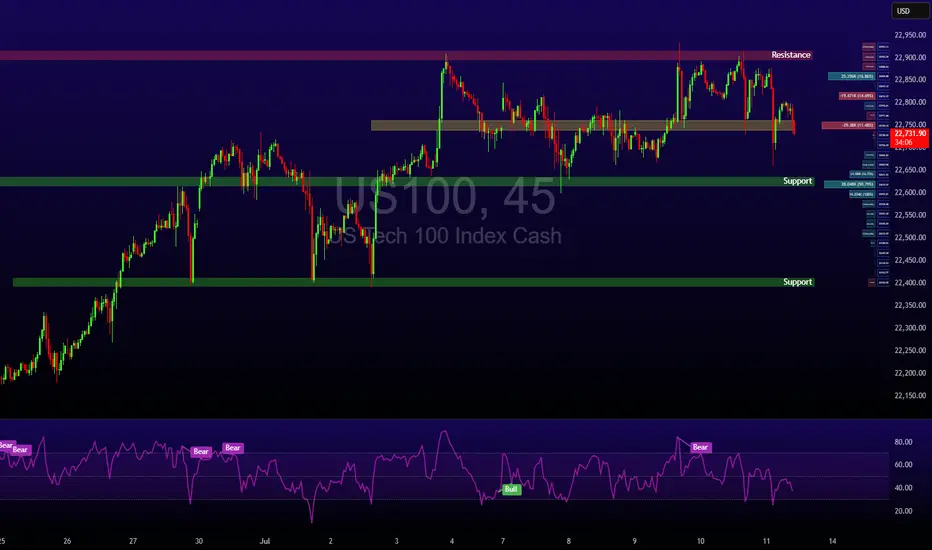
Nasdaq 100 Dips as Tariffs Spark CautionWhile crypto markets rally, U.S. equities have cooled. The Nasdaq 100 dropped by 0.6% following the announcement of new tariffs, particularly those aimed at Canadian goods. Tech stocks are reacting cautiously to these developments, although Nvidia’s record-breaking $4 trillion market cap continues to provide some support for the index.
With major financials such as JPMorgan and Wells Fargo reporting Q2 earnings next week, investors will soon get clarity on how corporate America is coping with higher input costs and global trade tensions.
Technical View (Nasdaq 100):
The index is consolidating between resistance at 22,900 and support at 22,600. A break above 22,900 could reignite the tech rally, while a drop below support may see price test 22,400 and potentially 22,000 in coming sessions.
Copper - the hot topic this weekUS is planning to implement tariffs on copper imports at a scale of 50%. It's an interesting move, which might not make much sense. Let's dig in.
MARKETSCOM:COPPER
COMEX:HG1!
Let us know what you think in the comments below.
Thank you.
75.2% of retail investor accounts lose money when trading CFDs with this provider. You should consider whether you understand how CFDs work and whether you can afford to take the high risk of losing your money. Past performance is not necessarily indicative of future results. The value of investments may fall as well as rise and the investor may not get back the amount initially invested. This content is not intended for nor applicable to residents of the UK. Cryptocurrency CFDs and spread bets are restricted in the UK for all retail clients.
