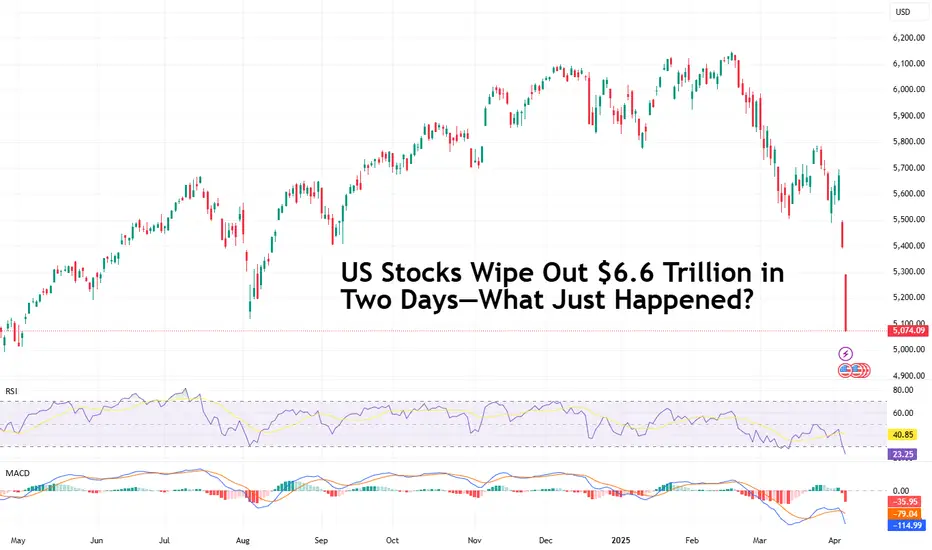
US Stocks Wipe Out $6.6 Trillion in Two Days—What Just Happened?Shoutout to the real MVPs of April: the traders who did absolutely nothing. You market wizards, zen masters of the sidelines — while others were busy buying the dip that kept on dipping, you outperformed the S&P 500 SP:SPX , avoiding the nastiest market faceplant since the Covid crash of March 2020.
Since April 2, Liquidation Day , Liberation Day , the S&P 500 SP:SPX has nosedived a brutal 10%. That’s officially a correction — the kind that makes you stare out your window like a philosopher, questioning your life choices, your portfolio, and whether you really needed that Nvidia NASDAQ:NVDA call.
This isn’t just a dip. It’s a market reality check served with extra salt. So raise a (half empty?) glass to the ones who stayed flat — you just made Warren Buffett proud . In a world of overtrading, doing nothing was the most alpha move of all.
Everyone who checked the market at least once on Thursday or Friday (even today when futures markets were all red ) knows what that is all about.
It’s Trump’s tariff rollout coming like a wrecking ball. While the US President portrays his efforts as a fair and even lenient response to other countries’ trade policies with the US, investors don't seem to think so.
In just two days, Thursday and Friday, the US stock market washed out $6.6 trillion. The violent selloff threw the Nasdaq Composite NASDAQ:IXIC into a bear market (down 20% from its peak) and the S&P 500 into correction territory. The broad-based Wall Street darling waved goodbye to 6% on Friday, extending its 4.8% loss from the previous day.
On Thursday, Trump unveiled his new plan to boost the US economy through reciprocal tariffs. China got hammered with a total of 54% , while Europe wasn’t spared either, slapped with a flat 20%.
Some uninhabited islands also made the list — Heard and McDonald Islands (Australia's icy outpost) and Jan Mayen (Norway's frozen Arctic rock) got served a 10% tariff.
Now, the thing with tariffs is, they tend to backfire. Because they are paid by the party receiving them, i.e. US companies, they hike the prices of imported goods, squeeze consumers, and isolate the country imposing them. They strain international trade relationships, disrupt supply chains, and — as history shows — often spark retaliation.
And that’s exactly what happened. On Friday, China hit back hard, launching a 34% tariff barrage on US imports — a sharp counter-strike against Trump’s escalating trade war tactics.
What did Trump say on the matter? “CHINA PLAYED IT WRONG, THEY PANICKED - THE ONE THING THEY CANNOT AFFORD TO DO!” he said on his social media platform.
Just as the markets were a dumpster fire on Friday, Federal Reserve boss Jay Powell gave a speech at a business journalists' conference. In his remarks, he said that Trump’s tariffs would cause “higher inflation and slower growth.”
“It is now becoming clear that the tariff increases will be significantly larger than expected. The same is likely to be true of the economic effects,” Powell said.
Trump's response?
“This would be a PERFECT time for Fed Chairman Jerome Powell to cut Interest Rates. He is always ‘late,’ but he could now change his image, and quickly,” Trump wrote in a post. “Energy prices are down, Interest Rates are down, Inflation is down, even Eggs are down 69%, and Jobs are UP, all within two months - A BIG WIN for America. CUT INTEREST RATES, JEROME, AND STOP PLAYING POLITICS!”
So here we are — $6.6 trillion lighter, futures in free fall, inflation fears reignited, and a full-blown trade war back on the table. The Fed’s caught in a political crossfire, Trump’s turning up the heat, and markets are flashing every red light imaginable.
On top of it all, corporate earnings are just around the corner with the big banks on Wall Street kicking off the first-quarter reporting at the end of this week. Keep track of all big reports in the Earnings Calendar .
One thing’s for sure: this isn’t the time to trade on hope or headlines. It’s the time to trade with eyes wide open, risk tightly managed, and a clear understanding that your next move could shape the rest of your year. Most of all, don’t panic .
Off to you now: are you sitting this one out like Buffett — or are you moving in before the smoke clears?
Tariffs
DXY Bearish trend continues on SSL and Bearish ORDER BLOCKDXY is known for extreme liquidity grabs especially after Trump's tariff announcements. Until we see countries remove tariffs and companies changing factory locations DXY will still be week. A decent pullback this week?? Probably not, Next? Maybe STAY SHARP!!

Using Put Options to Protect Your Stock PortfolioCME: Options on E-Mini S&P 500 Futures ( CME_MINI:ES1! )
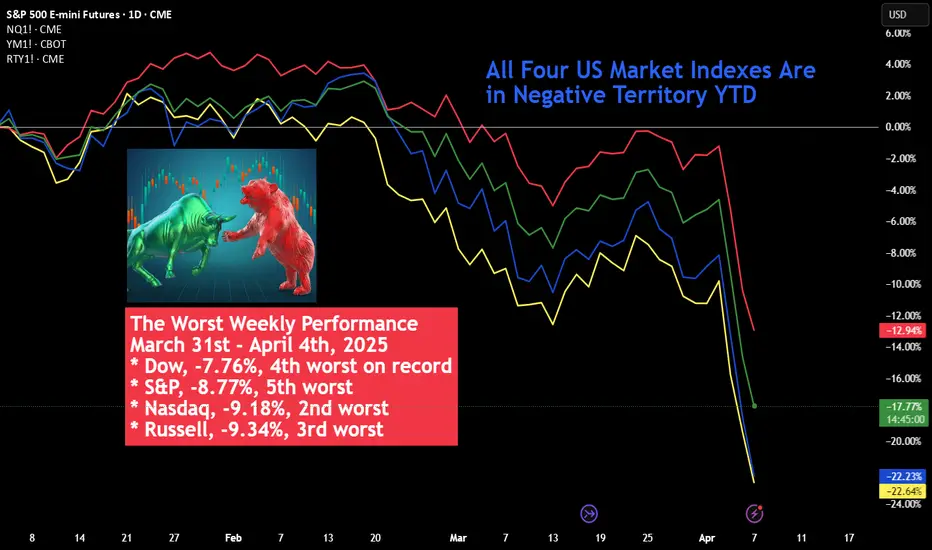
Last week’s bloodshed of global financial market made history. Nearly all major asset classes fell into a market turmoil driven by tariffs and retaliations.
Let’s focus on the US stock market:
• Dow Jones Industrial Average dropped 7.76% in the week of March 31st to April 4th, making it the 4th worst weekly performance on record
• S&P 500 slipped 8.77%, the 4th worst week in history
• Nasdaq Composite fell 9.18%, the 2nd worst week
• Russell gave up 9.34%, the 3rd worst week
All four stock index futures were in negative territory year-to-date. On Sunday evening, E-Mini S&P 500 opened 178 points lower to 4,932, losing 17.1% YTD.
All parties ultimately come to an end. After two years of double-digit gains, the unstoppable US stock market finally cracked. As more tariffs and retaliations are expected to escalate, I am afraid that we are only seeing the beginning, rather than the end.
For stock investors, this is a good reminder of market risk, something we always talk about but seldomly pay attention to. The “return of investment” should be focusing on the repayment of your money, a safety issue. Only after that should we talk about the gain from the investment. It is a necessity to protect your portfolio to achieve long-term growth.
Trading with Options on E-Mini S&P 500 Futures
For investors with a diversified portfolio, Put Options on the E-Mini S&P 500 futures are effective and cost-efficient tools. Investors who long the stocks will lose money, should stock prices fall. Put options would gain in value, providing a hedge to the portfolio.
The following illustration shows a hypothetical example, given:
• An investor has a $250,000 portfolio holding a diversified pool of U.S. stocks
• CME E-Mini S&P 500 futures ( NYSE:ES ) have a contract size of $50 times the index value
• The June contract (ESM5) was quoting at 4,935 Sunday evening Friday, making the notional value of 1 contract $246,750, approximately equal to our portfolio value
• Assuming the portfolio moves closely in line with the S&P 500
• The investor wants to limit the loss of his portfolio to 12%. If the S&P 500 index is currently around 4950, a put option with a strike price of 4350 would roughly correspond to a 12% decline
Hedging trade illustration:
• The investor buys 1 put option on the June futures with the strike price of 4,600
• CME quote on that Put option is 223. As the contract is $50 times the index, the premium upfront for one put option contract is $11,150 (223*$50), ignoring any commissions
• The put premium is calculated as 4.46% of the $250K portfolio
If S&P drops to 4,200 (-15.15%) by the end of April:
• Without the put, the portfolio lost $37,879, assuming the same loss with the S&P
• The 4600-strike put is now 400 points in-the-money
• The investor sells the put and receives $20,000 (= 400 x 50)
• The loss of portfolio will be 37879+11150-20000 = $29,029
• With an E-mini S&P put protection to mitigate loss from the stock portfolio, the investor lost 11.6% (= 29029 / 250000), which is 3.5% lower than the S&P loss and with the preset loss limit
If S&P drops to 4,000 (-19.2%) by the end of May:
• Without the put, the portfolio lost $47,980, assuming the same loss with the S&P
• The 4850-strike put is now 600 points in-the-money
• The investor sells the put and receives $30,000 (= 600 x 50)
• The loss of portfolio will be 47980+11150-30000 = $29,130
• With an E-mini S&P put protection to mitigate loss from the stock portfolio, the investor lost 11.6% (= 29,130 / 250000)
As we can see here, when the S&P falls sharply, the investor will be able to cap his loss to 11.6%. In a “protective put” strategy, we would consider the option premium an insurance contract for owning stocks. If the index rises, the portfolio return would be lowered a little because of the premium upfront, that is, the cost of insurance. However, the protection is a lifesaver if the index falls.
Before jumping into action, the investor needs to run a correlation analysis using the daily value of the portfolio against the S&P 500 closing prices. Here is how:
• Some trading software has correlation feature built in already
• If not, pull 1-year daily portfolio balance and 1-year S&P closing prices, export them to Excel. Run correlation test with these two data series using Excel data analysis tool.
• Alternatively, we could drop the data into ChatGPT and ask AI to do the work for us.
If the correlation is greater than 50%, it means that S&P 500 is a good fit to hedge the portfolio. If it is not, we could try the correlation analysis using the other stock index closing prices, such as the Dow, the Nasdaq 100 and the Russell 2000. Then replace E-Mini S&P 500 futures with the stock index futures contract best fit the portfolio.
Happy Trading.
Disclaimers
*Trade ideas cited above are for illustration only, as an integral part of a case study to demonstrate the fundamental concepts in risk management under the market scenarios being discussed. They shall not be construed as investment recommendations or advice. Nor are they used to promote any specific products, or services.
CME Real-time Market Data help identify trading set-ups and express my market views. If you have futures in your trading portfolio, you can check out on CME Group data plans available that suit your trading needs tradingview.sweetlogin.com
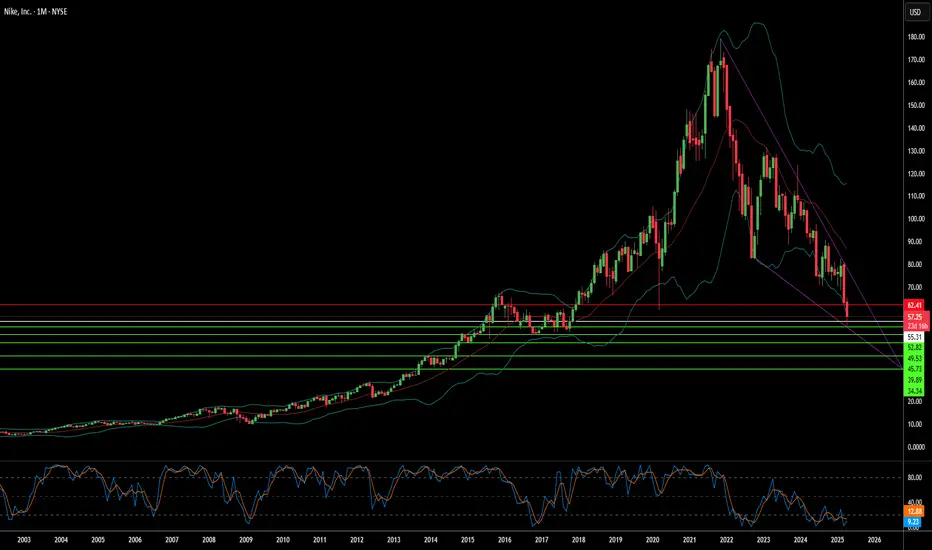
Vietnam's Shadow Over Nike's Swoosh?Nike's recent stock dip illuminates the precarious balance of global supply chains in an era of trade tensions. The article reveals a direct correlation between the proposed US tariffs on Asian imports, particularly from Vietnam – Nike's primary manufacturing hub – and a significant drop in the company's stock value. This immediate market reaction underscores the financial risks associated with Nike's deep reliance on its extensive factory network in Vietnam, which produces a substantial portion of its footwear, apparel, and equipment.
Despite robust revenues, Nike operates with relatively thin profit margins, leaving limited capacity to absorb increased costs from tariffs. The competitive nature of the athletic wear industry further restricts Nike's ability to pass these costs onto consumers through significant price hikes without risking decreased demand. Analysts suggest that only a fraction of the tariff burden can likely be transferred, forcing Nike to explore alternative, potentially less appealing, mitigation strategies such as product downgrades or extended design cycles.
Ultimately, the article highlights Nike's significant challenges in navigating the current trade landscape. While historically cost-effective, the deep entrenchment of its manufacturing in Vietnam now presents a considerable vulnerability. Shifting production elsewhere, particularly back to the US, proves complex and expensive due to the specialized nature of footwear manufacturing and the lack of domestic infrastructure. The future financial health of the athleticwear giant hinges on its ability to adapt to these evolving geopolitical and economic pressures.
Weekly $SPY / $SPX Scenarios for April 7–11, 2025🔮 🔮
🌍 Market-Moving News 🌍:
🇺🇸📈 New U.S. Tariffs Begin April 9: Trump’s “Liberation Day” tariffs — 10% on all imports, 25%+ on key sectors — could stir volatility.
🇨🇳📦 China Retaliates April 10: A 34% retaliatory tariff on U.S. goods raises trade war fears and inflation concerns.
🏦💰 Big Bank Earnings Kick Off: JPMorgan, Wells Fargo, and BlackRock will report. Markets will watch closely for financial health signals.
📉📊 March CPI Report Coming April 10: Inflation data could sway the Fed’s rate path. Forecasts call for a 0.1% increase.
⚠️ Volatility Alert: Piper Sandler projects a possible 5.6% move in the S&P 500 this week — up or down.
📊 Key Data Releases 📊
📅 Monday, April 7:
🗣️ Fed Gov. Kugler Speaks (10:30 AM ET)
💳 Consumer Credit (3:00 PM ET) — Forecast: $15.5B | Prev: $18.1B
📅 Tuesday, April 8:
📈 NFIB Small Biz Optimism (6:00 AM ET) — Forecast: 100.7
🗣️ Fed’s Mary Daly Speaks (8:00 AM ET)
📅 Wednesday, April 9:
📦 Wholesale Inventories (10:00 AM ET) — Forecast: 0.4% | Prev: 0.8%
🗣️ Fed’s Barkin Speaks (11:00 AM ET)
📝 FOMC Minutes (2:00 PM ET)
📅 Thursday, April 10:
📉 Jobless Claims (8:30 AM ET) — Forecast: 219K
📊 CPI (8:30 AM ET) — Forecast: 0.1% | Prev: 0.2%
🗣️ Fed Gov. Bowman Testifies (10:00 AM ET)
📅 Friday, April 11:
🏭 PPI (8:30 AM ET) — Forecast: 0.2% | Prev: 0.0%
🗣️ Fed’s Musalem Speaks (10:00 AM ET)
⚠️ Disclaimer: This information is for educational and informational purposes only and should not be construed as financial advice. Always consult a licensed financial advisor before making investment decisions.
📌 #trading #stockmarket #economy #news #trendtao #charting #technicalanalysis
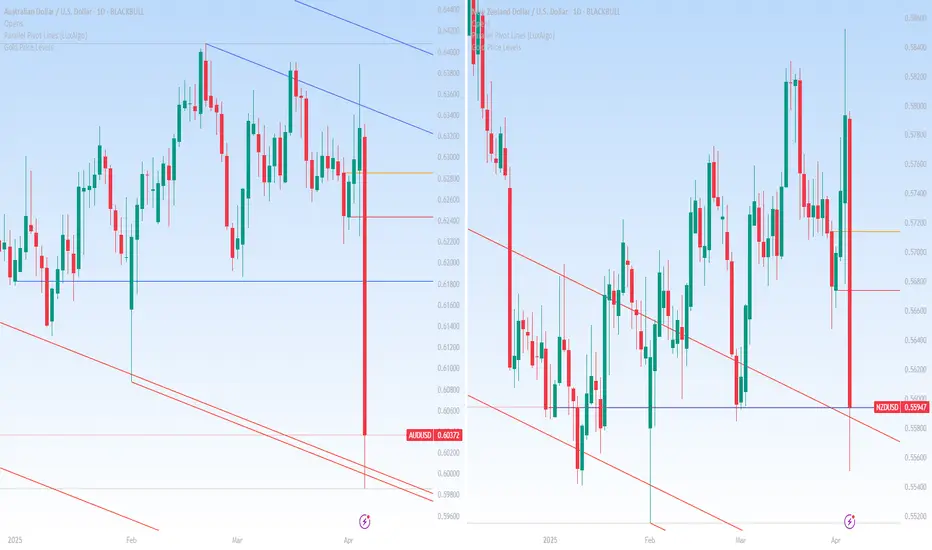
AUD and NZD: WTH? RBNZ now in focusRisk aversion intensified on Friday, sending the Australian dollar down 4.56% and the New Zealand dollar 3.53% lower.
The declines followed a move by US President Donald Trump to impose a 10% tariff on imports from both Australia and New Zealand. Australian Prime Minister Anthony Albanese confirmed there would be no retaliation, noting the US represents less than 5% of Australia’s export market. New Zealand, with a higher 12% exposure, also ruled out countermeasures.
For the New Zealand dollar, markets will now be focused on this week’s Reserve Bank of New Zealand decision, where a 25-basis point rate cut is widely expected. Barring further tariff news, this could be the most important event determining whether this sell-off continues.
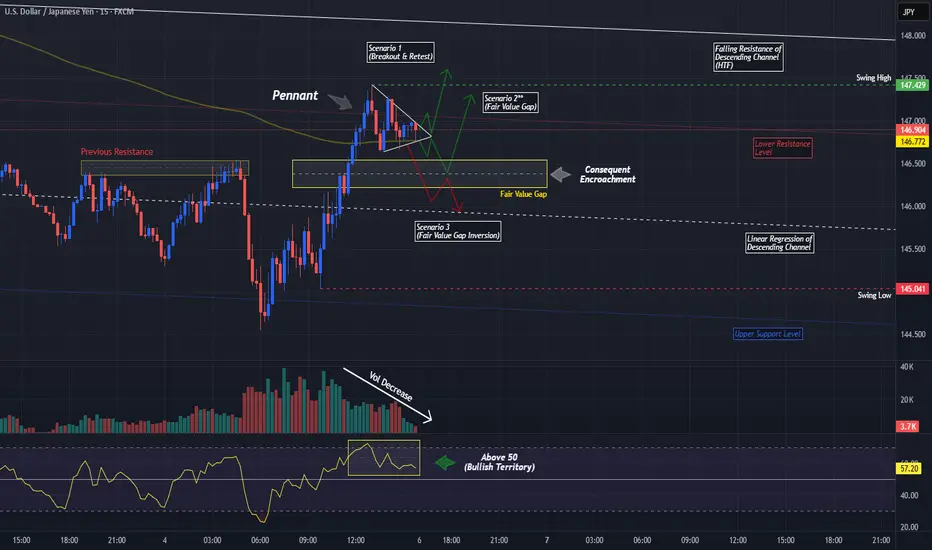
USDJPY Potential Pennant Triple ThreatFirst,
In the Higher Timeframes (4Hr - Weekly), we can see that USDJPY is traveling down a Descending Channel since Jan 10th. Price tried pushing higher in March but ultimately fell back within the Channel beginning of this month (April) resulting only in a False Breakout but also creating a Fair Value Gap from 148.698 - 147.429.
Now down on the Lower Timeframes (15min - 1Hr) we can see that Price has created a Fair Value Gap from 146.546 - 146.226 with current Price Action forming a Pennant Pattern just above this FVG which lines up with Previous Highs (Past Resistance Level) and with Volume Decreasing, suggests we could see a Breakout soon! Now Based on the Pennant Pattern being Neutral meaning can break either way, creates the first 2 Bullish Scenarios being either a Breakout and Retest of the Pennant pattern going Bullish OR Bearish.
*Breakout will be Validated if followed by an Increase in Volume!
Scenario 1 -If BULLISH BREAKOUT - The Retest will come at the Falling Resistance of the Pattern.
Scenario 2 -If BEARISH BREAKOUT - This could suggest Price is looking to "Fill The Gap" being the FVG
** If Scenario 2 happens, this Price Movement could be looking to fulfill a Fibonacci Retracement of the Swing Low @ 145.041 to the Swing High @ 146.904, where the 38.2% Level lays at the Upper Limit of the FVG and the 50% Level lays at the Lower Limit of the FVG with the Consequent Encroachment right in the middle @ 146.385.
—Both of this ideas suggest USD will need to gain strength which could mean fundamentally:
FOMC Meeting Minutes on Wednesday, April 9th & CPI (Consumer Price Index), the instrument used to measure Inflation, on Thursday, April 10th released results will be heavily relied on to see if there's anymore input on potential effects of Tariffs.
Scenario 3 - Fair Value Gap Inversion could suggest bad news fundamentally is released for USD and gives JPY Bears (Sellers) the ability to pull price down, keeping Price Consolidated further within the HTF Descending Channel.
Review and plan for 7th April 2025Nifty future and banknifty future analysis and intraday plan in kannada.
This video is for information/education purpose only. you are 100% responsible for any actions you take by reading/viewing this post.
please consult your financial advisor before taking any action.
----Vinaykumar hiremath, CMT

Apple Inc. (NYSE:$ AAPL)Drops $300B+ in Tariff- Fueled Sell-OffApple Inc. (NYSE:$ AAPL) faced a massive sell-off on Thursday, April 4th 2025, with its stock closing at $188.38, down $14.81 (7.29%). This marked Apple’s worst trading day since March 2020. The steep drop came after former President Donald Trump announced a new set of tariffs targeting 185 countries, including major U.S. trading partners.
As a result, Apple’s market capitalization fell by more than $310 billion in a single day. These newly imposed tariffs, effective April 9th, include a 10% blanket duty on all imports, with higher rates applied to specific countries. China, Apple’s primary manufacturing hub, will face a combined 54% tariff—34% newly imposed, added to an existing 20% rate.
Other affected regions include the European Union (20%), Vietnam (46%), Taiwan (32%), and India (26%). Analysts consider Apple especially vulnerable to these policies due to its heavy reliance on overseas production, especially in China, where nearly 85% of iPhones are manufactured.
According to Dan Ives of Wedbush, future exemptions to these tariffs may depend on Apple’s efforts to localize its operations within the U.S., a move hinted at by the company earlier this year. However, no details have been confirmed regarding whether Apple’s U.S. expansion plans will qualify for tariff relief. The timing of the policy combined with Apple’s exposure to international supply chains, led to a bear shift in market.
Technical Analysis: Apple Breaks Below Key $197 Support
Apple’s price action shows an impulsive breakdown below the key $197 strong support level. The price is currently trading around $188, trading towards next support at $167 as the immediate support.
A drop below $167 could push the stock lower to a long-term support around $125, which was lastly retested in Dec 2022. On the upside, any recovery would first need to reclaim the broken support at $197, which now acts as resistance. The all-time high around $260 remains far away from reach unless the overall stock market sentiment improves.
Looking ahead, the chart outlines two likely scenarios. In the bullish case, Apple may find support around $167, bounce back and attempt to break above $197, possibly re-establishing it as a support zone.
In the bearish case, failure to hold $167 could push the stock lower to test $125, and if that level breaks, the price may continue downward. The current market outlook suggests a wait-and-see approach, to what happens at key level, as both macroeconomic news and technical levels continue to drive Apple stock lower.

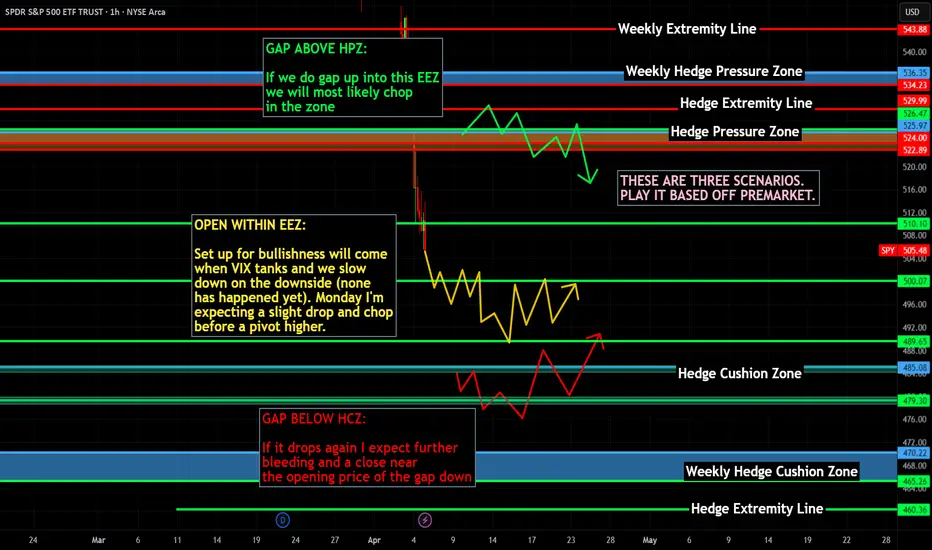
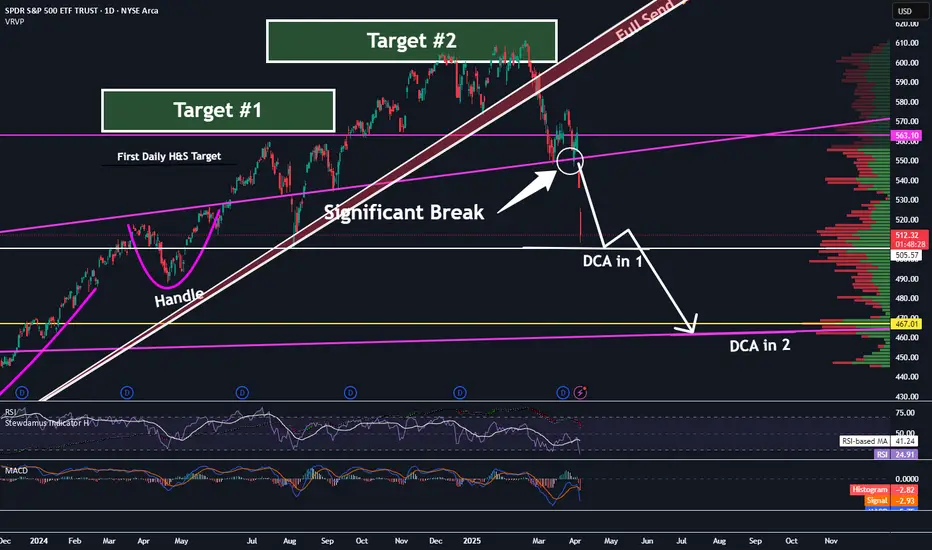
Tariff FUD is reking ports. SPY 505 First Stop. 460 Second.Trading Fam,
It's no surprise that Trump's implementation of high tariffs would cause initial FUD. This can be observed in the massive spikes on the $VIX. What is unknown and has caught many traders by surprise, myself included, is how substantial of a drop would be incurred by investor uncertainty.
Initially, it did appear that 500 might hold. That was a huge support. I knew if it broke, the sell-off would be deep. But I held hope that the market would hold above this trendline. It did not. So, yesterday and today, investors who held are incurring substantial losses.
For those who were smarter than me and sold at or near the top, congratulations! You've saved yourself some duress and cash. Now, some are calling this the beginning of a longer bear market. I still don't see it that way. Honestly (and I know this will be hard to believe), I still see the SPY hitting my target #3 at 670-700 before 2026 comes to an end. Longer-term we still remain in a massive secular bull market since 2009 and to break this long-term trend, the SPY would actually have to break below 300. That is a long way down and I just don't see that happening, though as always, I definitely could be wrong.
Shorter-term I am seeing two prominent areas of support. The first has almost been reached at 505. If I would have played this correctly, I'd be DCA'ing in my first load of cash here. The second area of support is at around 460 and slightly rising daily. This would be where I DCA'ed in another load of cash. However, if that broke, I'd exit immediately and reassess the charts. 300 is a long way down, but over the past 5 years we have seen some extraordinary market price action and volatility. TBH, even the best of us technicians are struggling to understand the larger macro-economic picture, but I'd wager to say that tariff fears may be overexaggerated as market reactions often tend to be.
One interesting note is that crypto price action no longer seems to correlate and prices have help up surprisingly well. Could this be our first indicator that the markets are due to turn up again in a few weeks/months? Unknown. But I can promise you I'll be watching this all closely.
✌️Stew
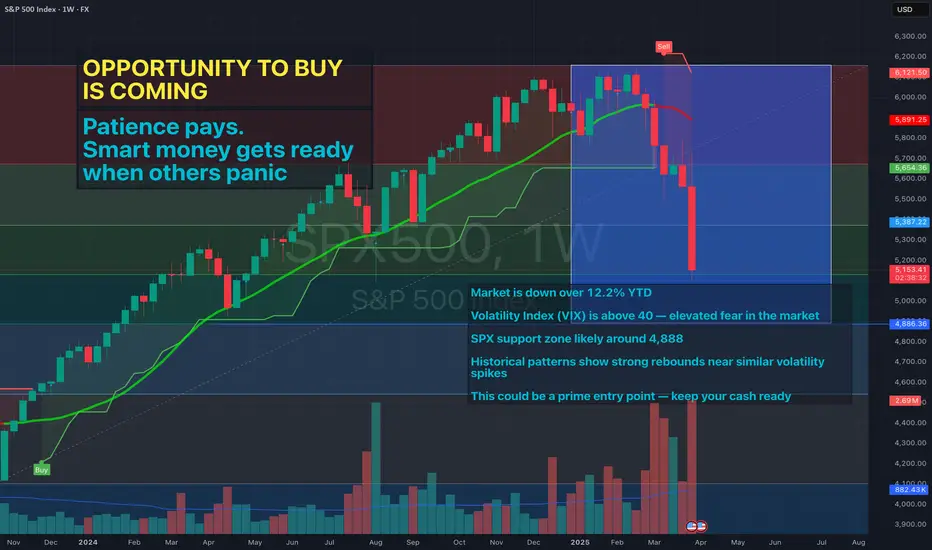
Markets hate tariffs but traders love discounts
SPX500 is down over 12.2% YTD
Volatility Index (VIX) is above 40 — elevated fear in the market
SPX support zone likely around 4,888
Historical patterns show strong rebounds near similar volatility spikes
This could be a prime entry point — keep your cash ready
With tariffs back in play, volatility could spike — stay ready for discounted entries
If you own a pair or NIKE! then this is your time #Shareholder Confessions from the Desk: Kim K Didn’t Move Nike, But Let’s Be Real…
So, it turns out Kim K’s magic touch didn’t send Nike stock into orbit. Shocking, I know. Apparently, even the queen of shapewear can’t single-handedly inflate a multi-billion-dollar company’s share price.
But let’s take a step back—because at this price, Nike is looking very interesting.
Forget the short-term noise. Nike is still the #1 IT gear for young adults and Generation Chic. You know, the people actually setting trends and spending money:
#Rappers – Because what’s a flex without fresh kicks?
#Tech bros – Coded an app? Great. Now go drop $200 on some sneakers.
#Creatives – The artists, designers, and influencers making sure you think about buying Nikes even when you’re not.
At the end of the day, Nike isn’t just a brand—it’s a lifestyle, a uniform, a status symbol. Stocks go up and down, but when it comes to culture, Nike runs the game.
So yeah, maybe the Kim K collab didn’t ignite a moonshot. But give it time. The streets, the startups, and the studios are still rocking the Swoosh. And that’s why I’m watching.

What are Tariffs? How They Work and Why They Matter to You?For centuries, tariffs have played a crucial role in global trade, safeguarding domestic industries, shaping international relations, and influencing economic policies. While they often dominate headlines during trade wars and economic policy debates, many people still don’t fully understand what tariffs are, why they are used, and how they impact the economy.
This comprehensive guide covers:
⦿ What tariffs are and how they work
⦿ Different types of tariffs
⦿ Why governments impose tariffs
⦿ The economic, political, and social effects of tariffs.
⦿ Historical and modern examples
⦿ The debate between protectionism and free trade
⦿ Tariffs in different economic systems
⦿ The future of tariffs in a globalized world
By the end of this article, you’ll have a decent understanding of tariffs and their role in the global economy.
🤔 What Are Tariffs?
A tariff is a tax imposed by a government on imported goods and services. The primary purpose of tariffs is to increase the cost of foreign products, making domestically produced goods more attractive to consumers. This serves several economic and political functions, such as protecting domestic industries, generating government revenue, and addressing trade imbalances.
👍 How Do Tariffs Work?
A government sets a tariff rate on imported goods (e.g., 25% on foreign cars).
Importers must pay this tax when bringing goods into the country.
This increases the cost of imported goods, enhancing the competitiveness of domestic alternatives.
Domestic industries benefit from reduced foreign competition.
The government collects revenue from the tariff.
🦸♂ Who Pays the Tariff?
Importers: These businesses or individuals directly pay the tariff when they bring goods into the country. This increases their costs.
Businesses: Since importers face higher costs, businesses that rely on imported goods often pass these costs onto consumers by increasing prices.
Consumers: Ultimately, the general public bears the cost as they pay higher prices for goods affected by tariffs.
🔎 Types of Tariffs
Governments employ various tariffs depending on their economic goals and trade policies. Some of these are:
1️⃣ Ad Valorem Tariffs
An ad valorem tariff is a percentage-based tariff calculated on the value of the imported goods. The tax amount increases or decreases with the price of the product.
Example: A 10% tariff on imported TVs means a $1,000 TV incurs a $100 tariff.
Usage: Commonly used for luxury goods, automobiles, and consumer electronics.
2️⃣ Specific Tariffs
A specific tariff is a fixed fee charged per unit of imported goods, regardless of price.
Example: $3 per barrel of imported oil.
Usage: Often used for commodities like oil, wheat, and alcohol.
3️⃣ Compound Tariffs
A compound tariff includes both a percentage-based tax (Ad valorem) and a fixed fee on imports (Specific). This means importers pay a fixed fee per unit as well as a percentage of the item’s value.
Example: A 5% tax plus $2 per imported cheese wheel.
Usage: Applied to goods where both quantity and value affect the market, such as food products and industrial materials.
4️⃣ Tariff-Rate Quotas (TRQs)
A TRQ allows a limited quantity of an imported good to enter at a lower tariff rate. After the quota is reached, extra imports are taxed at a higher rate.
Example: One of the most well-known examples of a TRQ is the U.S. Sugar Tariff-Rate Quota. The United States allows a certain quantity of sugar to be imported each year at a lower tariff rate. Any sugar imports within the quota limit are subject to a low tariff (e.g., 5%).
However, once the quota is exceeded, any additional sugar imports face a much higher tariff (e.g., 20%). This system ensures that domestic sugar producers remain competitive while still allowing controlled imports to meet demand.
Another example is the European Union's TRQ on Beef Imports. The EU permits a specific amount of high-quality beef imports (e.g., from the U.S. and Canada) at a lower tariff. Once this quota is filled, any additional beef imports are taxed at a significantly higher rate. This policy helps protect EU cattle farmers while maintaining trade agreements with international suppliers.
5️⃣ Protective Tariffs
A protective tariff helps local industries by making imported goods more costly, reducing foreign competition.
Example: The U.S. imposed a 25% tariff on Chinese steel to protect domestic steel manufacturers.
Usage: Commonly used in industries facing strong foreign competition, such as steel, automotive, and textiles.
6️⃣ Revenue Tariffs
A revenue tariff is mainly designed to raise money for the government, not to shield local industries.
Example: In the 19th century, tariffs were the main source of revenue for the U.S. government before income taxes were introduced.
Usage: Often applied to goods that do not have strong domestic competition but are widely consumed, such as alcohol and tobacco.
❓ Why Do Governments Impose Tariffs?
1️⃣ Protecting Domestic Industries
Tariffs shield local businesses from cheaper foreign competitors, helping domestic industries grow.
Example: U.S. steel tariffs in 2018 benefited domestic steel manufacturers.
2️⃣ Generating Government Revenue
Before modern taxation systems, tariffs were a key source of revenue for governments.
Example: In the 1800s, tariffs accounted for 90% of U.S. federal revenue.
3️⃣ National Security Concerns
Some industries, like defense and technology, are crucial for national security, and governments impose tariffs to reduce reliance on foreign suppliers.
Example: The U.S. limits imports of rare earth minerals to ensure a domestic supply chain for defense technologies.
4️⃣ Retaliation in Trade Wars
Countries impose tariffs to address unfair trade practices or economic conflicts.
For instance, during the trade war between the United States and China, both countries imposed taxes on each other's goods
5️⃣ Preventing Dumping
Dumping occurs when a country exports goods at below-market prices to eliminate competition.
Example: The U.S. imposed tariffs on Chinese solar panels due to concerns about dumping.
⚖️ Pros and Cons of Tariffs
Pros
✅ Protects local jobs and industries
✅ Encourages domestic production
✅ Generates government revenue
✅ Enhances national security by reducing reliance on foreign goods
Cons
❌ Increases prices for consumers
❌ Can lead to trade wars and economic retaliation
❌ Encourages inefficiency in domestic industries
❌ Disrupts global supply chains
📕 Historical and Modern Examples of Tariffs
1. The Smoot-Hawley Tariff Act (1930)
The U.S. imposed tariffs on over 20k imported goods.
Result: Other countries retaliated, global trade dropped by 66%, and the Great Depression worsened.
2. Trump’s Tariffs on China (2018-2020)
The United States levied tariffs on $360 billion worth of Chinese goods.
China retaliated, affecting U.S. agriculture exports.
Result: Some U.S. industries benefited, but consumers faced higher prices.
3. The European Union’s Tariffs on U.S. Goods (2021)
The EU imposed tariffs on American whiskey, motorcycles, and jeans in response to U.S. steel tariffs.
Result: Brands like Harley-Davidson saw reduced sales in Europe.
⚙️ Tariffs vs. Free Trade: The Big Debate
The debate between tariffs and free trade is a fundamental discussion in global economics and trade policy. This debate revolves around whether governments should impose tariffs (taxes on imported goods) or embrace free trade (minimal to no restrictions on imports and exports).
◉ Free Trade (No Tariffs)
Free trade is the unrestricted movement of goods and services across borders without tariffs or other trade barriers. Advocates argue that it fosters economic efficiency and global cooperation.
✅✅ Advantages of Free Trade
Lower Prices for Consumers – Without tariffs, imported goods are cheaper, leading to more affordable products.
Increased Economic Growth – When countries trade freely, they specialize in what they do best, leading to higher productivity and economic expansion.
More Competition = Better Products – Companies must compete on quality and innovation rather than relying on government protection.
Stronger Global Relations – Open markets encourage cooperation between nations, reducing the risk of economic conflicts.
Access to More Goods and Services – Consumers enjoy a greater variety of products at lower costs.
❌❌ Disadvantages of Free Trade
Job Losses in Unprotected Industries – Domestic industries that can't compete with cheaper imports may shrink or shut down.
Dependence on Foreign Suppliers – A country may become overly reliant on other nations for essential goods (e.g., medical supplies, electronics).
Potential Trade Deficits – Countries that import more than they export may struggle with imbalances in trade.
◉ Protectionism (Using Tariffs)
Protectionism refers to economic policies that restrict imports through tariffs, quotas, or other barriers to shield domestic industries from foreign competition.
✅✅ Advantages of Tariffs
Protects Local Jobs and Industries – Domestic businesses have a better chance to compete without being undercut by cheaper imports.
Reduces Dependence on Foreign Competitors – A country can maintain its own manufacturing and production capabilities, especially in critical industries like steel, energy, and food.
Generates Government Revenue – Tariffs provide a source of income for governments, which can be reinvested in public services.
Prevents Dumping – Tariffs discourage foreign companies from flooding the market with artificially cheap goods to destroy domestic competition.
❌❌ Disadvantages of Tariffs
Higher Prices for Consumers – Since imported goods are taxed, businesses pass the extra costs to customers.
Risk of Trade Wars – When one country imposes tariffs, others retaliate, leading to economic conflicts that hurt all parties involved.
Encourages Inefficiency – Without foreign competition, domestic companies may become complacent and innovate less.
Disrupts Global Supply Chains – Many industries rely on international suppliers; tariffs can increase production costs and delays.
❇️ The Future of Tariffs in a Globalized World
As economies become more interconnected, tariffs are often seen as barriers to global trade.
Emerging industries, such as digital services, face new trade policy challenges that traditional tariffs do not cover.
With globalization, many nations favor free trade agreements (FTAs) like USMCA and the EU single market to reduce trade barriers.
Climate-related tariffs, such as carbon border taxes, may become more common as nations try to incentivize environmentally friendly trade practices.
📌 Closing Thoughts
Tariffs remain one of the most powerful - and controversial - tools in economic policy. Like a thermostat for trade, they can be adjusted to protect domestic industries, but risk overheating the economy with unintended consequences.
History shows that while tariffs can provide temporary relief for specific sectors, they often create ripple effects across the entire economy. The steel tariffs of 2018 helped some American mills reopen, but made cars and appliances more expensive for everyone.
Neither free trade nor tariffs are perfect solutions. A balanced approach, where tariffs are selectively used for strategic industries while promoting open markets in others, is often the best path.
Each country must decide based on its economic strengths and priorities. For example, developed nations might push for free trade, while developing nations use tariffs to protect growing industries.
As trade policies continue evolving, understanding tariffs gives citizens and businesses crucial insight into how globalization affects prices, jobs, and economic security. The debate isn't about whether tariffs are "good" or "bad," but rather when and how they should be used strategically.
What are your thoughts on the ongoing U.S. tariff war? Share your opinions in the comments! 📩

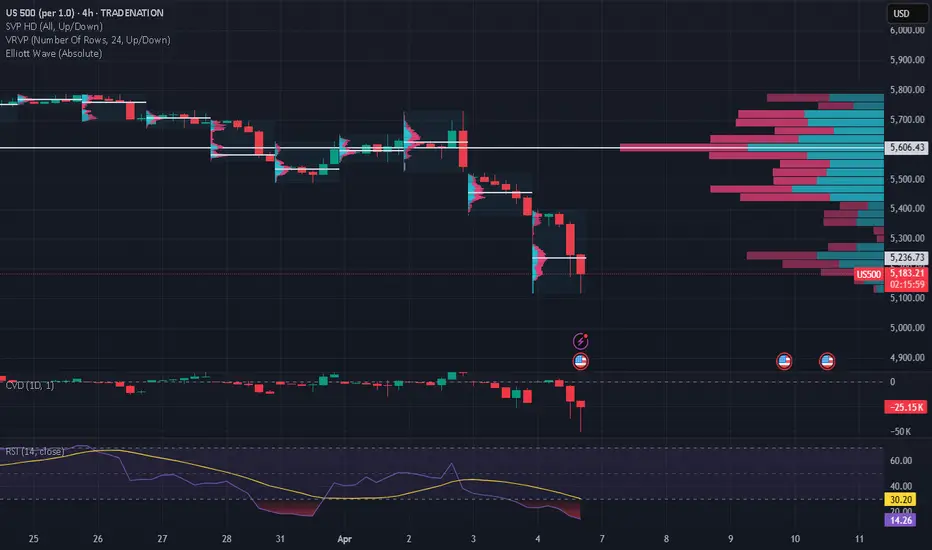
SP500 Plunges 8% in a day!! Oversold or more pain ahead?The SP500 has suffered a massive 8% drop, currently trading around 5158 at the moment, after market turmoil triggered by Trump's new tariff war. Panic selling has pushed the 30-minute RSIto an extreme oversold level of around 28, signaling potential short-term exhaustion.
Possible Scenarios:
🔹 Short-Term Bounce? The RSI suggests a possible technical rebound, with key resistance around 5200-5250 if buyers step in. Watch for volume confirmation.
🔹 Further Downside? If panic continues, the next major support lies at 5100, followed by 5000 psychological level, where institutional buyers might defend price.
⚠️ Caution: Markets remain highly volatile! A dead-cat bounce is possible, but uncertainty surrounding tariffs could fuel more downside pressure. Stay sharp!
📊 What’s Your Take? Will SP500 recover or break lower? Drop your thoughts below! 🚀🔥
#SP500 #StockMarketCrash #Tariffs #Trading #TechnicalAnalysis #RSI
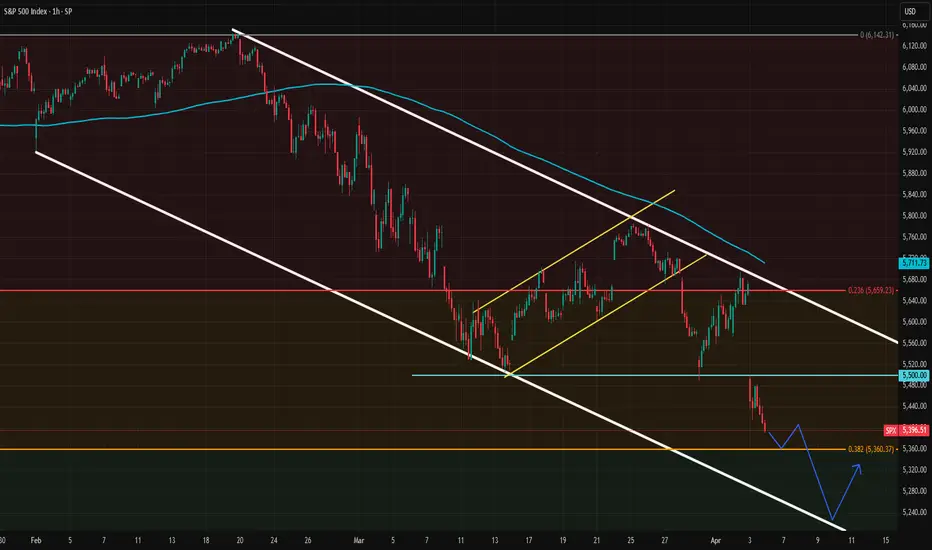
S&P 500 Faces Increased Bearish Pressure as Trade War BeginsThe S&P 500 has formed a downtrend channel following the break below the 5700 support level. Trump's new aggressive tariff policy raised the minimum tariff on China to 54%, while China responded with equally aggressive 34% tariffs. The trade war has now officially begun.
This escalation is clearly negative for the stock market. Recession risks have risen significantly, and it remains uncertain how much the Fed can cut rates while tariff-driven inflationary pressures persist. Rapid rate cuts could help soften the slowdown but may also risk fueling another inflation surge. That would be the more optimistic case for equities. However, the Fed is likely to proceed cautiously, suggesting that bearish pressure could continue for several quarters.
In the short term, the downward trend remains intact. If the S&P 500 breaks the 38.2% Fibonacci retracement level, it may decline further toward the lower boundary of the new trend channel, where a potential bounce could occur. As long as the trend holds, bears remain in control.
Note: Powell is expected to speak today. His remarks carry even more weight following the tariff moves by both the U.S. and China.
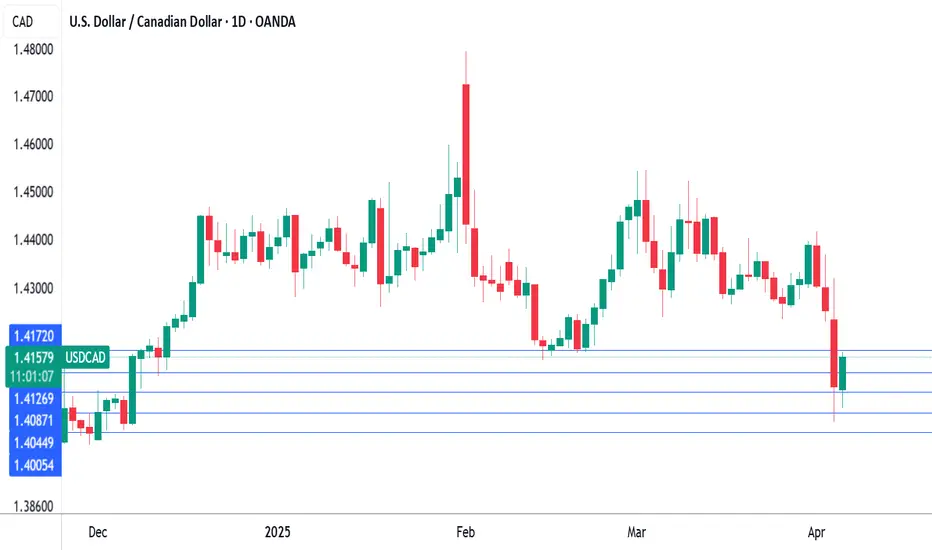
Markets eye US, Canada job reports, US dollar steadiesThe Canadian dollar has taken a break after an impressive three-day rally, in which the currency climbed about 2%. In the European session, USD/CAD is trading at 1.4148, up 0.39%. On Thursday, the Canadian dollar touched 140.26, its strongest level since December.
The hottest financial news is understandably the wave of selling in the equity markets, but there are some key economic releases today as well. The US and Canada will both release the March employment report later today.
The US releases nonfarm payrolls, with the markets projecting a gain of 135 thousand, after a gain of 151 thousand in February. This would point to the US labor market cooling at a gradual pace, which suits the Federal Reserve just fine. The Fed will also be keeping a watchful eye on wage growth, which is expected to tick lower to 3.9% y/y from 4.0%. The unemployment rate is expected to hold at 4.1%.
The employment landscape is uncertain, with the DOGE layoffs and newly-announced tariffs expected to dampen wage growth in the coming months. Canada's employment is expected to improve slightly to 12 thousand, after a negligible gain of 1.1 thousand in February. Unemployment has been stubbornly high and is expected to inch up to 6.7% from 6.6%.
US President Donald Trump's tariff bombshell on Wednesday did not impose new tariffs on Canada, but trade tensions continue to escalate between the two allies. Canada said it would mirror the US stance and impose a 25% tariff on all vehicles imported from the US that do not comply with the US-Canada-Mexico-Canada free trade deal. The US has promised to respond to any new tariffs against the US, which could mean a tit-for-tat exchange of tariffs between Canada and the US.
USD/CAD has pushed above resistance at 1.4088 and 141.26. The next resistance line is 1.4170
1.4044 and 1.4006 are the next support levels
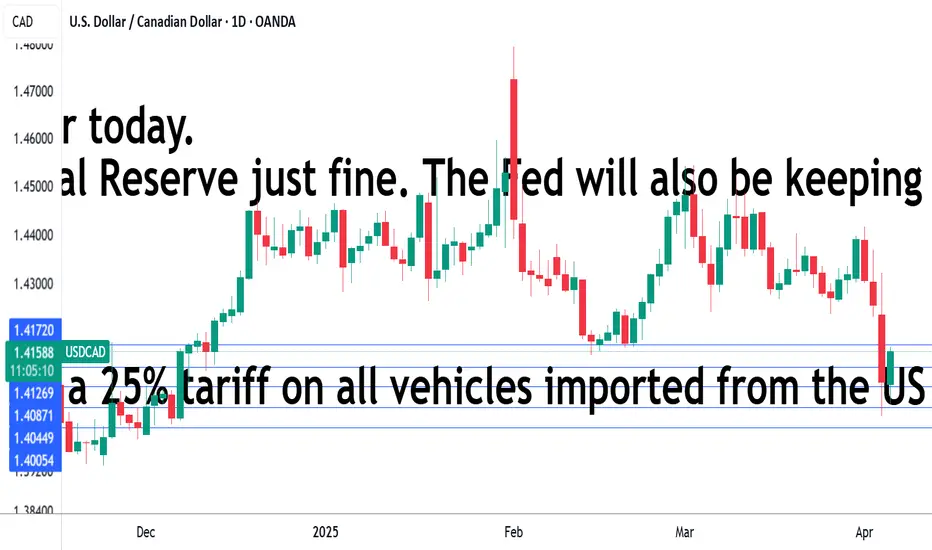
Markets eye US, Canada job reports, US dollar steadiesThe Canadian dollar has taken a break after an impressive three-day rally, in which the currency climbed about 2%. In the European session, USD/CAD is trading at 1.4148, up 0.39%. On Thursday, the Canadian dollar touched 140.26, its strongest level since December.
The hottest financial news is understandably the wave of selling in the equity markets, but there are some key economic releases today as well. The US and Canada will both release the March employment report later today.
The US releases nonfarm payrolls, with the markets projecting a gain of 135 thousand, after a gain of 151 thousand in February. This would point to the US labor market cooling at a gradual pace, which suits the Federal Reserve just fine. The Fed will also be keeping a watchful eye on wage growth, which is expected to tick lower to 3.9% y/y from 4.0%. The unemployment rate is expected to hold at 4.1%.
The employment landscape is uncertain, with the DOGE layoffs and newly-announced tariffs expected to dampen wage growth in the coming months.
Canada's employment is expected to improve slightly to 12 thousand, after a negligible gain of 1.1 thousand in February. Unemployment has been stubbornly high and is expected to inch up to 6.7% from 6.6%.
US President Donald Trump's tariff bombshell on Wednesday did not impose new tariffs on Canada, but trade tensions continue to escalate between the two allies. Canada said it would mirror the US stance and impose a 25% tariff on all vehicles imported from the US that do not comply with the US-Canada-Mexico-Canada free trade deal. The US has promised to respond to any new tariffs against the US, which could mean a tit-for-tat exchange of tariffs between Canada and the US.
USD/CAD has pushed above resistance at 1.4088 and 141.26. The next resistance line is 1.4170
1.4044 and 1.4006 are the next support levels
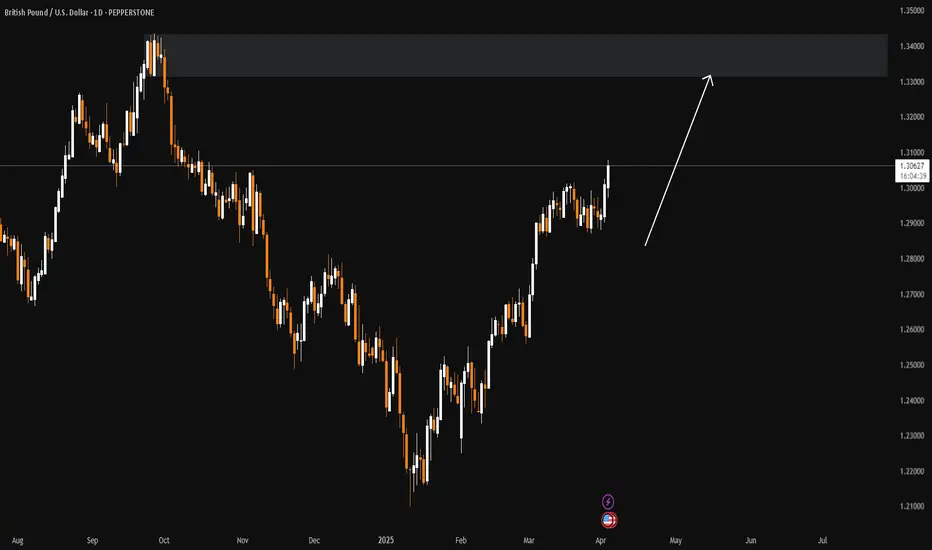
GBPUSD Discretionary Analysis: Going Up Like TariffsI’m not entirely sure, but something(or some news) tells me GBPUSD is heading up like tariffs – quick and sharp. If not, guess it got delayed at the border. Profit if I’m right, lesson if I’m wrong!
Just my opinion, not financial advice.
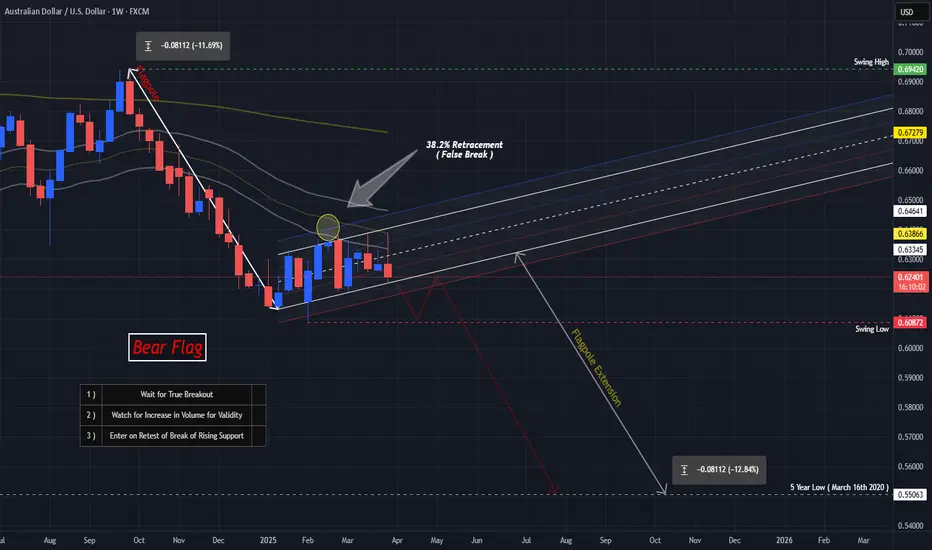
AUDUSD Bears "Flag Down" Potential OpportunitiesOn the Technical Analysis stand-point, FX:AUDUSD has been Consolidating in an Ascending Channel since the beginning of this year after having a sharp decline which started in October last year. Now the past 6 Months, Price Action seems to be forming a strong Continuation Pattern, the Bear Flag!
Based on the Retracement from the Swing High @ .6942 to the Swing Low @ .60872, Price has made a 38.2% Retracement to .64081, resulting in a False Break, pushing Price back into Pattern!
Price has been trading Under the 200 EMA since the start of the "Flagpole" and with the separation between it and the 34 EMA Band, feeds the Bearish Bias after we see Price heavily rejected after touching the 34 EMA Band!
*Once Price makes a Breakout of the Rising Support of the Channel -> Bear Flag Confirmed
*Increase in Volume after Break -> Breakout Validated
If we get a True Breakout that is Validated by the checklist of factors, we could be looking at great opportunities to take FX:AUDUSD down to the current 5 Year Low of .55063 set back in March 16th 2020 (Initial Outbreak of Covid) based on the Flagpole and Potential Extension of a Valid Break and Retest of the Bear Flag!
Now, Fundamentally what is driving the Weaker Aussie Dollar is the fear of the impact of what the US Tariffs will do to Australia's "Key Trading Partners" being China, Japan and South Korea all being high on the Reciprocal Tariff List. Because of this, the RBA has now priced in 100 Basis Points worth of Rate Cuts to come with the expectations of a "dampened broader outlook for global trade and economic growth."
tradingview.sweetlogin.com
Stay Tuned!
Is it time for a relief for the Yen?After a severe beating by the USD especially the tumultous rise inflation, Japans currency is gonna look for some relief as Tariifs will clearly lead to an economic slowdown of U.S economy, as more cheap stuff from China and the emerging market will clearly look to rise and that may weigh on consumer sentiment.
🟨 - Head abd Shoulders
🟥🔘 - Price/RSI Deviation

Ford (NYSE:F) Drop 5%+ as Tariffs Threaten Auto Industry marginsFord Motor Company (NYSE: F) is facing a challenging market environment as its stock price fell 5.27% to $9.61 as of 3:24 PM EDT. This drop comes amid declining sales and the looming threat of new tariffs from the Trump administration. In the last 52 weeks, Ford's stock has traded within a range of $9.06 to $14.85.
On Tuesday 1st April, Ford reported a 1.3% decline in total vehicle sales year-over-year, delivering 501,291 vehicles in Q1 2025. Despite this decline, retail sales rose by 5%, with a strong 19% surge in March, signaling that buyers may be accelerating purchases ahead of the impending tariffs.
General Motors (GM) posted strong results with a 17% increase in sales, delivering 693,353 vehicles in Q1 2025. The company achieved double-digit growth across all its brands, marking its best first-quarter performance since 2018. While GM shares remained stable, Ford shares saw further declines.
Tariffs Add Uncertainty for Automakers
The auto industry is preparing for the impact of a 25% tariff on foreign cars and parts. The Trump administration confirmed on Wednesday that his 25% global car and truck tariffs would take effect as scheduled on Thursday and that duties on automotive parts imports will be launched on May 3rd.
Although Ford manufactures most of its vehicles in the U.S, many essential parts are imported. Higher production costs could push car prices higher, affecting demand.
Ford executives have stated they are assessing the impact of these tariffs on their business operations. Chairman William Clay Ford Jr. assured shareholders that the company is prepared to handle geopolitical uncertainties. Despite this, investor sentiment remains cautious, contributing to the recent stock price decline.
Technical Analysis
Ford’s stock has been trading within a narrow range of $9 to $10 in the last three months. A strong resistance level at $11, tested several times from August to November 2024, remains unbroken. Since failing to break the resistance level, the stock has since then declined.
Currently, the price is testing a double support level at $9 comprising of a horizontal key support and a descending trendline. If this support holds, Ford’s stock may attempt another bull phase toward the $11 resistance level. On the other hand, a break below $9 could push the price lower, with the next potential support level at $8.45.
The 50-day, 100-day and 200-day moving averages are positioned above the current Market price, at $9.74, $10.08 and $10.70 respectively. This indicates strong bearish pressure, limiting bullish momentum in the near term.
Thoughts Moving Forward
With tariffs and the auto industry facing supply chain disruptions, Ford’s stock is likely to remain under pressure. The bearish sentiment could persist in the short term, especially if the price breaks below the key $9 support level.
If support holds, Ford could see a short-term bounce toward $11. However, sustained bullish momentum would require strong demand and improved market sentiment. This would be witnessed if its earnings report, set to be released between April 22nd and April 28th, 2025, is favorable. Until then, geopolitical and economic uncertainties weigh on the stock.

Amazon (NASDAQ: $AMZN) Drops 8% as Trump Tariffs Shake Markets. Amazon (NASDAQ: NASDAQ:AMZN ) is facing huge downward pressure following President Donald Trump's announcement of sweeping tariffs. The stock dropped 9.26% in early trading, reaching $176.92 as of 11:01 AM EDT.
These tariffs impact over 100 countries, including China, a key supplier for third-party merchants on Amazon’s platform. Rising import costs could push prices higher, affecting consumer spending and Amazon’s profit margins.
Looking at the broader market, it is also struggling from the tariffs. The Magnificent Seven stocks, including Apple, Nvidia, Meta, Tesla, Alphabet, Microsoft, and Amazon, have all seen huge drops.
Amazon’s 8% drop is among the largest, further highlighting its vulnerability to trade disruptions. If these tariffs persist, they could reignite inflation, weigh on economic growth and further impact stock prices. Amazon has faced major market shifts in the past. In 2022, its stock lost over 50% of its value within a few quarters.
The question now is, can the current decline lead to similar losses?
With Amazon trading at $242 in February, some fear it could drop below $120 if the economic outlook worsens.
Adding to concerns, geopolitical risks remain high. The ongoing war in Ukraine, coupled with uncertainty over future U.S policies, creates a volatile environment for stocks. Amazon’s reliance on global supply chains and consumer spending makes it highly sensitive to market shocks.
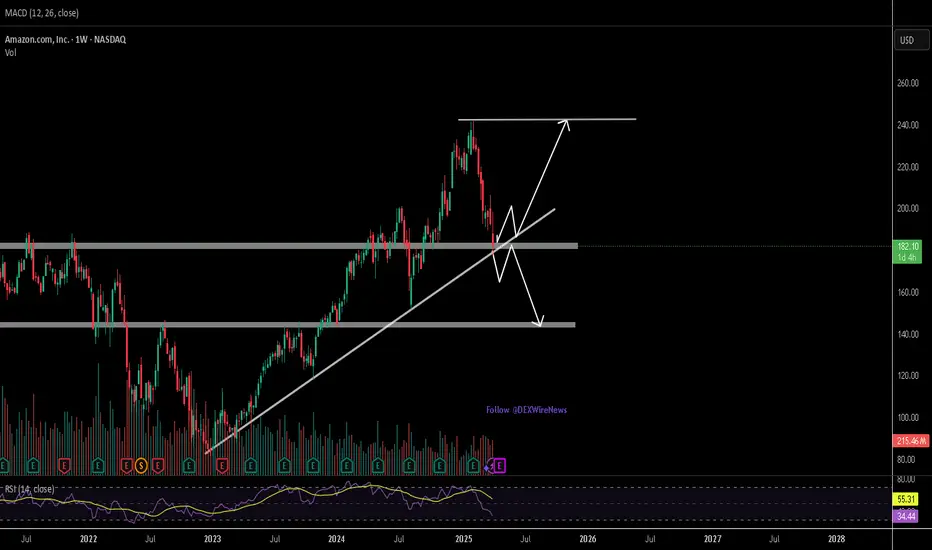
Technical Analysis
Looking at Amazon technically, there has been a downtrend since early February when it reached an all-time high and a 52-week high of $242. This peak came shortly after the presidential inauguration, but since then, the market conditions have not been favorable. The introduction of new tariffs has fueled bearish momentum, pushing Amazon lower toward key support levels.
Currently, the stock is testing a double support level, an ascending trendline and a horizontal support around $180. If buyers step in at this level, a rebound could occur, targeting the previous $252 all-time high. However, given the economic uncertainty, there is a strong chance the stock may break below this current support.
If the weekly candle closes strongly below the $180 level, the next critical point where the stock might find support is around $144. This area has historically provided strong buying interest and it may serve as a potential bottom if the decline continues.
Looking at momentum indicators, the weekly RSI currently sits at 33, indicating strong bearish momentum. Despite the reading approaching the oversold reading, macroeconomic data shows the downtrend remains dominant and further losses could be ahead.
What's the Outlook? Can Amazon Recover Soon?
The coming weeks will be crucial for Amazon’s stock. With earnings expected between April 28th and May 2nd, market sentiment may shift based on revenue growth and profit margins. However, ongoing trade uncertainties and rising costs remain key risks.
For now, monitor price action around the current market price of $180. A strong bullish move could confirm a short-term recovery. On the other side, a break below this double support level may signal a further drop towards $144 support level.
Trump's Tariff Wars : What To Expect And How To Trade Them.I promised all of you I would create a Trump's Tariff Wars video and try to relate that is happening through the global economy into a rational explanation of HOW and WHY you need to be keenly away of the opportunities presented by the new Trump administration.
Like Trump or not. I don't care.
He is going to try to enact policies and efforts to move in a direction to support the US consumer, worker, business, and economy.
He made that very clear while campaigning and while running for office (again).
This video looks at the "free and fair" global tariffs imposed on US manufacturers and exports by global nations over the past 3+ decades.
For more than 30+ years, global nations have imposed extreme tariffs on US goods/exports in order to try to protect and grow their economies. The purpose of these tariffs on US good was to protect THEIR workers/population, to protect THEIR business/economy, to protect THEIR manufacturing/products.
Yes, the tariffs they imposed on US goods was directly responsible for THEIR economic growth over the past 30-50+ years and helped them build new manufacturing, distribution, consumer engagement, banking, wealth, and more.
The entire purpose of their tariffs on US goods was to create an unfair advantage for their population to BUILD, MANUFACTURE, and BUY locally made products - avoiding US products as much as possible.
As I suggested, that is why Apple, and many other US manufacturers moved to Asia and overseas. They could not compete in the US with China charging 67% tariffs on US goods. So they had to move to China to manufacture products because importing Chinese-made products into the US was cheaper than importing US-made products into China.
Get it?
The current foreign Tariffs create an incredibly unfair global marketplace/economy - and that has to STOP (or at least be re-negotiated so it is more fair for everyone).
And I believe THAT is why Trump is raising tariffs on foreign nations.
Ultimately, this will likely be resolved as I suggest in this video (unless many foreign nations continue to raise tariff levels trying to combat US tariffs).
If other foreign nation simply say, "I won't stand for this, I'm raising my tariff levels to combat the new US tariffs", then we end up where we started - a grossly unfair global marketplace.
This is the 21st century, not the 18th century.
Step up to the table and realize we are not in the 1850s or 1950s any longer.
We are in 2025. Many global economies are competing at levels nearly equal to the US economy in terms of population, GDP, manufacturing, and more.
It's time to create a FREE and FAIR global economy, not some tariff-driven false economy on the backs of the US consumers. That has to end.
Get some.
#trading #research #investing #tradingalgos #tradingsignals #cycles #fibonacci #elliotwave #modelingsystems #stocks #bitcoin #btcusd #cryptos #spy #gold #nq #investing #trading #spytrading #spymarket #tradingmarket #stockmarket #silver
