Smart Liquidity in TradingIntroduction: What Is Smart Liquidity in Trading?
Liquidity is the backbone of financial markets—it refers to how easily assets can be bought or sold without causing drastic price changes. But as markets have evolved with the rise of algorithmic trading, decentralized finance (DeFi), and AI, a more sophisticated concept has emerged: Smart Liquidity.
Smart Liquidity isn’t just about having buyers and sellers in a market. It’s about efficient, dynamic, and intelligent liquidity—where technology, data, and algorithms converge to improve how trades are executed, how markets function, and how risks are managed. Whether in traditional stock markets, forex, or blockchain-based platforms, smart liquidity is now central to modern trading strategies.
Chapter 1: Understanding Traditional Liquidity
Before diving into smart liquidity, let's revisit the basics of traditional liquidity:
Bid-Ask Spread: A narrow spread indicates high liquidity; a wide one shows low liquidity.
Market Depth: The volume of orders at different price levels.
Turnover Volume: How frequently assets are traded.
Price Impact: How much a large order moves the price.
In traditional finance, liquidity providers (LPs) include:
Market makers
Banks and financial institutions
High-frequency trading firms
Exchanges
Liquidity ensures:
Stable pricing
Smooth trade execution
Lower transaction costs
Chapter 2: The Evolution Toward Smart Liquidity
What Changed?
Algorithmic Trading: Algorithms can detect, provide, or withdraw liquidity in milliseconds.
Decentralized Finance (DeFi): Smart contracts offer on-chain liquidity pools without intermediaries.
AI & Machine Learning: Predictive models can identify where liquidity is needed or likely to shift.
Smart Order Routing (SOR): Optimizes trade execution by splitting orders across multiple venues.
These technologies gave rise to “smart liquidity,” where liquidity is not static but adaptive, context-aware, and real-time optimized.
Chapter 3: Components of Smart Liquidity
1. Liquidity Intelligence
Advanced analytics track:
Market depth across exchanges
Order flow trends
Latency and slippage statistics
Arbitrage opportunities
This helps institutions dynamically manage their liquidity strategies.
2. Smart Order Routing (SOR)
SOR systems:
Automatically split large orders across venues
Route based on fees, liquidity, latency, and execution quality
Reduce market impact and slippage
SOR is key in both equity and crypto markets.
3. Algorithmic Liquidity Providers
Market-making bots adjust quotes in real-time based on:
Volatility
News sentiment
Volume spikes
Risk exposure
They enhance liquidity without manual intervention.
4. Automated Market Makers (AMMs)
Used in DeFi:
No traditional order book
Prices determined algorithmically via a liquidity pool
Traders interact with pools, not people
Popular AMMs: Uniswap, Curve, Balancer.
Chapter 4: Use Cases of Smart Liquidity
1. HFT Firms and Institutions
Use predictive liquidity models
Deploy SOR to reduce costs and slippage
Balance exposure across markets
2. Retail Traders
Benefit from tighter spreads and faster execution
Use platforms with AI-driven order matching
3. Decentralized Finance (DeFi)
Anyone can provide liquidity and earn fees
Smart liquidity enables 24/7 trading with no intermediaries
New protocols optimize capital allocation via auto-rebalancing
4. Stablecoin & Forex Markets
Smart liquidity ensures 1:1 peg stability
Algorithms prevent arbitrage imbalances
Chapter 5: Key Metrics to Measure Smart Liquidity
Metric Description
Slippage Difference between expected and actual execution price
Spread Efficiency How close bid-ask spreads are to theoretical minimum
Fill Rate How much of an order is filled without delay or rerouting
Market Impact Price movement caused by a trade
Liquidity Utilization How efficiently capital is allocated across pairs/assets
Latency Time taken from order input to execution
These metrics help evaluate the quality of liquidity provided.
Chapter 6: Risks and Challenges of Smart Liquidity
Despite its benefits, smart liquidity isn’t perfect.
1. Flash Crashes
Caused by sudden withdrawal of liquidity bots
Example: 2010 Flash Crash in U.S. equities
2. Manipulation Risks
Predatory algorithms can spoof or bait other traders
"Liquidity mirages" trick algorithms
3. Smart Contract Failures (DeFi)
Vulnerabilities in AMMs can drain entire liquidity pools
Hacks like those on Curve and Poly Network show smart liquidity can be fragile
4. Impermanent Loss (DeFi)
LPs may lose value if asset prices diverge significantly
Complex math and simulations needed to manage it
5. Regulatory Uncertainty
Especially in crypto, regulators still debating on decentralized liquidity protocols
Conclusion
Smart liquidity represents the next evolution of market infrastructure. It's not just about having capital in the market—it's about how that capital moves, adapts, and executes.
From hedge funds deploying intelligent routing systems to DeFi users earning yields through AMMs, smart liquidity touches every corner of modern finance. As technology continues to mature, expect liquidity to become even more predictive, responsive, and intelligent—unlocking a new level of speed, precision, and access for traders around the world.
Tatamotors
Option Chain AnalysisTable of Contents
Introduction to Option Chain
What Is an Option Chain?
Key Components of an Option Chain
Call vs. Put Options in the Chain
How to Read an Option Chain
Open Interest (OI) Analysis
Implied Volatility (IV) Analysis
Strike Price Selection
Support and Resistance Levels from Option Chain
Option Chain for Intraday & Swing Trading
1. Introduction to Option Chain
In the world of options trading, success is not just about buying calls or puts randomly—it’s about understanding market data. One of the most important tools for analyzing this data is the Option Chain. Whether you're a beginner or an advanced trader, mastering option chain analysis can help you identify market sentiment, key levels, and trading opportunities.
2. What Is an Option Chain?
An Option Chain, also known as an Options Matrix, is a tabular representation of all available option contracts (both Call and Put) for a particular underlying asset—like Nifty, Bank Nifty, Reliance, TCS, etc.—for a specific expiry date.
It shows:
Strike prices
Premiums (Prices)
Open interest (OI)
Volume
Implied volatility (IV)
Bid/ask prices
Think of it like a menu card for options, showing all the possible trades you can take, and key stats about each.
3. Key Components of an Option Chain
✅ Strike Price:
The price at which you can buy (Call) or sell (Put) the underlying asset.
✅ Premium (LTP):
The last traded price (LTP) of the option.
✅ Open Interest (OI):
The number of open contracts for a strike price. Indicates trader interest.
✅ Change in OI:
The change in open positions compared to the previous day.
✅ Volume:
The number of contracts traded in the current session.
✅ Implied Volatility (IV):
Market's expected volatility of the underlying asset.
4. Call vs. Put Options in the Chain
In every option chain, you’ll see two sections:
Call Options (Left side) Put Options (Right side)
Bullish expectation Bearish expectation
Buy if expecting upside Buy if expecting downside
Sell if expecting sideways/down Sell if expecting sideways/up
Usually, the middle column contains strike prices, with Call data on the left and Put data on the right.
5. How to Read an Option Chain
Let’s take an example:
Assume Nifty is trading at 22,200. You look at the Nifty option chain.
You’ll see multiple rows of strike prices (e.g., 22,000, 22,100, 22,200…) and for each, data like LTP, OI, IV.
Look for:
ATM (At-the-money): Closest strike to the current price (22,200).
ITM (In-the-money): For calls, strikes < spot; for puts, strikes > spot.
OTM (Out-of-the-money): For calls, strikes > spot; for puts, strikes < spot.
Example:
22,200 is ATM.
22,100 Call is ITM.
22,300 Call is OTM.
6. Open Interest (OI) Analysis
OI is one of the most powerful indicators in option chain analysis. It shows where traders are placing their bets.
✔️ What to Look For:
High OI = Strong interest at that strike.
Increase in OI = New positions being added.
Decrease in OI = Positions being closed.
✔️ Interpretations:
High OI in Call → Resistance level.
High OI in Put → Support level.
Let’s say:
22,500 Call has 30 lakh OI → Strong resistance.
22,000 Put has 35 lakh OI → Strong support.
This gives you the trading range of Nifty: 22,000 to 22,500.
7. Implied Volatility (IV) Analysis
IV represents the market's future expectations of volatility. Higher IV means higher premiums.
✔️ Why IV Matters:
When IV is high, options are expensive.
When IV is low, options are cheaper.
✔️ Practical Use:
Sell options when IV is very high (premium is inflated).
Buy options when IV is low (premium is cheap).
8. Strike Price Selection
Choosing the right strike is key for successful trading.
✔️ For Buying Options:
Buy slightly ITM for better delta and time value.
ATM works for short-term, fast movements.
✔️ For Selling Options:
Sell OTM options with high OI and low IV.
✔️ Tip:
Always check the OI and IV before choosing a strike. Avoid illiquid strikes (with low OI or volume).
9. Support and Resistance Levels from Option Chain
You can spot support and resistance based on OI data.
✔️ Support:
Strike where Put OI is highest.
E.g., 22,000 Put with highest OI = Support zone.
✔️ Resistance:
Strike where Call OI is highest.
E.g., 22,500 Call with highest OI = Resistance zone.
This helps you create a trading range.
10. Option Chain for Intraday & Swing Trading
✅ Intraday Trading:
Watch change in OI during live market.
Spike in Call OI → Possible resistance forming.
Spike in Put OI → Possible support forming.
✅ Swing Trading:
Analyze overall OI trend.
Look at monthly expiry data.
Identify positional buildup or unwinding.
Basics of Options: Calls and PutsWhat are Options?
An option is a financial contract that gives the buyer the right, but not the obligation, to buy or sell an underlying asset (like a stock or index) at a specific price, on or before a specific date.
Think of it like booking a movie ticket. You reserve the right to watch a movie at a particular time and seat. But if you don’t go, it’s your choice. You lose the ticket price (premium), but you're not forced to go. Options work similarly.
Options are of two basic types:
Call Option
Put Option
Let’s break both down in detail.
1. What is a Call Option?
A Call Option gives the buyer the right (but not the obligation) to buy the underlying asset at a pre-decided price (called the strike price) on or before a certain date (called the expiry date).
When do traders buy a Call Option?
When they believe the price of the underlying stock or index will go up in the future.
Example of Call Option (Simple Case)
Let’s say you are bullish on Reliance Industries stock, which is currently trading at ₹2,500.
You buy a Call Option with:
Strike Price: ₹2,550
Premium Paid: ₹30 per share
Lot Size: 250 shares
Expiry: Monthly expiry (say end of the month)
You believe Reliance will go up beyond ₹2,550 soon. If it goes to ₹2,600 before expiry:
Your profit per share = ₹2,600 (market price) - ₹2,550 (strike price) = ₹50
Net Profit = ₹50 - ₹30 (premium) = ₹20 per share
Total Profit = ₹20 x 250 = ₹5,000
But if Reliance stays below ₹2,550, say at ₹2,500 on expiry, you won’t exercise the option. You lose only the premium (₹30 x 250 = ₹7,500).
Key Terminologies in Call Options
In the Money (ITM): When the stock price is above the strike price.
At the Money (ATM): When the stock price is equal to the strike price.
Out of the Money (OTM): When the stock price is below the strike price.
2. What is a Put Option?
A Put Option gives the buyer the right (but not the obligation) to sell the underlying asset at a pre-decided price (strike price) on or before the expiry.
When do traders buy a Put Option?
When they believe the price of the underlying stock or index will fall in the future.
Example of Put Option (Simple Case)
Assume HDFC Bank is trading at ₹1,600. You are bearish and expect it to fall.
You buy a Put Option with:
Strike Price: ₹1,580
Premium: ₹20 per share
Lot Size: 500 shares
Expiry: Monthly
If HDFC Bank falls to ₹1,520:
You can sell at ₹1,580 even though market price is ₹1,520
Gross profit per share = ₹60
Net profit = ₹60 - ₹20 = ₹40 per share
Total profit = ₹40 x 500 = ₹20,000
If HDFC stays above ₹1,580, your put expires worthless. You lose only the premium (₹10,000).
Key Terminologies in Put Options
In the Money (ITM): Stock price below strike price.
At the Money (ATM): Stock price = strike price.
Out of the Money (OTM): Stock price above strike price.
Who are the Two Parties in an Option Contract?
1. Option Buyer (Holder)
Pays the premium
Has rights, but not obligations
Can exercise the option if profitable
Loss is limited to the premium paid
2. Option Seller (Writer)
Receives the premium
Has obligation to fulfill the contract if the buyer exercises
Risk is unlimited for call writers and limited for put writers (if stock price becomes zero)
Profit is limited to the premium received
Difference between Call and Put Options (Summary Table)
Feature Call Option Put Option
Buyer’s Expectation Bullish (price will go up) Bearish (price will go down)
Right Buy at strike price Sell at strike price
Profit Potential Unlimited Limited (until price reaches zero)
Risk (for buyer) Limited to premium Limited to premium
Seller’s Role Sells call & hopes price won’t rise Sells put & hopes price won’t fall
Premium and What Influences It?
The premium is the price you pay to buy an option. This is influenced by:
Intrinsic Value: Difference between market price and strike price
Time Value: More days to expiry = higher premium
Volatility: Higher the volatility = higher the premium
Interest Rates and Dividends
What is Strike Price and Expiry?
Strike Price: The price at which you can buy (call) or sell (put) the underlying stock
Expiry: The last date till which the option is valid. In India:
Weekly expiry for Nifty, Bank Nifty, and FINNIFTY
Monthly expiry for stocks
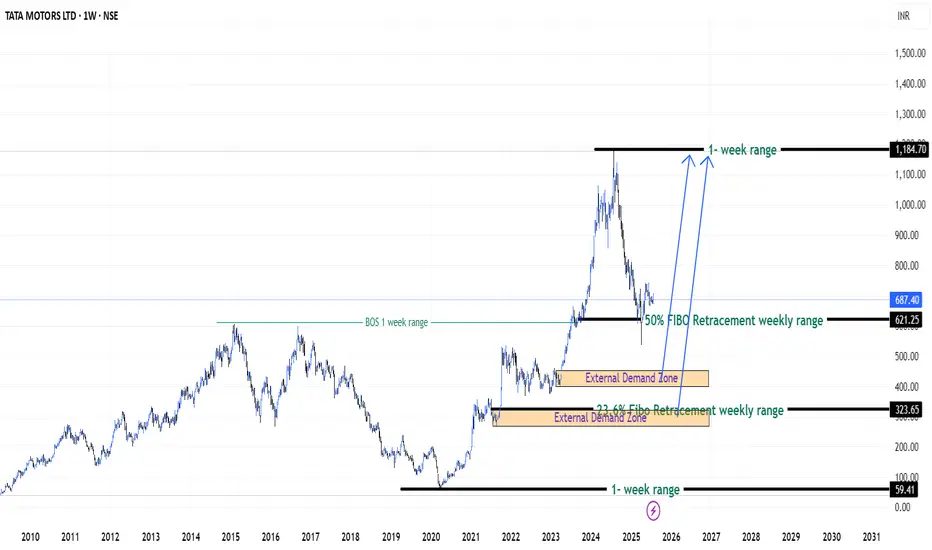
Patience on Tata Motors Stock (India) - {27/07/2025}Educational Analysis says that Tata Motors (Indian Stock) may give trend Trading opportunities from this range, according to my technical analysis.
Broker - NA
So, my analysis is based on a top-down approach from weekly to trend range to internal trend range.
So my analysis comprises of two structures: 1) Break of structure on weekly range and 2) Trading Range to fill the remaining fair value gap
Let's see what this Stock brings to the table for us in the future.
DISCLAIMER:-
This is not an entry signal. THIS IS FOR EDUCATIONAL PURPOSES ONLY.
I HAVE NO CONCERNS WITH YOUR PROFITS OR LOSS,
Happy Trading,
Stocks & Commodities TradeAnalysis.
My Analysis is:-
Short term trend may be go to the external demand zone.
Long term trend breaks the new high after going from discount zone.
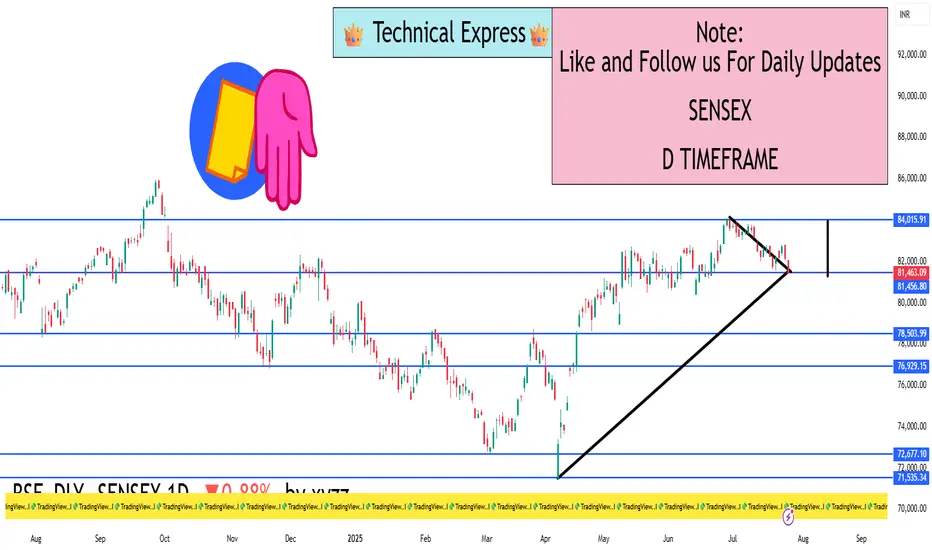
SENSEX 1D Timeframe📉 SENSEX Daily Overview (as of July 25, 2025)
Current Price: Around 81,460
Daily Change: Down by approximately 720 points (–0.9%)
Day’s High: About 82,070
Day’s Low: About 81,400
Previous Close: Around 82,184
📊 1-Day Candlestick Analysis
The candle for today is bearish, indicating strong selling pressure.
The price opened near previous levels but faced resistance at around 82,000.
Sellers dominated most of the day, pushing the index toward the 81,400 support zone.
🔍 Key Support and Resistance Levels
Level Type Price Range
Resistance 82,000 – 82,200
Support 81,400 – 81,000
If Sensex breaks below 81,400, the next target could be around 80,500 or 79,900.
If it holds above support and bounces, it could retest 82,200.
🧠 Technical Trend Analysis
Short-Term Trend: Bearish
Medium-Term Trend: Neutral to mildly bullish (as long as above 80,000)
Market Structure: Lower highs forming, suggesting pressure building on bulls
Indicators (assumed):
RSI may be approaching oversold
MACD likely showing bearish crossover
Volume increasing on red candles—indicating strong sell interest
📌 Sentiment & Market Context
Financial stocks (like banking, NBFCs) are under pressure.
Global cues (such as interest rate uncertainty and geopolitical concerns) are impacting investor confidence.
FII outflows and weak earnings in key sectors are adding to bearish momentum.
The broader trend remains range-bound, but with short-term downside bias.
✅ Strategy Suggestions (For Traders & Investors)
Swing Traders: Wait for a reversal candle (like a bullish engulfing or hammer) before considering long positions.
Breakout Traders: Watch for breakdown below 81,000 for continuation of the fall.
Positional Traders: Can wait to enter near 80,000–79,500 if the market holds that key level.
🔄 Summary
SENSEX is under pressure with a drop of 720+ points.
Technical structure suggests caution, especially if 81,000 breaks.
Support: 81,000 – 80,500
Resistance: 82,000 – 82,200
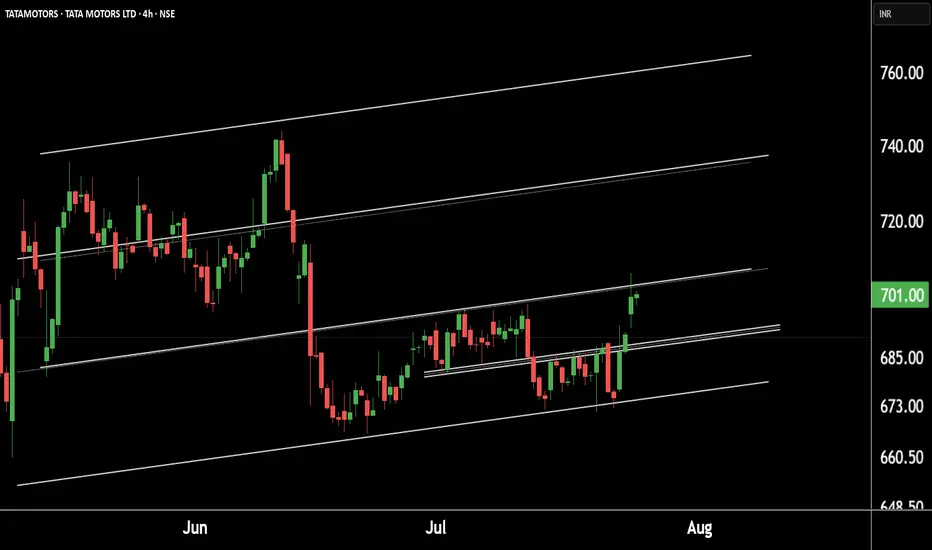
Tata Motors Gearing Up for a Fresh Rally! Technical Breakout !!This is the 4 hour chart of tata motor.
Tatamotor is moving in well defined parallel channel and bounced from it's supportt level near at 680, now ready for the breakout level at 705 .
If this level is sustain after the breakout then , we will see higher price in Tata motor.
Thank you !!
Tata Motors: From Profit Pressure to Growth Potential... Company Overview
* Name: Tata Motors Ltd.
* Industry: Automotive
* Key Segments: Passenger Vehicles (PV), Commercial Vehicles (CV), Electric Vehicles (EV), Jaguar Land Rover (JLR)
* FY25 Milestone: The Automotive business became debt-free
Q4 FY25 Performance Overview
* Net Profit: ₹8,556 crore (Down 51% YoY)
* Reason for Decline:
* High base due to deferred tax benefit in Q4 FY24
* Lower domestic volumes in PV and CV segments
* Reduced operating leverage amid falling demand
* Revenue: Marginal YoY increase (Consolidated revenue at record level for FY25)
* Positive Developments Despite Profit Decline :
* JLR Profitability Improvement
* Profit rose despite slightly lower revenue
* Supported by higher volumes and reduced depreciation
* Debt-Free Automotive Division:
* Major financial milestone for FY25 :
* Record Annual Revenue:
* Highest consolidated revenue in Tata Motors' history
* Future-Focused Investments:
* Capital allocation towards EVs, new product development, and manufacturing capacity
Strategic Growth Drivers – Reasons for Optimism
1. Electric Vehicle (EV) Leadership
* Tata Motors holds a dominant position in India’s EV market
* Plans to launch 10 EV models by 2026
* Battery Gigafactory is expected to begin production in 2026
* Strong alignment with India’s clean mobility goals
2. Expanding Product Portfolio
* Focused on SUV and ₹10–20 lakh price segments
* Upcoming launches:
* Curvv EV
* Harrier EV
* Sierra EV
* Strategy to cater to diverse customer preferences
3. Improving Financial Health
* Targeting 10% EBITDA across PV and EV divisions
* Demerger of CV and PV businesses to streamline operations and unlock value
4. Strong Base in Commercial Vehicles
* Market leader with 37.83% share in EV segment
* CV recovery is expected with infrastructure and rural demand growth
5. Supportive Macroeconomic and Policy Environment
* Government incentives: FAME II, PLI scheme
* EV-friendly policies encouraging domestic manufacturing
* Economic tailwinds: rising disposable income, urbanization, rural penetration
Risks and Challenges Ahead
* Intensifying Competition:
* Pressure from Maruti Suzuki, Hyundai, and new players
* Global Geopolitical and Trade Risks:
* US tariffs, material shortages (e.g., rare earths for EVs)
* Domestic Demand Slowdown:
* Inflation and high interest rates are affecting affordability
* Jaguar Land Rover’s Transition Challenges:
* EV transformation complexity
* Global demand volatility
* Production ramp-up hurdles
Conclusion
Tata Motors is at a pivotal juncture. While short-term profitability has taken a hit due to exceptional prior-year gains and cyclical volume pressures, the company’s fundamentals remain strong. Its leadership in EVs, ambitious expansion plans, and a now debt-free automotive business position it for long-term success.
However, realizing this potential depends on:
* Execution of its EV roadmap
* Sustained domestic demand
* Managing global uncertainties
* Staying competitive in an evolving auto landscape
Strategic Verdict:
Short-term caution, long-term confidence.
Tata Motors appears well-poised for a resilient comeback, driven by structural transformation and market-aligned growth strategies.
Sector Rotation Strategy🌐 Sector Rotation Strategy: A Smart Way to Stay Ahead in the Stock Market
What Is Sector Rotation?
Imagine you're playing cricket. Some players shine in certain conditions — like a fast bowler on a bouncy pitch or a spinner on a turning track. The same idea applies to stock market sectors.
Sector Rotation is the process of shifting your money from one sector to another based on the market cycle, economic trends, or changing investor sentiment.
In simple words:
"You’re moving your money where the action is."
First, What Are Sectors?
The stock market is divided into different sectors, like:
Banking/Financials – HDFC Bank, Kotak Bank, SBI
IT– Infosys, TCS, Wipro
FMCG – HUL, Nestle, Dabur
Auto – Maruti, Tata Motors
Pharma – Sun Pharma, Cipla
Capital Goods/Infra – L&T, Siemens
PSU – BEL, BHEL, HAL
Real Estate, Metals, Energy, Telecom, etc.
Each sector behaves differently at various stages of the economy.
Why Is Sector Rotation Important?
Because all sectors don’t perform well all the time.
For example:
In a bull market, sectors like Auto, Capital Goods, and Infra usually lead.
During slowdowns, investors run to safe havens like FMCG and Pharma.
When inflation or crude oil rises, energy stocks tend to do better.
When interest rates drop, banking and real estate might shine.
So, instead of holding poor-performing sectors, smart investors rotate into the hot ones.
How Does Sector Rotation Work?
Let’s say you are an investor or trader.
Step-by-step guide:
Track the economy and markets
Is GDP growing fast? = Economy expanding
Are interest rates high? = Tight liquidity
Is inflation cooling down? = Growth opportunity
Observe sectoral indices
Check Nifty IT, Nifty Bank, Nifty FMCG, Nifty Pharma, etc.
See which are outperforming or lagging.
Watch for news flow
Budget announcements, RBI policy, global cues, crude oil prices, etc.
E.g., Defence orders boost PSU stocks like BEL or HAL.
Move your capital accordingly
If Infra and Capital Goods are breaking out, reduce exposure in IT or FMCG and rotate into Infra-heavy stocks.
Real Example (India, 2024–2025)
Example: Rotation from IT to PSU & Infra
In late 2023, IT stocks underperformed due to global slowdown and US recession fears.
Meanwhile, PSU and Infra stocks rallied big time because:
Government increased capital expenditure.
Defence contracts awarded.
Railway budget saw record allocations.
So, many smart investors rotated out of IT and into:
PSU Stocks: RVNL, BEL, HAL, BHEL
Capital Goods/Infra: L&T, Siemens, ABB
Railway Stocks: IRFC, IRCTC, Titagarh Wagons
This sector rotation gave 30%–100% returns in a few months for many stocks.
Tools You Can Use
Sectoral Charts on TradingView / Chartink / NSE
Use indicators like RSI, MACD, EMA crossover.
Compare sectors using “Relative Strength” vs Nifty.
Economic Calendar
Track RBI policy, inflation data, IIP, GDP, etc.
News Portals
Moneycontrol, Bloomberg, ET Markets, CNBC.
FIIs/DII Activity
Where the big money is going – this matters!
Sector Rotation Heatmaps
Some platforms show weekly/monthly performance of sectors.
📈 Sector Rotation Strategy for Traders
For short-term traders (swing/intraday):
Rotate into sectors showing strength in volumes, price action, breakouts.
Use tools like Open Interest (OI) for sector-based option strategies.
Example:
On expiry weeks, if Bank Nifty is showing strength with rising OI and volume, rotate capital into banking-related trades (Axis, ICICI, SBI).
Sector Rotation for Long-Term Investors
For investors, sector rotation can be used:
To reduce drawdowns.
To book profits and re-enter at better levels.
To ride economic trends.
Example:
If you had exited IT in late 2022 after a rally, and entered PSU stocks in early 2023, your portfolio would’ve seen better growth.
Pros of Sector Rotation
Better returns compared to static investing
Helps avoid underperforming sectors
Takes advantage of macro trends
Works in both bull and bear markets
Cons or Risks
Requires monitoring and active management
Timing the rotation is difficult
Wrong rotation = underperformance
May incur tax if frequent buying/selling (for investors)
Pro Tips
Don't rotate too fast; let the trend confirm.
Use SIPs or staggered entry in new sectors.
Avoid “hot tips”; follow actual price and volume.
Blend sector rotation with strong stock selection (don’t just chase sector).
Conclusion
The Sector Rotation Strategy is one of the smartest, most practical tools used by both traders and investors. You don’t need to be a pro to use it — just stay alert to the market mood, economic cycles, and where the money is moving.
Think of it as dancing with the market:
“When the music changes, you change your steps.”
Keep rotating. Keep growing.
Institutional Trading Process 1. Investment Idea Generation
This is where it all begins.
Institutions generate trading ideas based on:
Fundamental research (company earnings, macroeconomic data)
Quantitative models (statistical or algorithmic strategies)
Technical analysis (price action, trends, volume)
Sentiment analysis (news flow, social media, market psychology)
Often, the research team, quant team, or portfolio managers work together to develop high-conviction trade ideas backed by data and analysis.
2. Pre-Trade Analysis and Risk Assessment
Before placing a trade, institutions perform:
Risk/reward analysis
Scenario testing (How does the trade perform in different market conditions?)
Volatility analysis
Position sizing based on portfolio risk budget
TATAMOTORSi Observed these Levels based on Price Action and Demand & Supply which is my own Concept "PENDAM CONCEPTS"... Please don't take any trades based on this chart/post... Because this chart is for educational purpose only not for Buy or Sell Recommendation... Thank Q
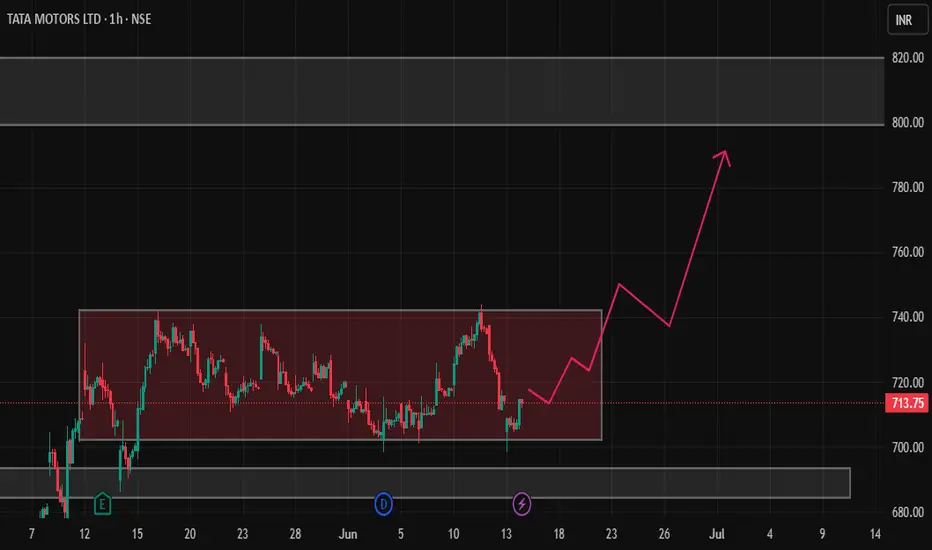
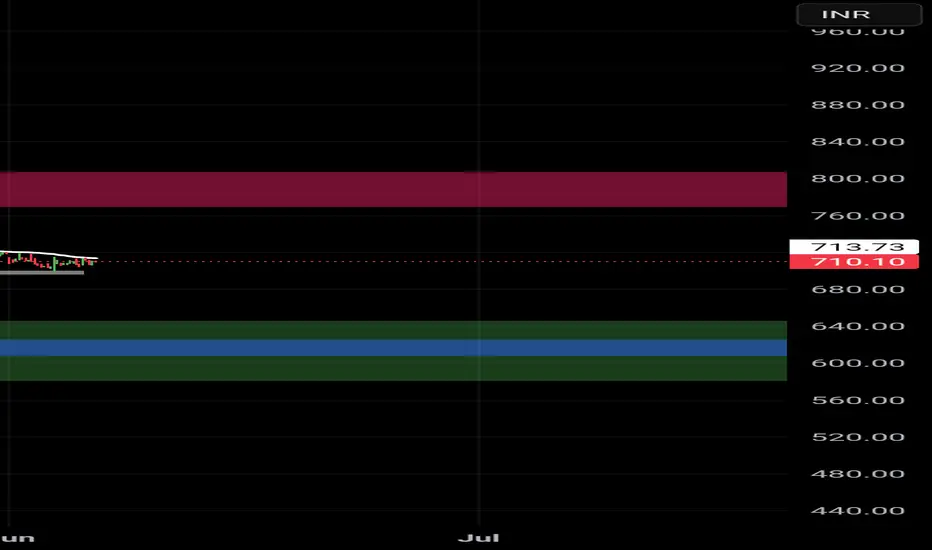
Buy the Dip: Tata Motors Set to Zoom from ₹713 to ₹799!Consider buying Tata Motors stock below ₹713 with a long-term target of ₹799, offering a potential profit of approximately 12%.
TataMotors Time To BoostTataMotors Recently Touched Day 1 Timeframe Demand Zone And In Previous He Also Touched Monthly / Quarterly Demand Zone So Trend Is UP Perfect Swing Trading Setup
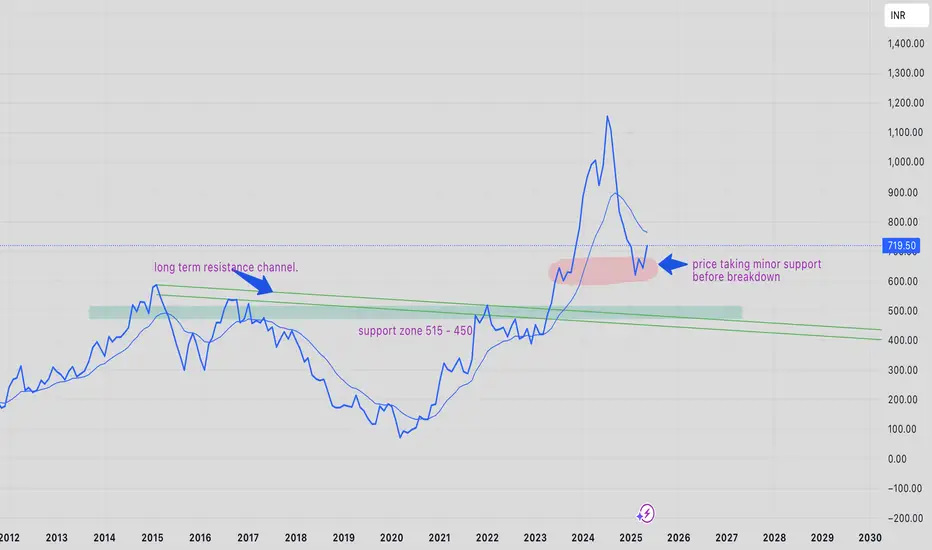
price analysis of TATAMOTORS-EQ for long term goalsTATAMOTORS-EQ price trend is in downtrend this is because price is trying to retest its previous all time high resistance zone ~550 - 425.
people of wish to add and have a long term goal it is better to add at those lvls because the current bounce might be used as selling opportunity by traders/speculators because of minor support.
as always people are advised to trade as per their risk capacity.
TATA MOTOR LONGtatamotors ling idea. learning purpose only.
tata motors long it can give good upmove from here as per my opinion

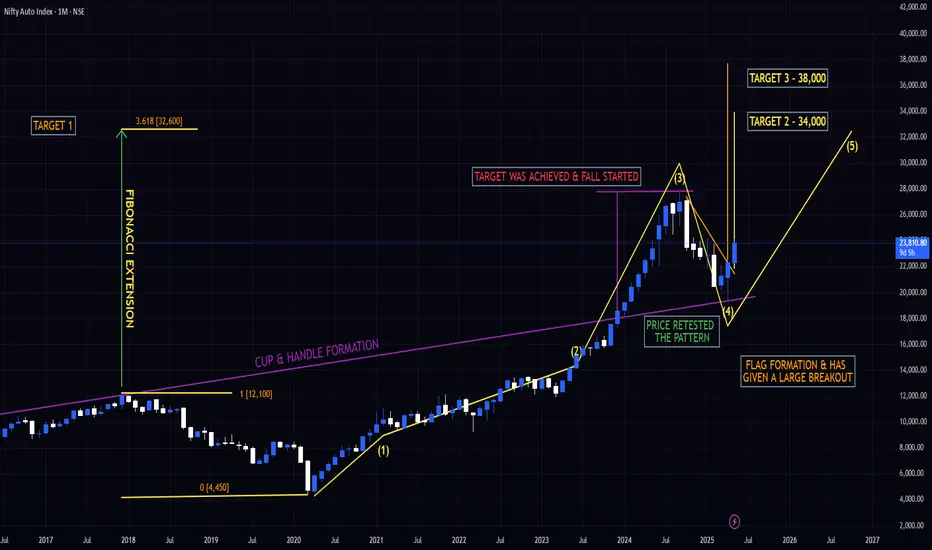
HUGE POTENTIAL IN THE NIFTY AUTO INDEX - STARTING OF THE 5 WAVEIndian Auto Index Technical Analysis
The Indian Auto Index made an all-time high (ATH) of approximately 27,700, completing Wave 3
From there, a Wave 4 corrective phase began, ending at 19,300 (a 30% decline).
A large Flag pattern has formed on the monthly charts and has been broken with a strong bullish candle, projecting a full target of 38,000 (an upside of 63%).
Using the Fibonacci extension from the COVID fall, the 3.618 level comes to approximately 32,600.
Taking the extension of Waves 3 and 4, the 1.618 level also points to 32,600, reinforcing this level as a major target.
List of Technical Targets
Target 1 – 23,960
Target 2 – 25,500
Target 3 – 27,700 (previous ATH)
Target 4 – 32,600 (Fibonacci confluence)
Target 5 – 34,000
Target 6 – 38,000 (flag pattern breakout target)
Important Dates Based on Time Cycle Analysis
17 November 2025
30 March 2026
4 January 2027
29 April 2029
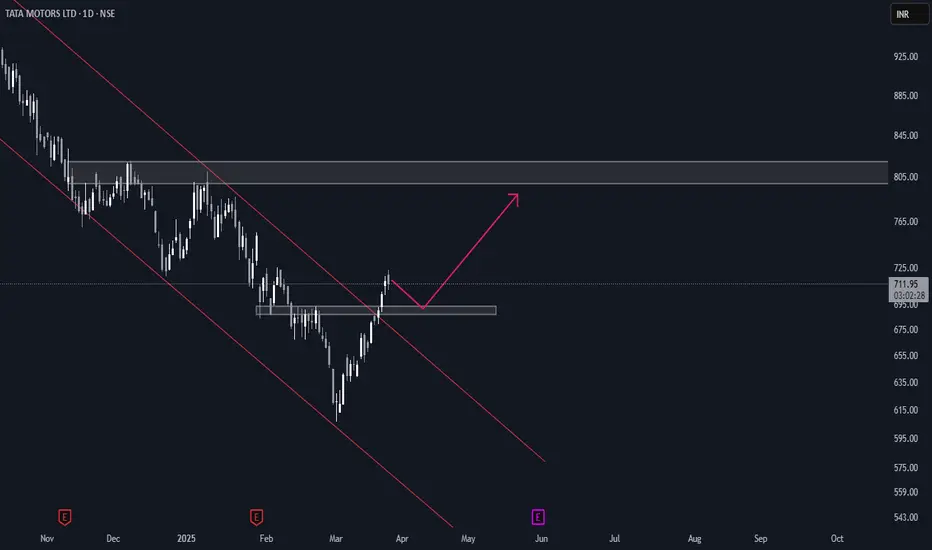
TATA Motors India - Trading 680 to 1000Daily chart,
The stock NSE:TATAMOTORS rallied from 535 to 742 since 7 April 2025, and I think a cooling down (minor correction) should take place before resuming the bullish trend.
Expected to test the nearest support around 680
Technical indicator RSI is near the overbought zone. A signal that a correction (downwards or sideways) can be soon.
So, a new entry (Buy) should be in parts after testing the support 685 - 680 and rebounding.
Above 745 for 2 days, the target will be 880 then 1000
Consider the stop loss below 680

Equity Research - TATA MOTORS LTD 📈 Buy Zone: ₹670.50 – ₹680.30
🎯 Target: ₹740.00
🛑 Stop Loss: ₹641.70
💹 CMP: ₹680.30
Technical Highlights:
✅ Bullish volume spike
✅ RSI above 60 – strong momentum
✅ Price above 20EMA & 50EMA
✅ Breakout and retest on 15m & 1H chart
✅ Good risk-reward setup
📊 Strategy: Wait for confirmation candle on 15min TF above ₹681 for entry.
📉 Stop loss below recent swing low at ₹641.70.
For Education Purposes Only

Live buying signal in TataMotors at 664Live Khareedo (Buy) signal in Tata Motors at 664. Lets see how long it will go up.
Note: This is not a buy/sell trade call, trade at your own will and analysis. Use stop loss too.

TataMotors is in bullish zoneMy custom indicators named Jadugar and Paka Kam generated signals in last 1H candle that Becho @ 658.4 means sell at this price, lets see how much it will drop.
Note: This is not a buy/sell trade call, this is education purpose post, trade at your own will, Use stop loss.

Tata Motors Technical🇮🇳🛵#TATA Motors is trading at ₹649.85 on the NSE, at the time of tweet, reflecting a slight increase of 5% from the previous Weak close.
Over the past three years, the stock has delivered a strong return of 43.57%, outperforming the Nifty 100’s 37.57%.
In my views bottom has been made and right time add in the portfolio
Chart For your reference
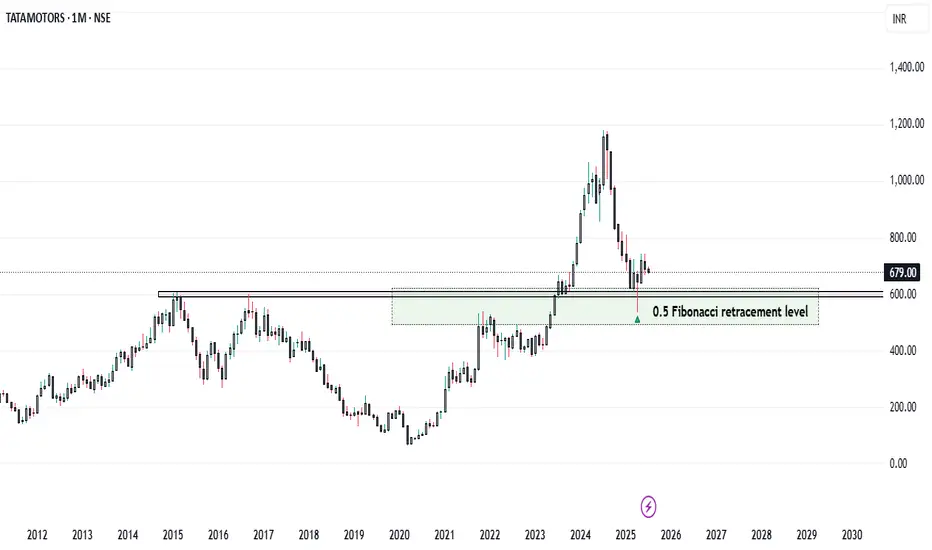
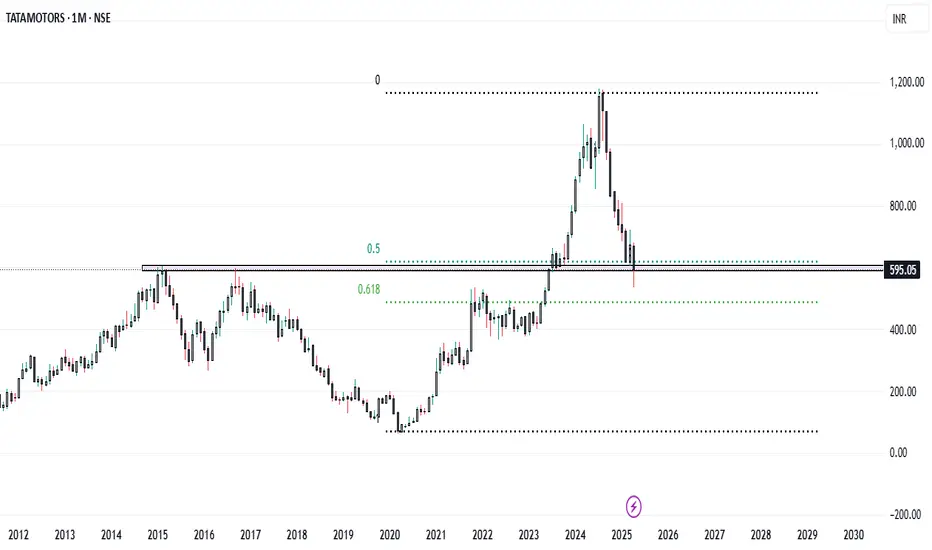
Tata Motors at ₹600: Support Zone in Focus...
Tata Motors at Key Technical Support: A Long-Term Buying Opportunity..?
Tata Motors is currently trading near the ₹600 level, which marks a significant technical support zone. This level is important not only because of historical price action but also because it aligns with the 0.5 Fibonacci retracement level of the broader uptrend seen in recent months.
The ₹600 mark has acted as a strong support on the monthly chart, suggesting a potential reversal point for long-term investors looking for value entry. From a purely technical perspective, this level could provide a solid foundation for a possible bounce or even a continuation of the longer-term bullish trend.
However, it is important to note that while technical indicators may suggest an attractive entry point, Tata Motors remains subject to various fundamental factors that could drive volatility in the short to medium term. These include:
- JLR (Jaguar Land Rover) Sales Data
- Quarterly Earnings Results
- Global Tariff and Trade Policy News
These elements can significantly impact investor sentiment and stock performance, sometimes overriding technical signals.
Disclaimer: This analysis is based solely on technical chart patterns and should not be considered financial advice. Market conditions can change rapidly, and it’s crucial to conduct your research and consider fundamental factors before making any investment decisions.
TATA MOTORSI am feeling bullish on Tata Motors for the short term. Let's see how it reacts around the key level of ₹800. If it holds and shows strength, we can decide whether to stay bullish for the long term. For now, I remain bullish.
Jaguar Land Rover Temporarily Halts U.S Shipments Amid TariffsJaguar Land Rover (JLR), owned by Tata Motors, has paused shipments to the U.S. market this April. The move follows a 25% import tax on vehicles imposed by U.S. President Donald Trump. JLR described the U.S. as a vital market and stated it is now adjusting to new trade rules with business partners.
The pause is a short-term step. The company aims to finalize longer-term strategies to manage the new tariffs. Analysts believe other British carmakers may soon follow this approach. Britain's auto sector faces pressure from falling domestic demand and the costly transition to electric vehicles.
David Bailey, a University of Birmingham professor, predicts more stoppages. He said automakers will reassess their plans amid rising costs and trade uncertainty. Recent data shows U.K. car production fell 13.9% last year to 779,584 units. Over 77% of these vehicles were exported.
The Society of Motor Manufacturers and Traders (SMMT) voiced concern. CEO Mike Hawes said the timing worsens an already challenging period. He urged swift trade talks to protect jobs and growth. The SMMT has stayed in regular contact with the U.K. government to seek solutions.
To soften the tariff’s impact, carmakers rushed to build inventories in the U.S. JLR was among them. U.K. car exports to the U.S. jumped 38.5% in Dec, 12.4% in January and 34.6% in February.
According to official figures, British automakers shipped £8.3 billion ($10.7 billion) worth of cars to the U.S. in the 12 months through September. Cars remain Britain’s largest goods export to the U.S. However, goods make up a smaller portion of overall trade. Services account for 68.2% of the £179.4 billion ($231.2 billion) in total U.K.-U.S. trade during the same period.
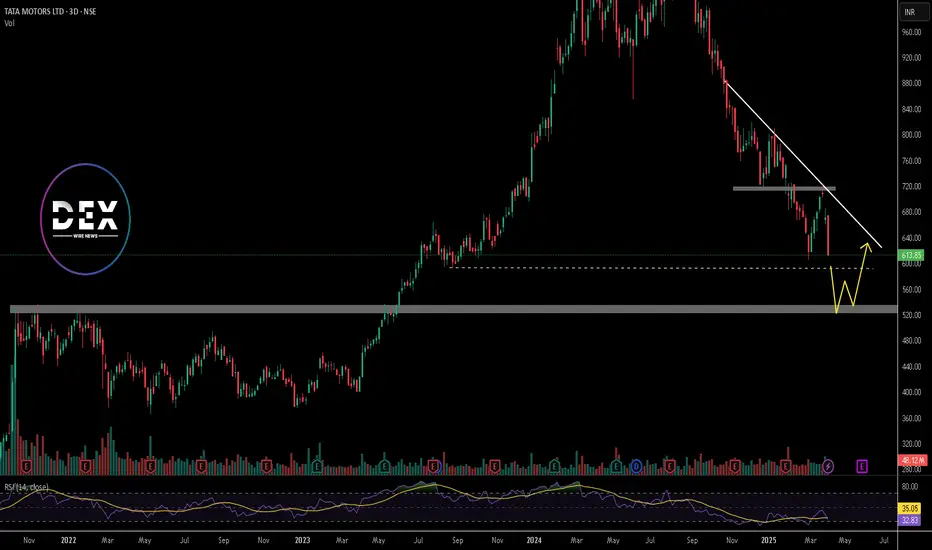
JLR is not independently listed. But looking at the parental company, Tata Motors (TATAMOTORS.BO) trades on India’s BSE. Its stock closed at INR 613.85 on April 4th, 2025 (6.15%).
Technical Analysis: Bearish Momentum Since July 2024 Highs
Tata Motors stock peaked at INR 1179 in July 2024. Since then, it has shown a sharp downtrend. It has surged in bearish momentum and has been breaking major support levels. In late January 2025, the price broke below key support at INR 715 and has retested it in March 2025. Currently, it trades lower and is approaching the next support at around INR 591.
If this level fails to hold, the price may fall to INR 525. The downtrend has persisted for months, indicating sustained bearish pressure in the market. The weekly RSI now reads 32, derived from deep bearish sentiment. If the RSI dips further, it may signal oversold conditions. However, the current momentum suggests the stock could still drop.
If INR 591 holds, a short-term bounce may follow, with a short-term recovery phase that could push the stock toward the descending trendline. Still, bears maintain control for now, and a break below 591 may accelerate further losses.