TATVA - possible move upwardsDear All,
A sample trade for TATVA has been mentioned on the charts.
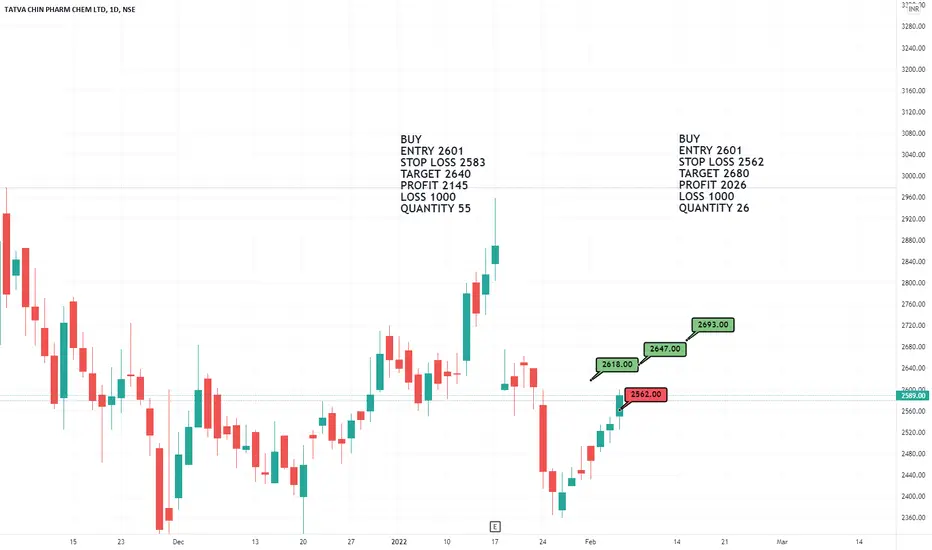
Kindly refer the chart for details
Left hand side is a demo of intraday trade and right side is a demo of positional trade
This is purely for reference purpose only so could not put up more details.
Thanks & Regards
TATVA
Tatva Chintan Stock AnalysisTatva Chintan Pharma Chemical Limited was listed on 29 July 2021, with a gain of approx 96.82%.
Since then the stock is trading a range, typically forming a symmetrical triangle pattern for almost the past 2 months.
Stock is currently near the 2/3 area of the triangle pattern and is mostly ready for the breakout.
Now the question is which side the breakout would come, since the stock listed at the whopping gain of about 96%, i would consider the previous trend on the upside.
So, the triangle patterns are mostly continuation pattern, hence the chance of the breakout on the upside are more.
So keep an eye on the stock and wait for the decisive breakout
If you have any queries, please do ask in the comment section below.
