TradeCityPro | ASTR: Key Support Levels and Market Momentum👋 Welcome to TradeCity Pro!
In this analysis, I want to review ASTR, one of the coins in the Ethereum ecosystem, currently ranked 159th on CoinMarketCap with a market cap of $297 million.
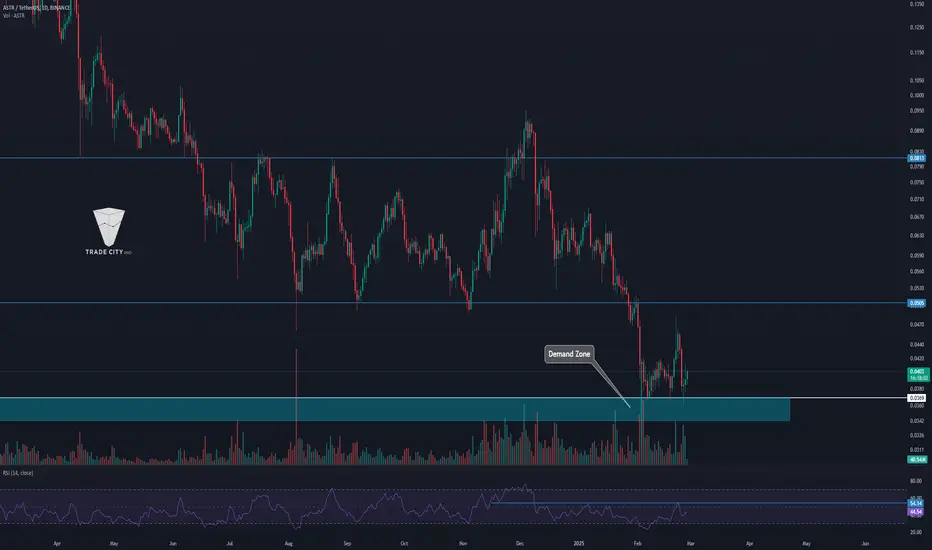
📅 Daily Timeframe
On the daily timeframe, as you can see, the price is in a long-term downtrend. The first bearish leg started from the $0.1907 high and moved down to the $0.0505 level. After this move, the price formed a consolidation box between $0.0505 and $0.0813. Once $0.0505 was broken, the price dropped further to the key support at $0.0369.
⚡️ As highlighted on the chart, there is a critical demand zone near the $0.0369 level. If the price breaks below this zone, it could register a new all-time low (ATL), which could put serious pressure on the project’s outlook.
📊 As observed, market volume within the consolidation box was decreasing. However, after the breakout, volume increased. Now that the price is ranging again, volume is dropping once more. If RSI enters the oversold zone and breaks below the 30 level, the likelihood of breaking $0.0369 significantly increases, which could trigger a strong downward momentum, leading the price toward new lower targets.
📈 On the bullish side, if the $0.0369 support holds and pushes the price upward, the first long trigger we can consider is $0.0505. We can also confirm bullish momentum from RSI if it breaks above 54.14.
⏳ 4-Hour Timeframe
Now, let’s examine the 4-hour timeframe for a more detailed view of price action. As you can see, the price has formed a ranging box between $0.0369 and $0.0499.
🧲 At one point, the price attempted to break above this range, even forming a higher high and higher low, but failed. After a fake breakout, a double top pattern was confirmed, and when the neckline broke, the price moved downward, reaching the $0.0369 zone once again.
✅ This $0.0369 level remains crucial, as it could keep the price in the current range or push it upward once again.
🧩 However, as seen on the chart, green candles have significantly lower volume than red candles, indicating that bears still dominate the market. The possibility of breaking below this support remains high.
📉 For short positions, the break of $0.0369 would be a strong confirmation. However, keep in mind that below this level lies a strong demand zone, meaning that a reversal could happen at any time. It’s crucial to manage risk carefully when entering shorts.
🔼 For long positions, assuming the previous bullish move was a fake breakout, a break above $0.0419 would be a reasonable entry. However, a more secure long trigger would be at $0.0456.
📝 Final Thoughts
This analysis reflects our opinions and is not financial advice.
Share your thoughts in the comments, and don’t forget to share this analysis with your friends! ❤️
TCP
TradeCityPro Academy | Dow Theory Part 1👋 Welcome to TradeCityPro Channel!
Welcome to the Educational Content Section of Our Channel Technical Analysis Training
We aim to produce educational content in playlist format that will teach you technical analysis from A to Z. We will cover topics such as risk and capital management, Dow Theory, support and resistance, trends, market cycles, and more. These lessons are based on our experiences and the book The Handbook of Technical Analysis
🎨 What is Technical Analysis?
Technical Analysis (TA) is a method used to predict price movements in financial markets by analyzing past data, especially price and trading volume. This approach is based on the idea that historical price patterns tend to repeat and can help traders identify profitable opportunities.
🔹 Why is Technical Analysis Important?
Technical analysis helps traders and investors predict future price movements based on past price action. Its importance comes from several key benefits:
Faster Decision-Making: No need to analyze financial reports or complex news—just focus on price patterns and trading volume.
Better Risk Management: Tools like support & resistance, indicators, and chart patterns help traders find the best entry and exit points.
Applicable to All Markets: Technical analysis can be used in Forex, stocks, cryptocurrencies, commodities, and even real estate.
Understanding Market Psychology: Charts reveal investor emotions like fear and greed, allowing traders to react accordingly.
📌 Real-Life Example
Imagine you own a mobile phone shop and want to predict whether phone prices will go up or down in the next few months.
🔹 Fundamental Analysis Approach
You follow the news and see that the USD exchange rate is rising, and phone manufacturers plan to increase prices. Based on this, you predict that phone prices will go up soon.
🔹 Technical Analysis Approach
You analyze past price trends and notice that every year, phone prices tend to increase before the New Year. This pattern has repeated for several years, so you assume it will happen again. As a result, you buy stock before the price hike and make a profit.
This example shows that technical analysis allows you to make decisions based on past market behavior without relying on external news.
📊 I ntroduction to Dow Theory
Today, for the first part of our lessons, we will begin with Dow Theory, which was developed by American journalist Charles Dow. Many traders still use this method for analysis and trading.
Dow Theory is one of the fundamental concepts in technical analysis, developed by Charles Dow, the founder of The Wall Street Journal and co-founder of the Dow Jones Industrial Average (DJIA). This theory provides a structured approach to understanding market trends and price movements and is still widely used today by traders and analysts.
Dow Theory consists of six core principles, which we will explain in detail:
📑 Principles of Dow Theory
1 - The Averages Discount Everything (Not applicable to crypto)
2 - The Market Has Three Trends
3 - Trends Have Three Phases
4 - Trend Continues Until a Reversal is Confirmed
5 - The Averages Must Confirm Each Other
6 - Volume Confirms the Trend
💵 Principle 1: Price is All You Need
According to this principle, all available information is already reflected in asset prices. This includes economic data, political events, earnings reports, trader expectations, and even market sentiment.
If a company releases strong earnings, its stock price might not rise significantly because investors had already anticipated this and bought in advance.
❗ Why This Is Important
Technical analysts focus on price movements rather than external news since all information is already factored into the market.
Instead of reacting to news, traders analyze historical price trends to predict future price movements.
📊 Principle 2: The Market Has Three Types of Trends
Dow Theory states that markets move in three types of trends, each occurring over different timeframes:
1 - Primary Trend: This is the main movement of the market, dictating the long-term direction, and can last for years.
2 - Secondary Trends: These are corrective movements that run opposite to the primary trend. For instance, if the primary trend is bullish, the corrective trend will be bearish. These trends can last from weeks to months.
3- Minor Trends: These are the daily price fluctuations in the asset. Although minor trends can last for weeks, their direction will always align with the primary trend, even if they contradict the secondary trend.
💡 Final Thoughts for Today
This is the end of this part, and I must say we have a long journey ahead. We will continually strive to produce better content every day, steering clear of sensationalized content that promises unrealistic profits, and instead, focusing on the proper learning path of technical analysis.
⚠️ Please remember that these lessons represent our personal view of the market and should not be considered financial advice for investment.

TradeCityPro | Bitcoin Daily Analysis #17👋 Welcome to TradeCity Pro!
Let’s move on to the analysis of Bitcoin and key crypto indices. As I mentioned yesterday, there was a possibility that the market would undergo a correction and start ranging, and that’s exactly what happened.
✨ The price hasn’t changed much compared to yesterday, and the short positions we opened remain open for now. There’s no need to take profits yet. Let’s analyze the market to identify today’s triggers or the ones that might signal when to take profits on previous positions.
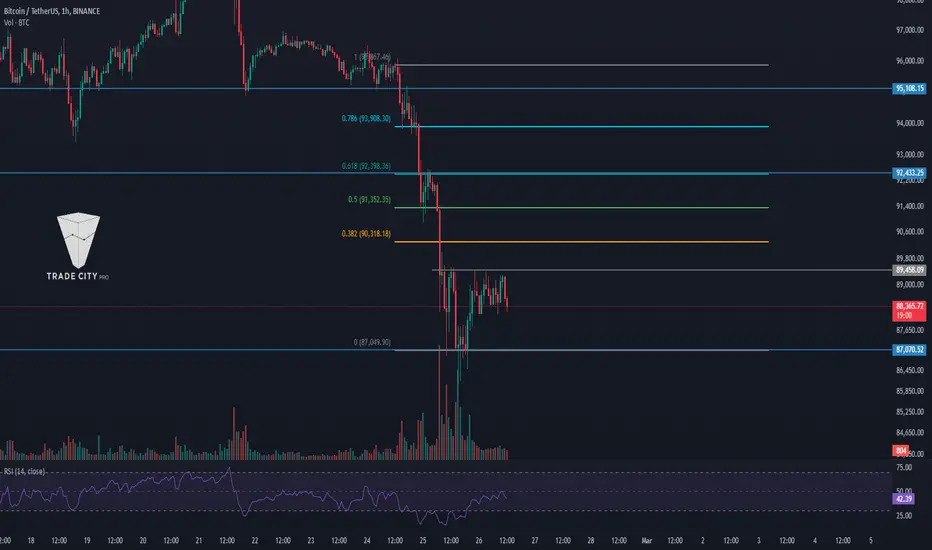
⏳ 1-Hour Timeframe
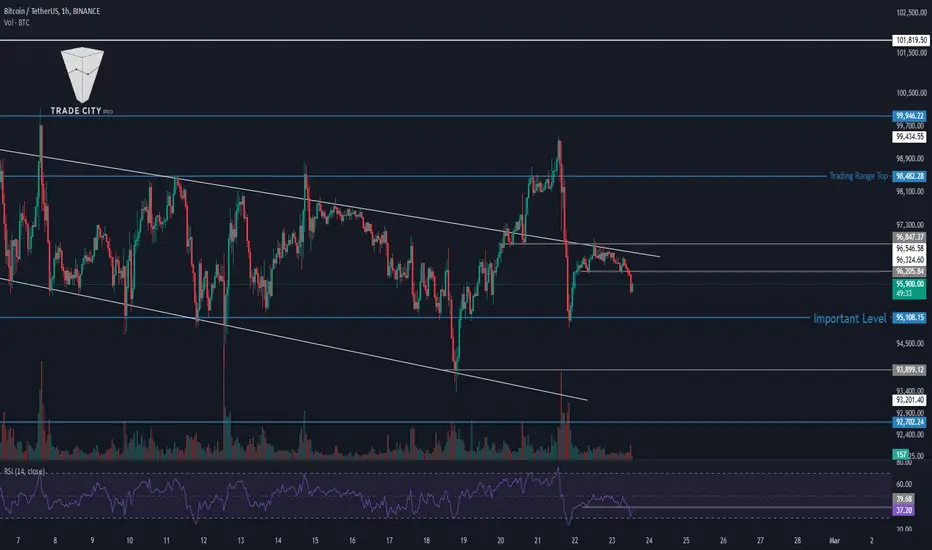
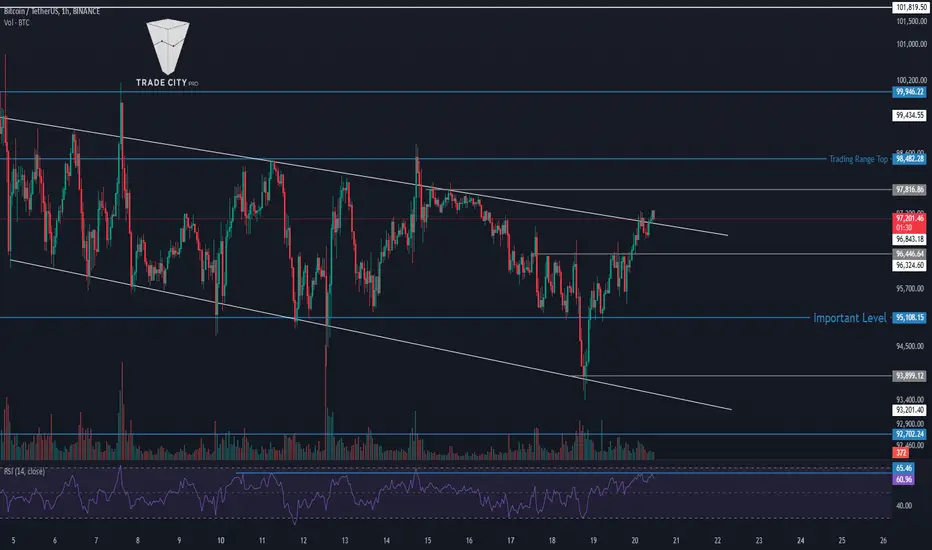
As you can see in the 1-hour timeframe, after the price formed a base at 87,700, it entered a ranging phase. The RSI, after being rejected multiple times from the 30 level, has finally exited the oversold zone and has now reached 50, indicating that the bearish momentum has slightly weakened.
⚡️ The current minor resistance is at 89,458, and if the price closes above this level, we can take partial profits on our short positions, securing the desired profit from this market move.
👀 However, as you can see, I have placed a Fibonacci retracement on the chart since the price completed a bearish leg and, after reaching the 82,770 low, this bearish leg can be considered complete. Now, we are in a correction phase. As you can see, the price has not even retraced to the 0.382 Fibonacci level yet, forming a lower high below this zone.
🔼 This indicates that buyers are weak in the market, and sellers remain in control. If the price closes above 89,458, the likelihood of deeper corrections increases, which could extend to the 0.5, 0.618, or even 0.786 Fibonacci levels.
🧲 A crucial point about this Fibonacci retracement is the zone between 0.5 and 0.618, where the price has already reacted in the previous bearish leg. More importantly, the 92,433 support that was broken aligns with the 0.618 Fibonacci level, making this zone a critical PRZ (Potential Reversal Zone).
🔑 If the price breaks below 87,070, you can enter a short position, but for longs, I suggest waiting until the price forms more structure and buyers step into the market, leading to bullish momentum.
👑 BTC.D Analysis
Let’s move on to Bitcoin dominance analysis. As I mentioned yesterday, BTC dominance got rejected from 62.19, and I had said that a bearish trend was likely. That’s exactly what happened, and after BTC dominance broke below 61.49, it moved downward in a bearish leg to 60.91. Now, it is in a corrective phase.
💫 The confirmation of further downside for BTC dominance will come if it breaks below 60.91, which could trigger the next bearish leg. Currently, I do not have any bullish triggers for BTC dominance except for a reclaim of 61.49. However, since the structure is still forming, we need to wait before considering any bullish trigger.
📅 Total2 Analysis
Now, let’s move on to Total2. As I mentioned yesterday, the 1.16 level was broken, and a new support formed at 1.07. As you can see, Total2 has retraced more significantly than Bitcoin, correcting almost to the 0.382 Fibonacci level.
🎲 The reason for this deeper retracement is that Bitcoin dominance has been declining—more money has exited Bitcoin than altcoins, allowing altcoins to recover more than Bitcoin.
🔫 In Total2, we also have a major resistance zone between the 0.5 and 0.618 Fibonacci levels, similar to Bitcoin. In general, both Bitcoin and Total2 have a critical resistance zone between their respective 0.5 and 0.618 Fibonacci retracements.
💥 Currently, the key resistance is at 1.13, and if the price breaks this level, it could move towards the resistance zone. However, for short positions, if 1.07 is broken, you can enter a short trade.
✅ Be mindful of BTC dominance, as it is currently in a downtrend. If BTC.D continues to decline, shorting Bitcoin may be a better choice than shorting altcoins.
📅 USDT.D Analysis
Now, let’s analyze USDT dominance (USDT.D). Yesterday, it made a fake breakout above 5.04 and then reversed sharply downward, failing to hold the resistance. However, it has not yet formed a clear structure, so it’s too early to make any strong conclusions.
⭐️ I recommend avoiding opening new positions in the market for now and refraining from high-risk trades. The main trade opportunity was already provided when Bitcoin’s range broke down, so if you missed it, do not let FOMO push you into a trade. Avoid making rushed decisions that could put your capital at risk.
❌ Disclaimer ❌
Trading futures is highly risky and dangerous. If you're not an expert, these triggers may not be suitable for you. You should first learn risk and capital management. You can also use the educational content from this channel.
Finally, these triggers reflect my personal opinions on price action, and the market may move completely against this analysis. So, do your own research before opening any position.
TradeCityPro | Bitcoin Daily Analysis #16👋 Welcome to TradeCity Pro!
Let’s move on to the analysis of Bitcoin and key crypto indices. Yesterday, Bitcoin experienced a very sharp and intense bearish move. If you have been following the analysis, you probably already had a short position. I’d be happy if you share the positions you opened in the comments.
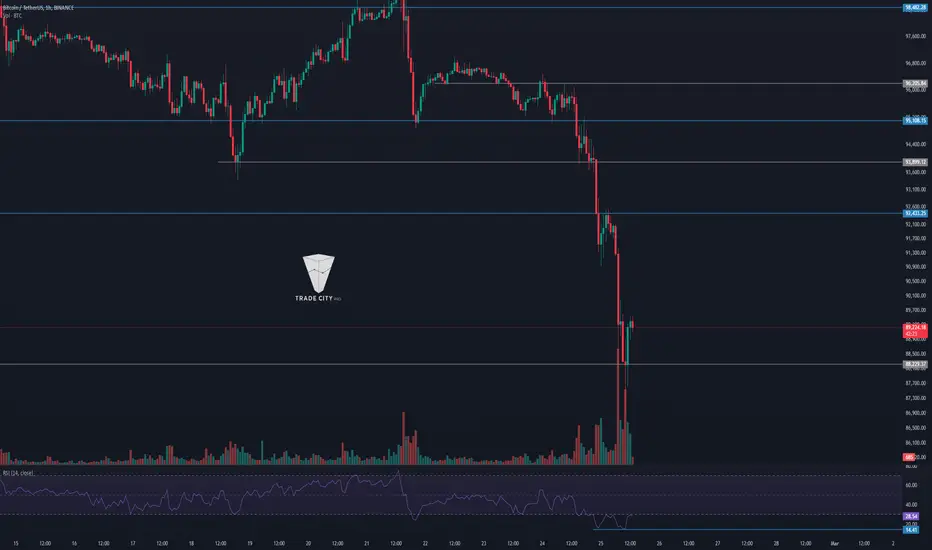
⏳ 1-Hour Timeframe
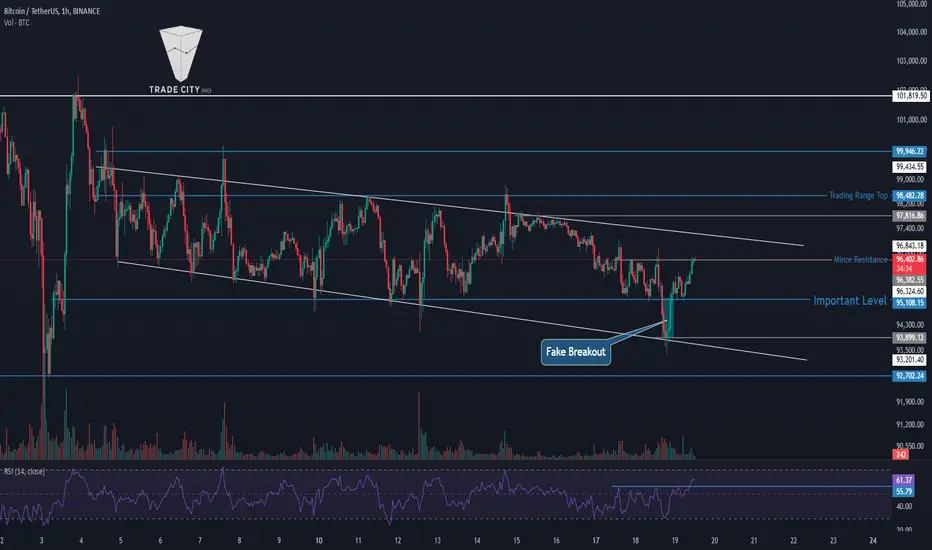
Well, in this one-hour timeframe, as you can see, the price finally broke the 95,108 level, and as I have mentioned in several past analyses, this level is much more important than 92,702 for us. The reason is that the reactions that the price has had to this level have been far more significant than 92,702, making it a very important support.
📉As you can see, with a candle closing below this level, this trigger was activated, and the price made a downward move. The next trigger at 93,899 was broken, and eventually, after breaking 92,702, the price started its next bearish leg. At present, the price has found support at 88,229, and we are witnessing a green 1-hour candle.
🔄 The positions that we could have opened earlier were with the break of 96,205, which we opened a position for, and the next key levels yesterday where we could have opened positions were 95,108 and 93,899. I hope you opened these positions and made a profit.
💥 At present, the RSI indicator, as you can see, is deep in oversold territory and has formed a double bottom in the oversold area. If it finally exits the oversold zone and moves above 30, this double bottom will be activated, and we can say that the market momentum is shifting out of its bearish phase and may enter a ranging phase.
⚡️ Today, I cannot provide any trade triggers. Yesterday was the key day to enter positions. However, the current support level is 88,229, and the recent high is at 92,444.
🧩 I have nothing more to say about Bitcoin. We have a bearish leg with good momentum, and we need to wait for the price to create a structure before we can analyze Bitcoin again.
👑 BTC.D Analysis
Let’s move on to Bitcoin dominance. As you can see, yesterday, BTC dominance closed above the 61.49 level, and after a pullback to this zone, it made a sharp move up to 62.19. It even surpassed our 62% target, forming a top during Bitcoin’s first bearish leg.
✅ However, during the second bearish leg that the market experienced, BTC dominance declined, which caused Bitcoin to drop more than altcoins in this move, whereas in the first leg, altcoins had dropped more than Bitcoin. So, in a way, we can say that both had almost the same proportion of decline.
💫 BTC dominance seems to have formed its top at 62.19 and could now range between 61.49 and 62.19.
📅 Total2 Analysis
Now, let’s move on to Total2. Yesterday, the 1.19 trigger was activated, and another key level that was broken was 1.16, and with the break of either of these levels, you could have opened a position. At present, the price has reached 1.07.
⭐️ There is not much else to say about Total2. We need to see at what level it will form its bottom and what kind of structure will be created for either a correction or the continuation of the bearish trend. Currently, the most important support level is 1.07, which the price has reacted to multiple times in the past.
📅 USDT.D Analysis
USDT dominance, after closing above 4.62, successfully held above 4.75, which was the main resistance for USDT.D, and then made a sharp upward move. Currently, it has reached 5.04, which is a very important historical level, and has shown a reaction to it.
🔫 There isn’t much to discuss about this index, and overall, there isn’t much to analyze in the market today. Most of today’s discussion is about the positions that could have been opened and the profits that could have been made, which I already covered in Bitcoin’s analysis.
🧲 For now, we need to wait until the market forms a new structure, and once that happens, we can look for the next trade setup for the next major leg.
❌ Disclaimer ❌
Trading futures is highly risky and dangerous. If you're not an expert, these triggers may not be suitable for you. You should first learn risk and capital management. You can also use the educational content from this channel.
Finally, these triggers reflect my personal opinions on price action, and the market may move completely against this analysis. So, do your own research before opening any position.
TradeCityPro | KSM: Accumulation or Breakdown Ahead?👋 Welcome to TradeCity Pro!
In this analysis, I want to review KSM for you. This project is one of the platforms within the Polkadot ecosystem and currently ranks 157th on CoinMarketCap with a market cap of $289 million.
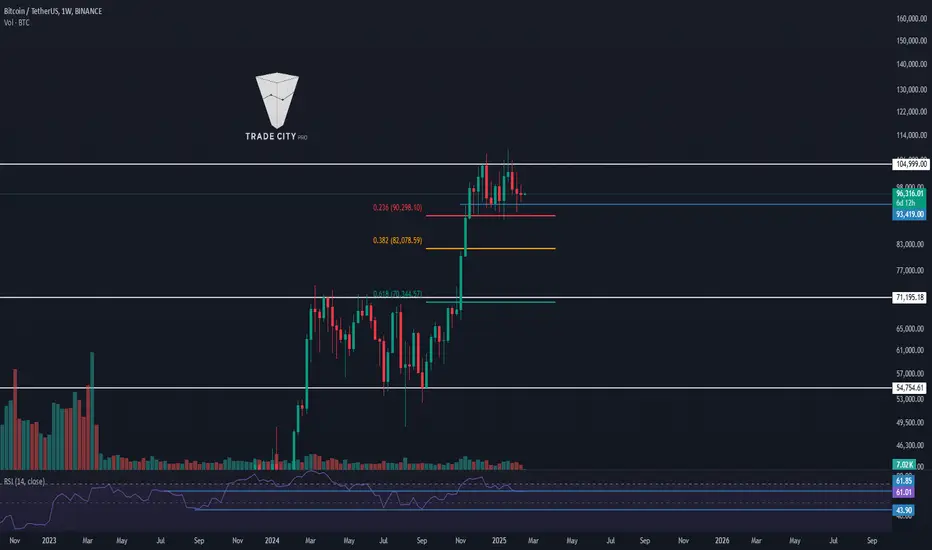
📅 Weekly Timeframe
On the weekly timeframe, we observe a consolidation zone ranging from $15.36 to $55.85. The price has been fluctuating within this range for over two years. By comparing the weekly chart with Bitcoin’s chart, we can see that the KSM/BTC pair is in a downtrend, making it currently not a good buy against Bitcoin.
🔍 However, if we analyze this chart independently, if the price bounces off the $15.36 support and starts moving upward, we can consider buying if it breaks out of the upper box limit. In that case, we can confirm that this two-year range was an accumulation zone, leading to a long-term bullish trend.
📊 The buying volume within this range has been higher than selling volume, which can be a positive sign for buyers and increases the chances of an upward breakout. However, the bullish legs have been relatively short-lived, while the bearish legs have followed more technical and structured movements.
🚀 If the price breaks out of the range to the upside, the technical targets would be $177.68 and $530.43. This means a significant amount of capital would need to enter this coin, which seems unlikely at the moment.
❌ On the other hand, if the price breaks below the range, there will be no significant support left, and we will need to see where the new historical bottom forms.
📅 Daily Timeframe
On the daily timeframe, as you can see, the price failed to reach the upper boundary of the range at $60.88 during its last bullish leg and got rejected at $51.21, initiating its downtrend. The price has since moved within a descending channel, approaching the bottom of the range.
✅ Yesterday's candle was heavily rejected from the mid-line of the channel, engulfing all recent candles from the past few days. This indicates strong selling pressure, which could initiate a much deeper downtrend.
📉 If the price breaks below the channel, the downtrend momentum will intensify, potentially leading to a parabolic bearish move for KSM. The key trigger level for confirming a parabolic downtrend is $16.08, and if this level is breached, we can expect a new bearish phase.
🧩 However, if the price breaks above the channel, the current breakout trigger is $22.37. A break above this level could be a buy signal for a long position.
📝 Final Thoughts
This analysis reflects our opinions and is not financial advice.
Share your thoughts in the comments, and don’t forget to share this analysis with your friends! ❤️

TradeCityPro | ENSUSDT Better Status Than Altcoins👋 Welcome to TradeCityPro Channel!
Let's go together with one of the popular layer two coins that works in domain and address naming services for wallets and recently announced that it will launch layer two soon
🌐 Overview Bitcoin
Before starting the analysis, I want to remind you again that we moved the Bitcoin analysis section from the analysis section to a separate analysis at your request, so that we can discuss the status of Bitcoin in more detail every day and analyze its charts and dominances together.
This is the general analysis of Bitcoin dominance, which we promised you in the analysis to analyze separately and analyze it for you in longer time frames.
📊 Weekly Timeframe
On the weekly time frame, ENS is one of the bullish coins in the market that has a good situation ahead and has started its main upward movement before the start of 2025 and in late 2023
After the start of the main movement after the 9.99 break, we started our main upward trend and we can say that we broke our ceiling in terms of market cap and made a new ATH market cap
We are also on a curve line that is bullish and supportive in nature and if this line is broken, it shows us that the main upward trend has weakened and if we go below 15.90, we will see a trend change in MWC
For re-entry, the 47.68 break is an interesting trigger and you can buy again and if the exit trigger is below 15.90, you can exit and for now, I recommend You can't buy in this time frame
📈 Daily Timeframe
In the daily time frame, however, it has held its own more than the rest of the altcoins and is suffering in its daily box between 24.78 and 27.55, which happened after the rejection at 47.68.
Also, in this time frame, we have a trend line that if the price reaches it, we will have the possibility of reacting and we will use it as a tool to save profit in the lower time frame if we react to it.
Also, the rejection candle that closes from this resistance at 27.55 in the same way, we will have the possibility of continuing the downtrend, and if 24.78 is broken, we can move towards 20.81 and 15.90. And for buying, if this support is faked or the 35.98 trigger is activated, I will buy, and in this box, I will only I trade in futures
⏱ 4-Hour Timeframe
In the four-hour time frame, what happened is that we faked the resistance above the box, which increases the probability of breaking the support floor
📉 Short Position Trigger
you can open a position with this four-hour candle as a guide, but on the other hand, it is better to wait for the support to reach 24.79 and the reaction from it and then follow its breakdown
📈 Long Position Trigger
we need to return to the ceiling again for now, and if we return above the support level sooner, we can think more about breaking 27.91 and open a more confident long position
📝 Final Thoughts
Stay calm, trade wisely, and let's capture the market's best opportunities!
This analysis reflects our opinions and is not financial advice.
Share your thoughts in the comments, and don’t forget to share this analysis with your friends!

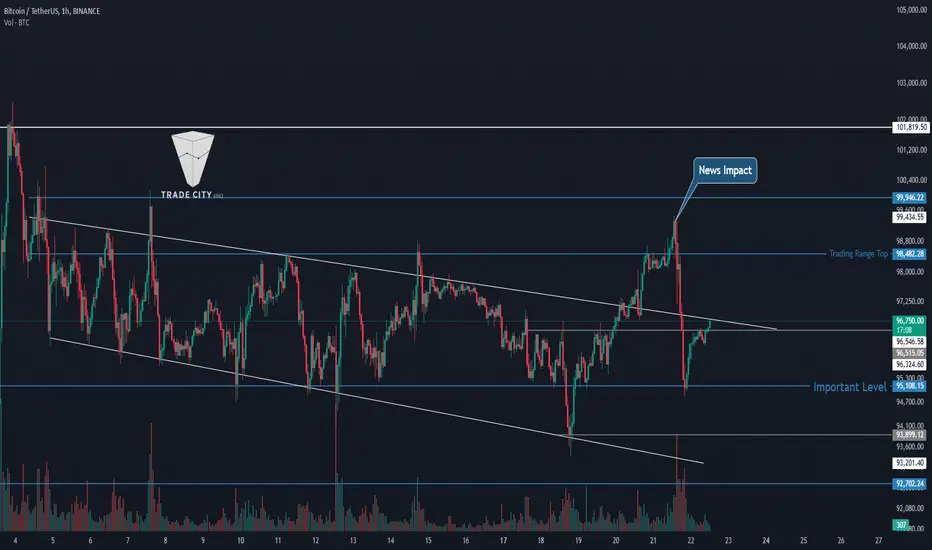
TradeCityPro | Bitcoin Daily Analysis #15👋 Welcome to TradeCityPro!
Let's dive into the analysis of Bitcoin and key crypto indicators. In this analysis, as per the routine on Mondays, I’ll also review the chart in higher timeframes for you to see what price scenarios might be likely for the coming week.
📅 Daily Timeframe
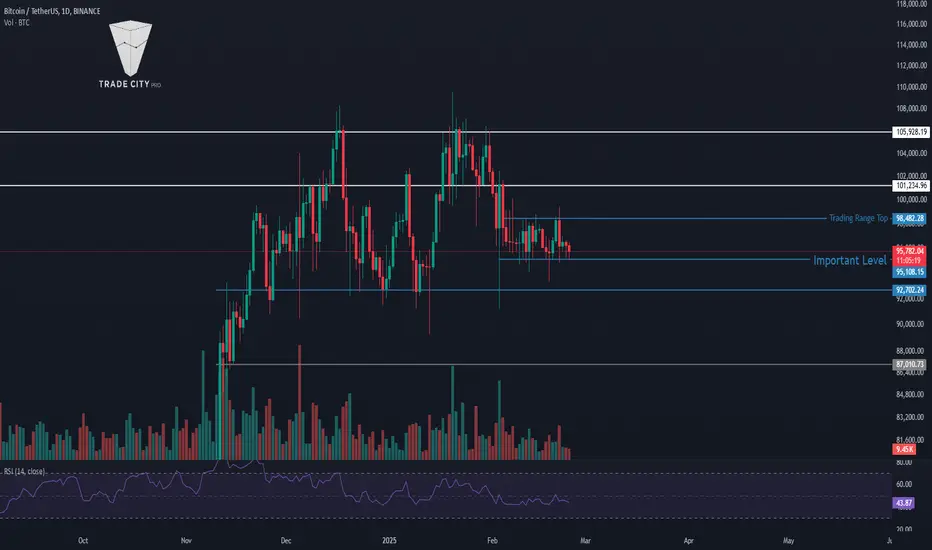
In the daily timeframe, as you can see, the price is still in a very small trading range, oscillating from the 95108 area to the 98482 area, forming a very small range within a larger range box that extends from 92702 to 105928.
📊 As you can observe, the market volume within this box has significantly decreased and is continuing to diminish, indicating that traders and market participants are gradually decreasing. If this box breaks, the price can determine its next direction and movement leg.
🔽 If the 95108 area breaks, the next area will be 92702, which is the bottom of the range box. If this support breaks, the next support area will be at 87000.
✅ Conversely, if the price breaks the range box upward, breaking 98482 could lead the price towards the upper resistance areas of 101234 and 105928. The main confirmation for the next upward trend will be with the breaking of 105928, and if this area, which is also Bitcoin’s ATH, is broken, we can say that the price can move towards higher targets and new ATHs.
💥 In the RSI oscillator, as you see, this indicator is oscillating between two very important areas from 40.73 to 51.34, and breaking either could give us a confirmation of the RSI momentum.
⚡️ Let's go to the four-hour timeframe to observe the price movement with more details.
⏳ 4-Hour Timeframe
As you see, we are in a range box that was visible in the daily timeframe as well, ranging from 95108 to 98482. This box has been faked once from the bottom and once due to the news of the hack at the Bybit exchange, causing the price to fake the top of this range box and move downward.
🧩 Currently, as you see, the number of hits to the bottom of the box has significantly increased, which increases the likelihood of this box’s floor breaking. Therefore, if 95108 breaks, I will try to enter a position and will show you later in the analysis how we can decide to open a short position on altcoins or on Bitcoin.
🔼 For long positions, the trigger at 96847 is suitable, but it is better to go to the one-hour timeframe to find better and more appropriate futures triggers.
⏳ 1-Hour Timeframe
Let's go to the one-hour timeframe, a timeframe I analyze for you every day. Yesterday, the trigger I gave at 96205 was activated and gave very good profits, and the price almost reached the bottom of the box. After that, with a strong candle and a lot of buying volume that you saw, the price pulled back to this area again, so this area could become an important area in the future and I will keep this line on the chart for now.
📈 If the price breaks this area upward this time, and if the candle is of good volume and shape, I will definitely open a long position, and our next trigger for long will be at 96847.
🔑 But as you see, the price also reacted yesterday to the top of the Expanding Triangle area, and as you see, it both got rejected from this top and reacted with a shadow to it and pulled back to it.
📊 The market volume is also increasing. This drop that the price has started and the same causes the likelihood of breaking 95108 to increase. So I suggest if the price reaches near this area and gives you a good stop loss placement, definitely have a stop sell below this area so that if the price moves sharply downward, your position is activated and you don’t miss the price movement.
📉 The next price support will be at 93899, and we also have dynamic support at the bottom of the Expanding Triangle that can act as a good target and support from the price. I don’t see any other important points, so let’s move on to dominance analysis.
👑 BTC.D Analysis
Let's go to the analysis of Bitcoin dominance. As you see, yesterday, after recording a new low in the area of 60.72, it gained a very good upward momentum and moved upwards, and after breaking 61.04, it re-entered the range box and this morning also broke the top of the box, which was area 61.49, and this increase in Bitcoin dominance caused altcoins to drop much more than Bitcoin.
🔍 If this trend of Bitcoin dominance continues, if the floor 95108 in Bitcoin breaks, opening a short position on altcoins would be more logical than Bitcoin because more money is leaving altcoins than Bitcoin.
🤝 Let's go to the analysis of Total2 and review the appropriate triggers for altcoins for you.
📅 Total2 Analysis
As you see in Total2, yesterday's trigger at 1.22 was activated, and as we saw in Bitcoin dominance, altcoins dropped much more than Bitcoin, definitely giving you very good profits. I would be happy if you opened a position with this trigger, definitely tell in the comments so I am aware that you are using the triggers I provide in the analysis.
💫 As you see, the area 1.19 overlaps with the 95108 area in Bitcoin, but Total2 has broken this area. The reason is that Bitcoin dominance is rising, which causes that even though Bitcoin is still on support and has not broken its support, Total2 has broken its support and can now move towards the area 1.16.
🔑 If you have altcoins in mind that give a trigger for entering a short position now, you can open a position on them. For long positions, in my opinion, today the market will not give a long trigger. But if this downward movement is faked and the price moves upwards with the confirmation of theory and setting higher lows and highs, you can open a long position.
📅 USDT.D Analysis
As you see, USDT.D has activated its short trigger in the area of 4.62 and yesterday rose from the support of 4.52 and moved upwards. If dominance can stabilize above 4.62, we can expect it to move towards 4.75, and this could be a very suitable confirmation for opening a short position on altcoins.
✅ But everything depends on Bitcoin dominance, and with the movement of Bitcoin dominance, you can decide whether to open this position on altcoins or on Bitcoin itself. For long positions and confirmation of a bearish trend in Tether dominance, you must wait until the price forms a new structure again, and in my opinion, if this break is faked, area 4.52 will become a very important area.
❌ Disclaimer ❌
Trading futures is highly risky and dangerous. If you're not an expert, these triggers may not be suitable for you. You should first learn risk and capital management. You can also use the educational content from this channel.
Finally, these triggers reflect my personal opinions on price action, and the market may move completely against this analysis. So, do your own research before opening any position.
TradeCityPro | INCH: Delving into a Leading DEX Project👋 Welcome to TradeCityPro!
In this analysis, I want to review the INCH coin for you. It's one of the DEX projects in crypto, active in the DeFi space, and considered one of the successful projects in this category.
📅 Weekly Timeframe
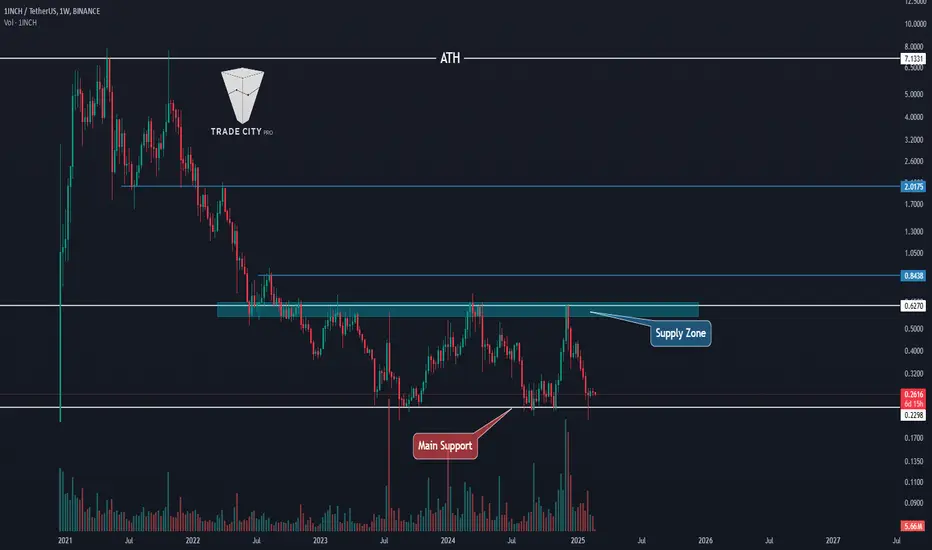
As you can see in the weekly timeframe, after its launch, the price began a downward trend and is currently in a consolidation box between $0.2098 and $0.6270.
⚡️ The bottom of this box is a very important support, arguably the only and last support for this coin. Conversely, the top of this box, as you can see, is a very strong supply zone. The price has approached this area several times with high momentum, but it has been rejected each time and returned to the bottom of the box.
🔍 Currently, as you observe, the price, after being rejected from this level, has moved downward and reached the bottom of the box, where it has been ranging for about three weeks. If this bottom breaks, the price could move lower and set a new all-time low (ATL), which would worsen the project's situation.
📈 However, if the price can rise from this area, finally moving upwards and breaking the supply zone, it could successfully start its bullish trend after several years.
🚀 The targets for the bullish trend are initially at $0.8438 and then at $2.0175. The ATH area is at $7.1331, which seems far from the current price and out of reach unless the market cap of 1inch significantly increases.
📅 Daily Timeframe
In the daily timeframe, as we observe, we can see more details about the last downward movement. As you see, after entering the correction phase, the price first corrected to $0.3638. However, after stabilizing below this area, the next downward leg started, and currently, the price has reached $0.25 and has formed a small box between $0.25 and $0.2756.
🔽 For short positions, we have a very suitable trigger at $0.25, where if this area breaks, the price could move down to its main support at $0.2226.
✅ On the other hand, if this box that the price has formed breaks upwards and the price can stabilize above $0.2756, forming a higher low and higher high, we could say it has risen from the bottom of the box and could move higher.
💥 Overall, the price is in a very large weekly box, and any spot purchases and positions taken within this box are highly risky. So, be sure to not engage in excessive risk with this coin and wait until the large weekly box is broken either upwards or downwards.
📝 Final Thoughts
This analysis reflects our opinions and is not financial advice.
Share your thoughts in the comments, and don’t forget to share this analysis with your friends! ❤️
TradeCityPro | Deep Search: In-Depth Of LINK🔹What is Chainlink?!
🔹Chainlink is a decentralized oracle network that enables smart contracts to securely interact with real-world data, external APIs, and off-chain computations. Founded in 2017, Chainlink solves the "oracle problem" by providing tamper-proof, trust-minimized data for blockchain applications.
🔹Chainlink has become a critical infrastructure in the DeFi (Decentralized Finance) ecosystem, enabling hybrid smart contracts that leverage off-chain data. With partnerships in traditional finance, gaming, insurance, and enterprise solutions, Chainlink is positioning itself as the primary gateway between blockchains and real-world data.
🔹Chainlink’s Core Technology & Products
▪️ A. Decentralized Oracle Networks (DONs):
Chainlink’s oracle networks retrieve, verify, and deliver off-chain data to on-chain smart contracts in a secure and decentralized manner. These oracles solve blockchain’s lack of external connectivity, making real-world data accessible in DeFi, insurance, gaming, and enterprise applications.
B. Cross-Chain Communication (CCIP):
Chainlink enables cross-chain data sharing between public and private blockchains, allowing seamless communication and transfer of value across multiple networks.
▪️ C. Data Feeds & Market Insights:
Price Oracles: Secure on-chain price feeds for assets like BTC, ETH, stablecoins, and commodities.
Proof of Reserve: Verifies asset collateralization in real-time, crucial for stablecoins and wrapped assets.
Data Streams: Provides high-frequency market data for next-gen DeFi protocols.
▪️ D. Compute Services:
- Functions: Connects smart contracts to any API, enabling custom Web3 applications.
- Automation: Automates smart contracts with event-based triggers.
- Verifiable Random Function (VRF): Ensures secure randomness in gaming, NFTs, and lotteries.
🔹Chainlink’s Economic Model & Tokenomics
A. LINK Token Utility
The LINK token is the native cryptocurrency of the Chainlink ecosystem, used for:
🔹Paying node operators for retrieving, verifying, and delivering data.
🔹Staking to provide economic security and ensure data integrity.
🔹Governance and ecosystem incentives.
B. Staking & Security Mechanism:
Chainlink introduced staking as part of its Chainlink Economics 2.0 model to enhance security:
🔹Node operators must stake LINK to provide data services.
🔹Validators get slashed for incorrect or malicious data submissions.
🔹Delegated staking allows non-technical users to stake LINK via trusted operators.
C. Token Distribution
🔹ICO Price (2017): $0.11
🔹Total Supply: 1 billion LINK
🔹Circulating Supply: ~450M LINK (45% of total)
🔹Token Allocation:
-35% for ecosystem development and node incentives.
-35% sold in ICO/public sales.
-30% retained by Chainlink Labs for network growth.
D. Market Performance & ROI
🔹All-Time High (ATH) Price: $52.88 (May 2021)
🔹ICO ROI: 484.11x (+48,311%)
🔹Private Sale ROI: 587.5x (+58,650%)
🔹Total Funds Raised: $32M (ICO: $3M, Private Sale: ASX:29M )
🔹Some of Investors: Hashed Fund, Framework Ventures and Fundamental Labs
——
🔹Chainlink’s Adoption & Use Cases
A. Financial Services & DeFi
Chainlink secures billions of dollars in DeFi protocols, including:
🔹Aave (lending and borrowing)
🔹Compound (decentralized finance)
🔹Synthetix (synthetic assets)
🔹Uniswap (decentralized exchanges)
B. Asset Tokenization & Enterprise Adoption
Chainlink enables tokenization of real-world assets (RWA), integrating blockchain technology into:
🔹Traditional banking and payments
🔹Supply chain transparency
🔹Enterprise solutions (e.g., SWIFT, Google Cloud, FedEx, AccuWeather)
C. Gaming & NFTs
🔹VRF ensures fairness in blockchain gaming and NFTs.
🔹Major NFT & metaverse projects rely on Chainlink for secure randomness.
D. Insurance & Climate Markets
🔹Weather-based smart contract automation for crop insurance.
🔹Secure insurance claim processing using verified external data.
🗺Chainlink (LINK) Roadmap
Chainlink is evolving rapidly to enhance scalability, decentralization, and utility across blockchain ecosystems. The Chainlink 2.0 upgrade and Economic Model 2.0 are set to play crucial roles in the network’s future. Here’s a breakdown of Chainlink’s roadmap and upcoming developments.
A. Next-Gen Oracle Solutions
Chainlink 2.0 expands Decentralized Oracle Networks (DONs), introducing:
🔹Off-Chain Reporting (OCR) for better efficiency.
🔹Hybrid computation models for privacy and scalability.
🔹Fair Sequencing Services (FSS) to prevent front-running in DeFi.
B. Staking Expansion
🔹Staking rewards expected to start at 5% APY, paid via fees + emissions from the Chainlink treasury.
🔹Full staking implementation in Chainlink Economics 2.0 to ensure sustainable network growth.
C. Cross-Chain Integration & Layer 2 Adoption
🔹Chainlink plans deeper integration with Layer 2 solutions like Arbitrum & Optimism.
🔹Further adoption into non-EVM blockchains like Solana, Polkadot, and Cosmos.
🏦 Strategic Partnerships & Institutional Adoption
Corporate & Enterprise Partnerships: Chainlink has secured high-profile collaborations with:
-Google Cloud: Integrated Chainlink oracles for Web3 data verification.
-SWIFT: Exploring cross-border transactions using Chainlink.
-AccuWeather & FedEx: Providing real-world data for blockchain use cases.
-Associated Press: Integrating trusted news data into smart contracts.
🔹Advisory Team & Leadership
-Sergey Nazarov (CEO): Blockchain visionary, co-founder of SmartContract.com.
-Steve Ellis (CTO): Co-founder & lead engineer behind Chainlink.
-Eric Schmidt (Ex-Google CEO): Joined as technical advisor.
🔧Security & Consensus Mechanism
-Ethereum-based ERC-20 token with Proof-of-Stake (PoS) consensus.
-Delegated Proof-of-Stake (DPoS) & Proof-of-Authority (PoA) used for oracle security.
-Multi-layered decentralization ensures resilience against data manipulation.
🔹Market Outlook & Future Predictions
Competitive Edge:
-Most adopted decentralized oracle network.
-$75B+ secured across 1,000+ projects.
-Expanding beyond crypto into traditional finance & enterprise applications.
Challenges & Risks
-Reliance on Ethereum scalability.
-High competition from newer oracle solutions (e.g., --Band Protocol, API3).
-Adoption rate depends on broader DeFi growth.
👛Some of the wallets that support Chainlink
MetaMask
Ledger Wallets (Nano S & Nano X)
Exodus Wallet
WalletConnect
Rabby Wallet
Trust Wallet
Atomic Wallet
Coin98 Wallet
Trezor Wallet
Argent Wallet
—
🔹Platform for staking LINK
Stake.link
Chainlink
Stake.com
—-
Platform for providing LINK
🔹Retro
🔹Biswap
🔹Kujiro
🔹Mdex
🔹Tomb
🔹Ramses
🔹Honeyswap
🔹Uniswap
🔹Pancakeswap
🔹LFJ
🔹Pangolin
🔹Balancer
🔹Revenue and Staking
▪️ Since the beginning of February, Chainlink's revenue experienced a sharp decline followed by a notable recovery, rising from -0.015 to 0.06 Ethereum. Meanwhile, staking activity in 2025 has remained relatively stable at approximately 279,000 Ethereum, showing no significant fluctuations. Additionally, the increase in network fees highlights growing user engagement and heightened activity within the ecosystem.
🔹On-Chain Analysis of LINK
▪️ In the $18.48 to $19 price range, a significant number of LINK tokens are in loss, which could act as a resistance level. However, there is currently no substantial volume of coins in profit to establish strong on-chain support.
▪️ On a positive note, network activity is showing signs of recovery, with a rise in active and new addresses, reflecting increased user engagement. Additionally, 48% of LINK tokens are held by whales, a considerably higher percentage compared to other cryptocurrencies. This distribution makes price manipulation by whales more difficult, contributing to market stability.
▪️ From a supply and demand perspective, the recent price drop has led to increased demand from whales (addresses holding 10M–100M LINK), while retail investors have been selling. This redistribution of tokens from smaller holders to large investors could be interpreted as a bullish signal for the medium term.
✅ Now that we have reviewed the project, let's move on to the technical analysis of this coin
📅 Weekly Timeframe
As observed, after the conclusion of the 2021 bull run, LINK entered a correction phase and dropped to a low of $5.85. Upon reaching this level, it formed a very clean Accumulation Zone with a floor at $5.85 and a ceiling at $9.77.
🔍 After oscillating within this zone for about a year, LINK finally broke out towards the end of 2023, coinciding with Bitcoin’s new all-time high near $70,000. This upward move was robust, but following Bitcoin’s correction to a low of $54,000, LINK also pulled back deeply to $9.77, where it stabilized.
📊 The volume has been in favor of the buyers, and as the upward trend concluded and a corrective leg began, the volume decreased significantly. Once the volume reached its lowest, a large bullish candle entered the market, pushing the price up to a high of $30.16.
⚡️ Currently, as Bitcoin ranges and corrects, LINK is also undergoing a correction. The RSI oscillator shows that LINK has dipped below the 50 area, but as long as it remains above 42.88, I still view LINK’s momentum as bullish.
🛒 For buying opportunities, risky purchases could be considered upon confirming a break of $30.16 or a more substantial breakout at the ATH of $51.30. However, if the price heads back towards $9.77 and breaks this support, it could indicate that the bullish momentum and trend have fully concluded, potentially leading to new lows.
📅 Daily Timeframe
In the daily timeframe, let’s examine the price movement in more detail. There was an Accumulation Zone between $9.77 and $12.88. After breaking $12.88 and pulling back, the next bullish leg began, pushing the price up to $29.21—a significant resistance area where the price was rejected and entered a corrective phase.
✨ In the first corrective phase, the price moved down to the 0.382 Fibonacci level and, failing to set a new high beyond $29.21, broke lower beyond the 0.382 area. It is now at the 0.5 Fibonacci level.
🧩 Essentially, a price range box has been formed between the 0.5 and 0.382 Fibonacci levels. A break below this range could lead to further corrections, with the 0.618 Fibonacci level and the crucial $12.88 level as subsequent targets. If the price reaches $12.88, it would fully correct the entire bullish leg, signaling the end of the uptrend.
🔽 The critical trigger for entering a strong bearish momentum in this position would be a break below 34.49 in the RSI. If both this support and the 0.5 Fibonacci support are broken, it could lead to significant market panic.
👀 Conversely, if the price can rise above the 0.382 Fibonacci level and start a new bullish leg, breaking $29.21 could provide an excellent opportunity for a long position, even in spot markets.
📝 Final Thoughts
This analysis reflects our opinions and is not financial advice.
Share your thoughts in the comments, and don’t forget to share this analysis with your friends! ❤️

TradeCityPro | Bitcoin Daily Analysis #14👋 Welcome to TradeCityPro!
In this analysis, as usual, I aim to review the critical futures triggers for the New York session.
📰 Yesterday, news of the Bybit exchange hack emerged, and I will examine its impact on the charts and what it may mean for Bitcoin's future.
⏳ 1-Hour Timeframe
As observed, before the Bybit hack news, Bitcoin was trending upward and had breached the 98482 area. However, when the news broke, Bitcoin took a sharp downward turn, moving straight down to the box floor at 95108.
🔍 Bybit was reportedly hacked for $1.5 billion. Official statements assure that the exchange can fully reimburse its users, suggesting no substantial long-term financial impacts. The Bitcoin movement appears to be a reactionary drop due to the severe nature of the news and is not likely to have a lasting effect.
✨ However, it has shown that the 95108 area is extremely reliable and significant, potentially becoming a key level in the future. As you can see, I have retained the triangle that the price had been reacting to in recent weeks. If there is no reaction today, I will remove this triangle from tomorrow's chart as it appears that the price is more consistently within the box between 95108 and 98482, and the expanding triangle no longer seems relevant.
🔼 Currently, I cannot provide a firm long trigger for futures, and I have removed the 97816 trigger used previously. Such triggers are ineffective after being activated once, and we must wait for the price to establish a new structure.
⚡️ A risky long position could be taken on the breakout of 96516, which has been activated. If you observe a suitable candle with strong momentum during a pullback to this area, you may consider entering.
📉 For a short position, the very reliable trigger remains at 95108. If this area breaks, I will personally attempt to open a short position, as the strong reaction to yesterday's news demonstrated this support's significance.
📅 BTC.D Analysis
The situation hasn't changed much, and Bitcoin dominance continues to range as it has in previous days.
✅ Still, if the 61.04 level breaks, it confirms a bearish dominance, and a breakout of 61.49 would confirm bullish dominance.
📅 Total2 Analysis
For Total2, the trigger activated yesterday was a fake-out, but it caused the trigger to shift. Currently, there is a very promising long trigger for Total2 at 1.26, which the price has reacted to very well, suggesting it is a reliable area. For short positions, entering upon breaking 1.19 could be considered.
🧩 These positions are risky, and the main triggers are for breaking out of the box that lies between 1.16 and 1.28.
📅 USDT.D Analysis
USDT dominance reached the bottom of the box yesterday at 4.40 and showed a very strong reaction. Along with the Bybit hack news, it moved sharply upward to 4.62.
💫 Currently, dominance has been rejected from this area and returned to the middle of the box, indicating that the 4.40 and 4.62 levels are important for confirming positions. If either of these levels breaks, we can secure a long-term confirmation for the bullish or bearish direction of Bitcoin dominance.
❌ Disclaimer ❌
Trading futures is highly risky and dangerous. If you're not an expert, these triggers may not be suitable for you. You should first learn risk and capital management. You can also use the educational content from this channel.
Finally, these triggers reflect my personal opinions on price action, and the market may move completely against this analysis. So, do your own research before opening any position.
TradeCityPro | STXUSDT Reached Weekly Support👋 Welcome to TradeCityPro Channel!
Let's go together to analyze and review one of the popular cryptocurrency coins and Bitcoin's second layer and update our triggers
🌐 Overview Bitcoin
Before starting the analysis, I want to remind you again that we moved the Bitcoin analysis section from the analysis section to a separate analysis at your request, so that we can discuss the status of Bitcoin in more detail every day and analyze its charts and dominances together.
This is the general analysis of Bitcoin dominance, which we promised you in the analysis to analyze separately and analyze it for you in longer time frames.
📊 Weekly Timeframe
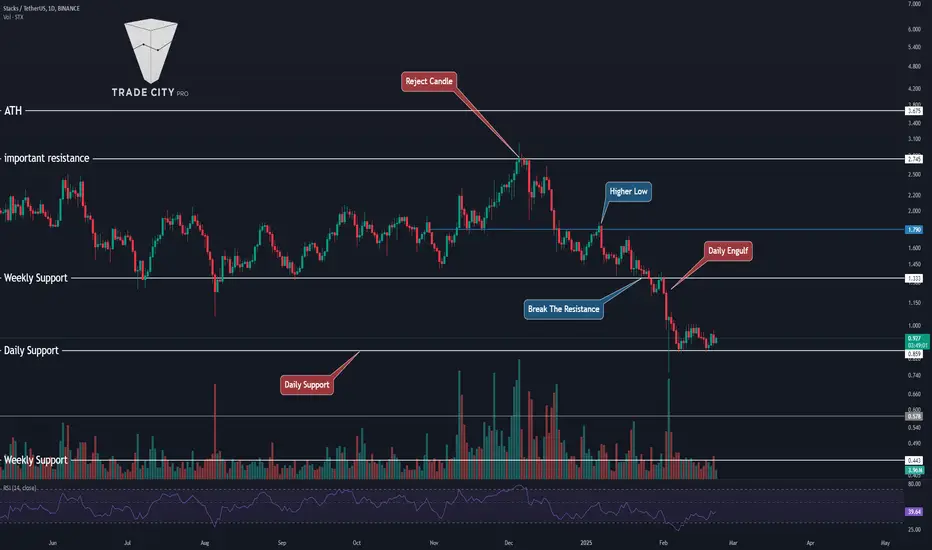
On the weekly time frame, stx is one of the coins that started its upward trend before the start of 2024, which caused the formation of its ATH and new ceiling
You can also see one of the best weekly trends in this coin, which is that after each time we hit this support trend line, we rose and made a sharper move.
Also, when this trend line was broken, we made a pullback to it and as we had given the weekly exit trigger with a break of 1.299 in the previous analysis, after the break of the trigger of the trend line, we experienced a sharp decline and reached the support level of 0.796 and now we need to form a structure.
📈 Daily Timeframe
On the daily time frame, but after the rejection of the important weekly resistance 2.745 and getting rejected, we started to correct the price and fall until this price correction turned into a trend change in the daily time frame
After forming the lower ceilings and floors, we reached important support and the trigger for the spot exit, which after the daily failure and pullback to that daily candle, engulfed the previous 3 candles and caused further decline, which led to us reaching the important support of 0.859
Currently, after hitting the support of 0.859 twice, our fall volume has not increased much and it can be said that the sellers do not intend to take the price below 0.859 for the time being, and this will cause us to go into the range and form a new structure. However, I will open a short with a failure of 0.859, but there is no buying at the moment.
⏱ 4-Hour Timeframe
We suffered enough in the four-hour time frame and formed a structure and we are in a range box that we can take a position from both sides
📉 Short Position Trigger
For my short position I open a position with a break of 0.859 and accept the stop loss. Since it is an important support, I try to place my stop loss in a logical space and not make it small.
📈 Long Position Trigger
For the long position, we have two triggers, one risky and one somewhat certain. You can open a position with a break of 0.953 and 1.005, respectively. The difference is that with a break of 0.953, the possibility of a stop loss is higher, and with a break of 1.005, the possibility of losing the position is higher. I choose to take the stop loss myself.
📝 Final Thoughts
Stay calm, trade wisely, and let's capture the market's best opportunities!
This analysis reflects our opinions and is not financial advice.
Share your thoughts in the comments, and don’t forget to share this analysis with your friends!
TradeCityPro | Bitcoin Daily Analysis #13👋 Welcome to TradeCityPro!
Today's analysis will focus on crucial futures triggers for the New York session as usual. The recent news of the Bybit exchange hack will also be discussed to see its potential future impact on Bitcoin.
⏳ 1-Hour Timeframe
As you can see, before the news of the Bybit hack, Bitcoin was moving upward and had broken through the 98482 region. However, upon the news release, Bitcoin began a sharp downward move, reaching the floor of the box at the 95108 area.
🔍 Bybit was hacked for an amount of $1.5 billion, but it has been officially announced that the exchange can fully reimburse its users, indicating no long-term financial instability from the hack. The movement in Bitcoin seems to be a reactionary dip due to the sudden bad news, and I believe it won't have a lasting impact.
⚡️ However, what has become apparent is that the 95108 area is a very reliable and important region, which could become one of the key areas in the future. As you can see, I have maintained the triangle that the price had been reacting to over the past few weeks. If there is no reaction today, I will remove this triangle from the chart tomorrow since it appears that the price is more contained within the box between 95108 and 98482, and the expanding triangle is no longer visible.
✅ At this time, I cannot give a definite long trigger for futures as the 97816 trigger used previously has been removed. Such triggers lose their effectiveness after being activated once, and we need to wait for the price to form a new structure.
📈 A risky long position could be entered upon the breakout of 96516, which has already been activated. If you see a suitable candle with good momentum during a pullback to this area, you may consider entering.
🔽 For a short position, the very clear trigger remains at 95108. If this area breaks, I personally will attempt to open a short position as the strong reaction to yesterday's news demonstrated that this support could be very significant.
📅 BTC.D Analysis
The situation hasn't changed much, and Bitcoin dominance has been ranging as in the past few days.
💥 Still, if the 61.04 level breaks, it confirms a bearish dominance, and a breakout of 61.49 would confirm bullish dominance.
📅 Total2 Analysis
For Total2, the trigger activated yesterday was a fake-out, but it caused the trigger to shift. Currently, there is a very promising long trigger for Total2 at 1.26, which the price has reacted to very well, suggesting it is a reliable area. For short positions, entering upon breaking 1.19 could be considered.
✨ These positions are risky, and the main triggers are for breaking out of the box that lies between 1.16 and 1.28.
📅 USDT.D Analysis
USDT dominance reached the bottom of the box yesterday at 4.40 and showed a very strong reaction. Along with the Bybit hack news, it moved sharply upward to 4.62.
🧩 Currently, dominance has been rejected from this area and returned to the middle of the box, indicating that the 4.40 and 4.62 levels are important for confirming positions. If either of these levels breaks, we can secure a long-term confirmation for the bullish or bearish direction of Bitcoin dominance.
❌ Disclaimer ❌
Trading futures is highly risky and dangerous. If you're not an expert, these triggers may not be suitable for you. You should first learn risk and capital management. You can also use the educational content from this channel.
Finally, these triggers reflect my personal opinions on price action, and the market may move completely against this analysis. So, do your own research before opening any position.
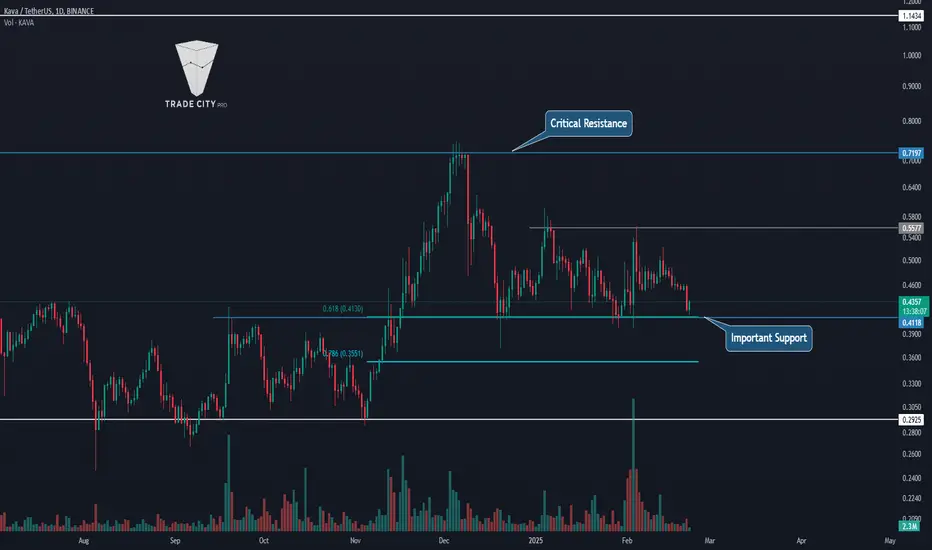
TradeCityPro | KAVA: A Dive into DeFi's Cosmos Ecosystem👋 Welcome to TradeCityPro!
In this analysis, I want to discuss the KAVA coin, a notable DeFi platform in the Cosmos ecosystem, which currently ranks 129th with a market cap of $472 million.
📅 Weekly Timeframe
We are witnessing a downward trend in the weekly timeframe, where the price has been moving along a descending trend line, with the most recent bottom recorded at the $0.2872 area.
🔍 Currently, a significant price ceiling has been set at $0.6981, and the price has recently been rejected from the descending trend line, likely moving towards the support floor again.
🔼 The support at $0.2872 is crucial, and if broken, the price could set a new historical bottom. For the trend to turn bullish, confirmation will come after breaking the trend line and surpassing the resistance at $1.1434.
📊 Volume divergence has been observed with the trend for some time now, but this divergence has yet to impact the trend, which continues to persist.
📅 Daily Timeframe
In the daily timeframe, we can observe the price movement in greater detail.
⚡️ As you can see, after reaching $0.7197, a corrective phase began, and currently, at the 0.618 Fibonacci level, a significant support has formed, overlapping with the $0.4118 area, creating a Potential Reversal Zone (PRZ).
✅ If the support at $0.4118 is breached, we might witness the next downward leg of the price, which could extend to the 0.786 Fibonacci level, and in case of increased downward momentum, the next target could be at $0.2925.
🛒 On the other hand, for a long-term long position, you could enter upon breaking the trigger at $0.5577, holding the position towards a target of $0.7179. The main trigger for spot buying is also $0.7179, but it is better to get the spot trigger confirmation from this coin’s Bitcoin pair.
📝 Final Thoughts
This analysis reflects our opinions and is not financial advice.
Share your thoughts in the comments, and don’t forget to share this analysis with your friends! ❤️
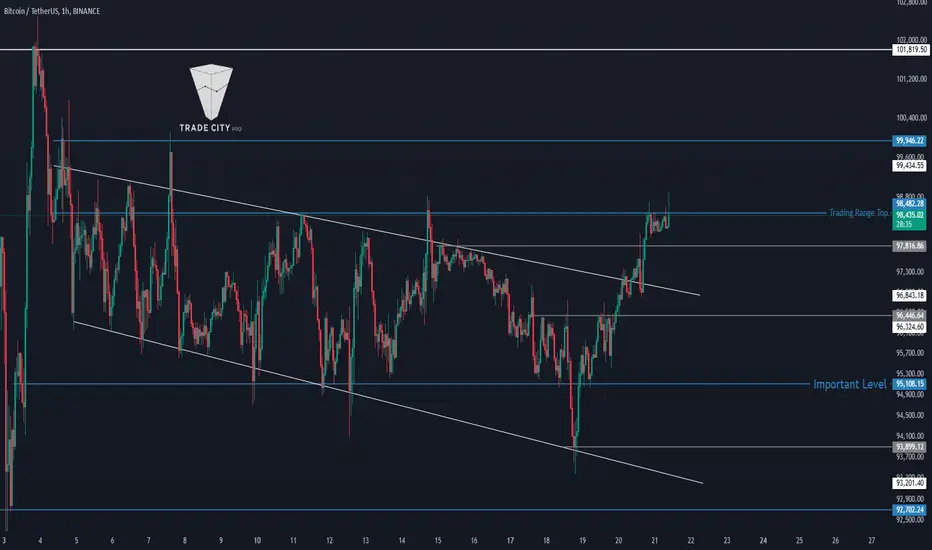
TradeCityPro | Bitcoin Daily Analysis #12👋 Welcome to TradeCityPro!
In today's analysis, as usual, I want to review important futures triggers for the New York session. Today's analysis reaches you a bit earlier than usual because the price is at a very critical area, and I want you to have this analysis in case this area breaks.
⏳ 1-Hour Timeframe
As you can see in the 1-hour timeframe, after the fake break of 95108, a very strong bullish momentum entered the market, and as you can see, the volume and the number of green candles are much higher than the red ones, indicating the strength of the buyers.
🔍 The first trigger we had in this bullish wave was at 96446, which was activated two days ago and has given us very good profits so far. I mentioned yesterday's trigger to you as well; in case of breaking the expanding triangle and activating the trigger at 97816, you could open a risky long position, and the main trigger is 98482. Yesterday's trigger has also been activated and is still in profit, and today we have a very good trigger for long, which can help us open a position.
📈 Today's trigger for long is 98482, which can be a very suitable trigger, and if this area breaks, the first target is 99946 and the second target is 101819. I'm not removing the expanding triangle from the chart yet because if the price does a fake breakout of 98482, we can revert to the triangle structure. Therefore, I will keep the triangle on the chart until 98482 is broken.
📅 BTC.D Analysis
Let's go to the Bitcoin dominance. As you can see, the situation with dominance hasn't changed much compared to yesterday and is still fluctuating between the areas of 61.49 and 61.04.
📊 Breaking any of these areas could define the next leg of the price, and if 61.04 breaks, the price chart could move down to 60.48. On the other hand, if the area 61.49 is broken, the price could move up to 62 percent.
📅 Total2 Analysis
Moving on to the analysis of Total2. Total2 has not yet activated its appropriate long trigger while Bitcoin dominance has been ranging, but Total2 still hasn't activated its long trigger in the area of 1.24, and the position you open on altcoins can be confirmed if 1.24 breaks.
🔽 For short positions, you can enter a short position if 1.22 breaks and confirm it for altcoins. Keep an eye on Bitcoin dominance to decide which one between Bitcoin and altcoins is better for opening positions.
📅 USDT.D Analysis
Finally, the Tether dominance has reached a very important support area. This area was at 4.46 yesterday, but due to the reaction dominance had to this area and it slightly moved, it has now shifted this area to 4.45, and if this area breaks, you can enter a position where your first target will be 4.40.
🔑 On the other hand, if the dominance starts to move upwards, you can confirm a short position with a break of 4.52, which in this case, the price can move up to 4.62.
❌ Disclaimer ❌
Trading futures is highly risky and dangerous. If you're not an expert, these triggers may not be suitable for you. You should first learn risk and capital management. You can also use the educational content from this channel.
Finally, these triggers reflect my personal opinions on price action, and the market may move completely against this analysis. So, do your own research before opening any position.
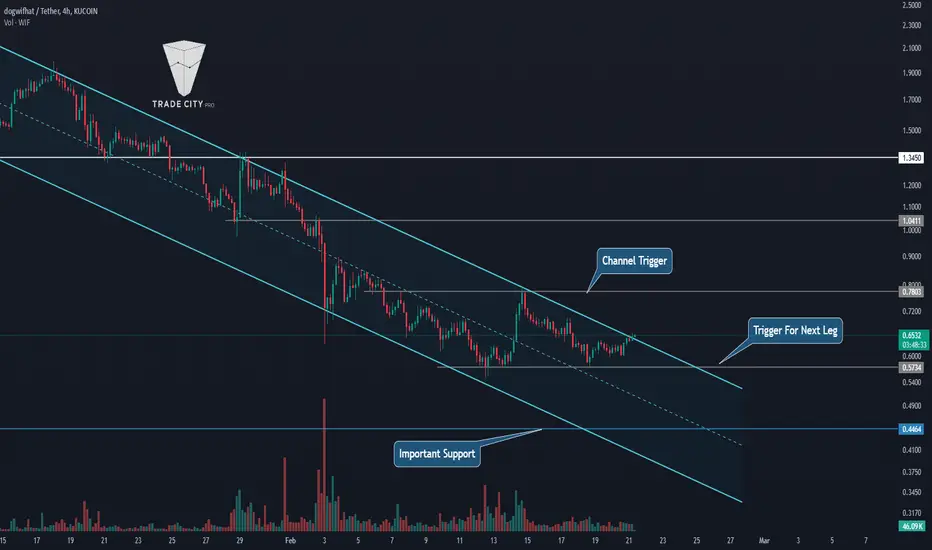
TradeCityPro | WIF: Diving into the Dynamics of a Popular Meme👋 Welcome to TradeCityPro!
In this analysis, I want to examine the coin WIF, which you requested in the comments. This project is one of the famous meme coins in the crypto world, operating on the Solana network, and it has a market cap of $655 million, ranking it 105th on CoinMarketCap.
📅 Daily Timeframe
In the daily timeframe, we are witnessing a downward trend that started from a high of 3.9560 and has continued down to 0.5852. The market volume has also converged with the trend, indicating that the selling pressure has been much stronger than buying.
❌ If you previously purchased this coin, you should have set a stop-loss after the price stabilized below 1.3886. However, if you haven’t done this yet, I cannot specify a stop-loss area for you now because there's a significant support area at 0.4464, and we need to see how the price reacts to this area.
🛒 If you're looking to buy this coin, first of all, I should mention that purchasing meme coins is very risky, and I personally neither buy meme coins nor recommend buying them. But if you want to buy this coin, you should wait for a trend reversal. For a trend change, we need a new structure to form and a suitable trigger to confirm the trend change.
🔼 If the price breaks 0.5852 and the RSI enters the oversold area, we could open a very good long-term position. A break of 34.36 in this indicator gives us the first confirmation of entering bullish momentum, but this confirmation is not reliable at all and only serves to confirm futures triggers.
⏳ 4-Hour Timeframe
In the 4-hour timeframe, I want to specify the futures triggers for you. We also have an interesting ascending channel, to which the price has reacted very well so far, and breaking this channel from any side could provide a good position.
🔍 Currently, it seems there's a range box between 0.5734 and 0.7803, which has timed the price's move from the box's floor to its ceiling.
📈 For a long position after the channel break, you can enter with a trigger of 0.7803 targeting 1.0411 and 1.345, but keep in mind that we've had a very strong downtrend, and this position is against the trend.
🔽 For a short position, our trigger is very clear, and if 0.5734 is broken, you can enter, and your target could be the bottom of the channel.
📝 Final Thoughts
This analysis reflects our opinions and is not financial advice.
Share your thoughts in the comments, and don’t forget to share this analysis with your friends! ❤️
TradeCityPro | Bitcoin Daily Analysis #11👋 Welcome to TradeCityPro!
In this analysis, as usual, I'll review the appropriate futures triggers for the New York session.
🔄 Yesterday, the market activated the long trigger and rose from the box's floor, so before delving into today’s analysis, I’ll also review this trigger for you.
⏳ 1-Hour Timeframe
Yesterday, the trigger I had set at 964446 was activated and provided a very good position. The top line of the Expanding Triangle is also being broken, and the trigger for breaking this triangle will be at 97816.
⚡️ If, concurrently with the break of the triangle's upper line and the trigger of this triangle, volume also increases, we can say that bearish momentum has entered the market and the price might finally exit the range box it has formed.
🔼 The main trigger is the break of the box’s ceiling at 98482, and if this area is broken, we can confirm the price’s bullish trend.
📊 For a long position, the appropriate trigger seems to be breaking 97816, and I personally am waiting for this trigger. A break of 65.46 in the RSI would give me a momentum entry trigger.
📉 For a short position, we must first wait for the bullish momentum in the market to dissipate and wait for bearish momentum to arise and create a short trigger structure. Until then, the short triggers will be from 96446 to 95108.
📅 BTC.D Analysis
Let’s move on to the analysis of Bitcoin dominance. Yesterday, dominance was ranging, and almost no difference was noted from the previous day, but I've adjusted the area from 61.10 to 61.04. If this area is broken, dominance could move downward toward 60.48.
🔑 For an increase in dominance, if 61.49 is broken, we can expect the upward trend to reach 62%.
📅 Total2 Analysis
Moving on to Total2. Yesterday, the trigger at 1.21 was activated, and this index is moving upward. The next resistance that price could face is at 1.24, and if this resistance is broken, Total2 could move up to 1.28.
Conversely, if Total2 moves downward again, the short trigger will be at 1.19. Keep an eye on Bitcoin dominance to decide whether to open positions on altcoins or Bitcoin.
📅 USDT.D Analysis
Let’s discuss Tether dominance. In this chart, our trigger from yesterday, 4.55, was activated like Total2, and this area was broken. Currently, the next support for Tether dominance is at 4.46.
If 4.46 is broken, the next area will be 4.40, and for confirming a long position, you can use the break of these supports. Conversely, for a short position, if 4.62 is broken, Tether dominance will increase, indicating that the market will be bearish.
❌ Disclaimer ❌
Trading futures is highly risky and dangerous. If you're not an expert, these triggers may not be suitable for you. You should first learn risk and capital management. You can also use the educational content from this channel.
Finally, these triggers reflect my personal opinions on price action, and the market may move completely against this analysis. So, do your own research before opening any position.
TradeCityPro | CHZ: The Sports Enthusiast's Crypto Play👋 Welcome to TradeCityPro!
In this analysis, I want to review the CHZ coin. Chiliz is a sports project within crypto that creates fan tokens for world-famous clubs.
🔍 For example, clubs like Atlético Madrid, Barcelona, Manchester City, Juventus, and others use this project to create their fan tokens, and fans of these teams can support their favorite team by purchasing these tokens. Currently, the CHZ coin has a market cap of $499 million and is ranked 122 on CoinMarketCap.
📅 Weekly Timeframe
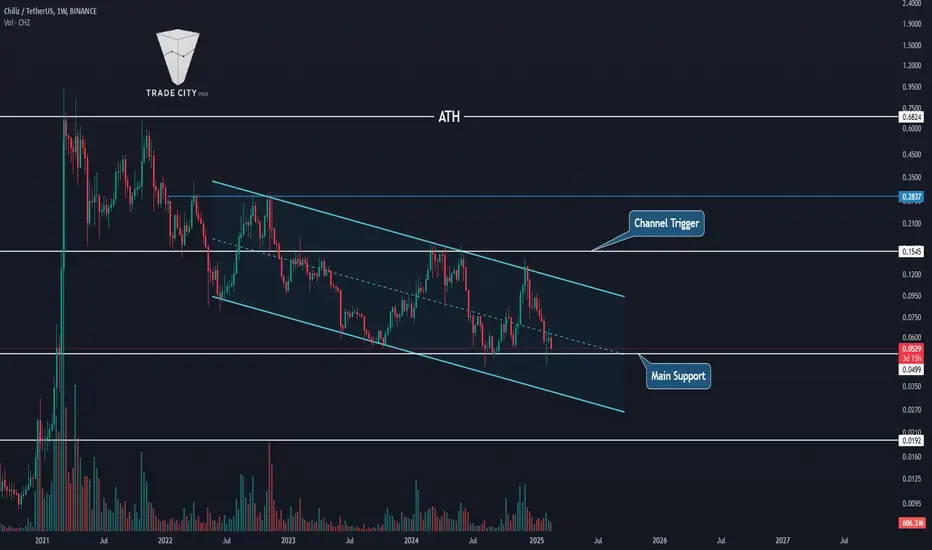
As you can see in the weekly timeframe, after the sharp price pump that occurred in 2021, the price reached the area of 0.6824. After reaching this area, the price changed direction and underwent a downward trend down to the support at 0.0499, experiencing more than a 90% decline.
🔽 In this downward trend, we observe a descending channel where the price has reacted well to both the channel’s ceiling and its floor. In the latest upward movement, as you can see, the price did not reach the bottom of the box, and if you notice, each time in the previous two upward and downward movements within this channel, the upward movements had more volume than the downward ones, indicating the buyers' strength.
⚡️ Currently, the most important support for this coin is at 0.0499, which is near this area. If this area is broken, we might witness a price drop to the channel's bottom or even to the next support area at 0.0192.
🚀 On the other hand, if this support can push the price back up and the price also breaks out of the downward channel, the channel's trigger area will be 0.1545, which is also a very important resistance. If this trigger is broken, we can say that the price’s upward trend will start, and the price can move towards higher targets.
💥 The price targets, if this trigger is activated, might be the area at 0.2837, which is very important, and the ATH area at 0.6824.
📅 Daily Timeframe
Moving on to the daily timeframe, we can see more details of the price movement within the range box.
✨ As you observe, the price has had an upward trend up to the area of 0.1333 and hasn’t reached the top of the box, which itself indicates the weakness in the buyers' power. After changing direction, it engulfed 100% of the previous upward leg.
✅ Currently, there is a very important support area and a significant demand zone at the bottom of the box, where the price has entered, and we need to see how it will react to this area. I have marked this area on the chart for you.
🔑 We will confirm the change in direction and the onset of an upward price trend if the 0.0641 level is broken, which would activate a Double Bottom pattern. However, keep in mind that there is currently no Double Bottom, and if the price is supported from this range and moves upward again, a Double Bottom pattern would occur if the 0.0641 level is broken.
📈 So be careful not to preempt this pattern. The main triggers for buying are areas 0.1333 and 0.1659, which if broken, could see the price move towards the weekly targets I specified, such as 0.2837. However, if the supply area is broken and the trend turns downward, the price could move downwards, and the next downward leg could occur, with targets for this scenario also specified in the weekly timeframe.
📊 The volume of this coin in the daily timeframe, as you can see, does not display well and is not very good. For this reason, I am not going to lower timeframes to find futures triggers because coins with low volume and inaccurate volume data are not suitable for trading in futures. Therefore, I suggest not trading this coin in futures.
📝 Final Thoughts
This analysis reflects our opinions and is not financial advice.
Share your thoughts in the comments, and don’t forget to share this analysis with your friends! ❤️
TradeCityPro | Bitcoin Daily Analysis #10👋 Welcome to TradeCityPro!
Let's analyze Bitcoin and key crypto indices, focusing on the suitable futures triggers for today's New York session. Yesterday, we could have opened both short and long positions, which would have been profitable.
⏳ 1-Hour Timeframe
Before starting today's analysis, let's review the triggers from yesterday and see which ones were activated. The 95108 trigger, which we've been waiting for a break, was finally breached yesterday, and I personally took a position in a shorter timeframe, achieving a risk to reward ratio of 3. However, the hourly timeframe didn't provide a very accurate position, and if you hadn't moved to a shorter timeframe, you probably would have missed this move.
📣 I've also adjusted the lower line of the Expanding Triangle because, as you see, yesterday's downward movement continued down to 93899, and with the new line I drew, this area coincides with the bottom of the triangle, and overlapping these two areas, the price has moved upwards, effectively invalidating the entire downward move.
🔍 But the point is that with this change, we can say the Expanding Triangle no longer exists, and the price is more moving in a descending channel. I tried to draw the channel using the parallel channel tool, but it didn't turn out well, so the two trend lines I've drawn now seem to be the best possible arrangement.
🔄 This morning, if you were following along and looking to open a long position, you could have done so with a fake breakout and pullback to this area, which would have also yielded a good profit if opened in shorter timeframes.
🧩 As for today's triggers, we have 96382 for long positions, which the price is very close to, and it's possible that by the time I publish this analysis, this trigger might have been broken. If this trigger has been broken at the time of publishing this analysis, the next triggers will be 97816 and 98482.
🔽 For short positions, the 95108 area still seems appropriate to me. The price has pulled back to this area this morning, and if it returns to this area again, it could be a good trigger for a short position. On the other hand, the RSI has also crossed the 55.79 area, which could be a good confirmation for a long position, and we currently have RSI confirmation for upward momentum.
💥 If the RSI can activate its triggers, we can make the most of the upward momentum that has entered the market. The reason I'm using the RSI today, unlike previous days, is that a strong downward momentum entered yesterday, causing the price to fall to 93899.
⚡️ Now, upward momentum has entered, reversing this downward movement and returning above the 95108 support. This means the market's momentum has reversed, and the long momentum trigger has also been activated.
📅 BTC.D Analysis
Bitcoin's dominance reacted very well to the areas we identified yesterday and has formed a range box between 61.10 and 61.49. Currently, dominance is at the bottom of the box, and if it breaks 61.10 along with activating the long trigger, opening a long position on altcoins will be better than on Bitcoin. For long positions on altcoins in Total2, I will specify the triggers you can use.
✅ However, if at the same time the long trigger is activated, the 61.49 area is also broken, Bitcoin itself will be better for longs than altcoins. If the market turns short and Bitcoin dominance falls, Bitcoin itself will perform better than altcoins, and the downward target for Bitcoin dominance remains 60.48, while if 61.49 is broken, the upward target will be 62%.
📅 Total2 Analysis
Let's look at the Total2 analysis. Yesterday, the short trigger for Total2 was activated, and since Bitcoin dominance was also increasing simultaneously with this drop, a short position on altcoins would have offered better returns. For example, the coin GRT would have given a better entry than Bitcoin.
🔑 But today, the trigger we have for Total2 for longs was 1.21, which has already been breached, and the price has closed above this area. However, if you want to hold a long position on altcoins, if the price pulls back to this area, you can open a long position.
🔼 I recommend that if Bitcoin dominance increases, ignore Total2 and open a long position on Bitcoin. But if dominance starts to fall, try to open a long position on altcoins during a pullback or whatever other setup you know to open positions.
✨ For short positions, the 1.19 area is still very suitable, and like Bitcoin, Total2 has also pulled back to this area, showing it is still important and valid.
👀 Note that as long as Total2 is between the 1.1 to 1.28 box, all positions you open in the market are considered risky, and you should quickly secure profits and focus on low risk-to-reward ratios like two or three. Don't leave positions open hoping for higher risk-to-reward ratios, as this could cause you to lose the profits you have.
📅 USDT.D Analysis
Let's move on to the USDT.D analysis. This index broke the 4.62 area we had marked as a target, but it was a fakeout, and now it seems downward momentum has entered. The trigger for this index was 4.55, like Total2, this trigger has been activated, and the next trigger I see now is 4.46.
💫Again, if you get a suitable confirmation from Bitcoin dominance, try to have long positions on altcoins in the pullback of Total2 and USDT.D to the areas they've broken. If Total2 starts to fall and USDT.D breaks the 4.62 area, it's a very good trigger for short positions, and depending on Bitcoin's dominance, you can choose the appropriate coin to open positions on.
❌ Disclaimer ❌
Trading futures is highly risky and dangerous. If you're not an expert, these triggers may not be suitable for you. You should first learn risk and capital management. You can also use the educational content from this channel.
Finally, these triggers reflect my personal opinions on price action, and the market may move completely against this analysis. So, do your own research before opening any position.
TradeCityPro | ADAUSDT Is the Downtrend Continuing?👋 Welcome to TradeCityPro Channel!
Let's take a look at one of the most popular cryptocurrency coins, review our previous analysis on this coin, and find our triggers!
🌐 Overview Bitcoin
Before starting the analysis, I want to remind you again that we moved the Bitcoin analysis section from the analysis section to a separate analysis at your request, so that we can discuss the status of Bitcoin in more detail every day and analyze its charts and dominances together.
This is the general analysis of Bitcoin dominance, which we promised you in the analysis to analyze separately and analyze it for you in longer time frames.
🕵️♂️ Previous Analysis
In the previous analysis, we had already identified our analytical levels and said that after the break of 0.8360, we would have the possibility of a sharp decline, and that is what happened, and after the decline, we are currently in a pullback to this level!
📊 Weekly Timeframe
On the weekly time frame, ADA, like sol, sui, xrp and most of the top ten coins in the market, is still in a better situation and the price is fluctuating at higher levels
After being rejected at 1.1983 and losing support at 0.7959, we experienced a sharp drop to 0.50, and this was the result of Trump and the US tariffs on other countries and caused panic in the market!
The buy trigger is still above 1.1983, but because it is in a better situation, I will give you a trigger for this coin in lower time frames, but I had said that selling below 0.7959 was a temporary sale and I do not have a trigger to exit at the moment!
📈 Daily Timeframe
But interesting things are happening on the daily time frame and we are still clearly at higher levels than other altcoins and if we have a trend change in the market itself, we can be careful for a long trigger sooner
After breaking 0.8204 and losing the 0.236 Fibonacci level, we experienced a Sharpe decline that also became high and I myself expected that after this volume we would go from volatility to forming a range box and this is also happening and we are forming a box of 0.6777 to 0.8204, but if today's daily candle closes like this, we will continue the downtrend!
The spot purchase trigger if we are in this space more in this box that I have specified for you will be after the break of 0.8204 or the formation of a higher ceiling and floor in this box, but your next exit trigger if you do not exit at 0.8204, if it breaks at 0.6777, it is recommended to exit or at least save profit!
⏱ 4-Hour Timeframe
In the four-hour time frame, the conditions of this coin are such that you can open both short and long positions, and it is one of the coins that you should have on your watchlist for this period and watch!
📈 Long Position Trigger
it is quite clear and after the break of 0.8204, I will open a futures position myself and it will probably be so that I continue to hold it and open it long-term
📉 Short Position Trigger
today's trigger was activated earlier and 0.7681, I opened a low-risk short position myself, but the main trigger after the break will be 0.6806 and try to have a short position before that break
📝 Final Thoughts
Stay calm, trade wisely, and let's capture the market's best opportunities!
This analysis reflects our opinions and is not financial advice.
Share your thoughts in the comments, and don’t forget to share this analysis with your friends! ❤️

TradeCityPro | Bitcoin Daily Analysis #9👋 Welcome to TradeCityPro!
Let's dive into today's Bitcoin and key crypto indices analysis. We'll review today's triggers for the New York session.
⏳ 1-Hour Timeframe
Hourly Time Frame The triggers I provided yesterday remain unchanged and none have been activated yet. I've slightly modified the long trigger, but the short trigger remains the same as yesterday. Let's review these triggers.
🔽 For short positions, the 95108 area is still excellent and a very strong zone. The candle from three hours ago reacted well to this area, so if it breaks, I personally will attempt to open a short position targeting the bottom of the Expanding Triangle or 92702. The market volume, as you see, is decreasing, which doesn't strongly signify trend strength.
📊 As you know, during the initial drop when the price approached the 95108 area, there was an upward volume, but currently, as the price is falling, the volume is decreasing, indicating a weakness in sellers' strength and potentially the trend. However, I will still open a position if 95108 breaks, and if the declining volume persists, I'll reduce the risk of the position and enter with less capital.
⚡️ For long positions, we have a new trigger at 96849, which reacted very well yesterday with a large engulfing candle that engulfed all of the previous day's candles, injecting significant momentum into the market. Therefore, open a very risky long position if 96849 breaks.
👀 Keep in mind, the main long position will be after the Expanding Triangle breaks, and one of the triggers 97816 or 98482, with the first being riskier and the second more secure.
📅 BTC.D Analysis
BTC Dominance Analysis Let's move to the analysis of Bitcoin dominance. In yesterday's analysis, I mentioned that if dominance could stabilize above the 60.95 area, it could ascend and move higher. This has occurred, and in addition to breaking 60.95, the 61.10 area has also been breached, and currently, it seems dominance is pulling back to this area.
✨ As you can see, before this, the 60.48 area, which confirmed the dominance's downward trend, was also active, but it couldn't stabilize the price below this area, and with an engulfing candle, it moved back up, initiating this upward move.
💥 Currently, the next resistance for Bitcoin dominance is at 61.49, and we need to see if the price reaches this area and how it reacts.
📅 Total2 Analysis
Total2 Analysis As you can see in the Total2, we have a very long-term range box from 1.16 to 1.28.
✅ Yesterday's triggers for Total2 were activated, and both 1.24 and 1.23 were broken, which, with the increase in Bitcoin dominance, means that altcoins have provided more profit in short positions compared to Bitcoin.
🔑 Currently, the next trigger for Total2 is 1.19, and we need to see if it can break this support. For long positions, we don't have a specific trigger yet and must wait for the price to form a new structure to see which area it reacts to. Until then, the main short long trigger will remain at 1.28.
📅 USDT.D Analysis
USDT Dominance Analysis As observed in the Tether dominance chart, I mentioned yesterday that if the descending trendline is broken, we can expect an increase in Bitcoin Tether dominance up to a ceiling of 4.62, which has occurred.
🛎 If the 4.62 area breaks, the next target will be the 4.75 area, a significant ceiling in Tether dominance. Conversely, if dominance is rejected from this area and moves downward, the 4.48 area will still be a suitable trigger for a downward trend in Bitcoin dominance, with the main support for Tether dominance at 4.40.
❌ Disclaimer ❌
Trading futures is highly risky and dangerous. If you're not an expert, these triggers may not be suitable for you. You should first learn risk and capital management. You can also use the educational content from this channel.
Finally, these triggers reflect my personal opinions on price action, and the market may move completely against this analysis. So, do your own research before opening any position.
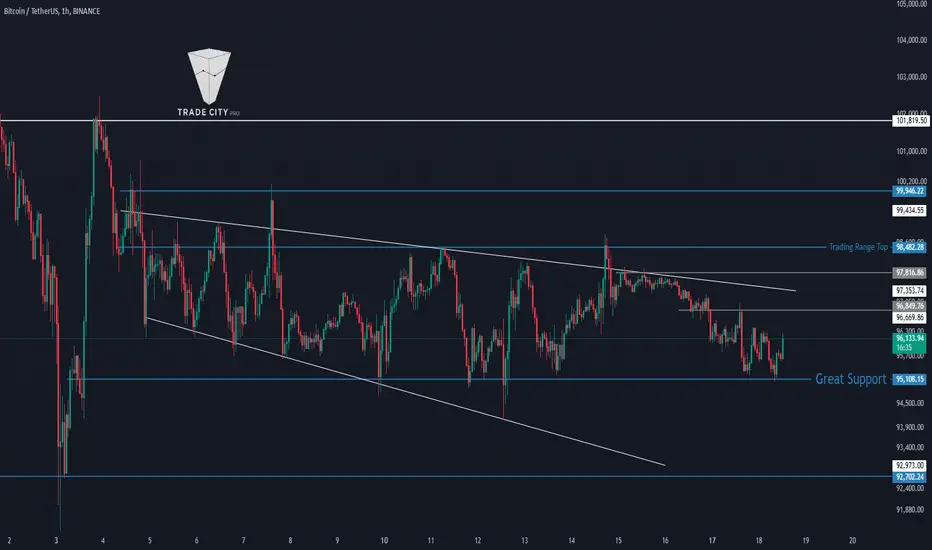
TradeCityPro | XVS : Navigating Market Dynamics👋 Welcome to TradeCityPro!
In this analysis, I want to review the XVS coin for you, as requested in the comments. So, I decided to analyze this coin in weekly, daily, and four-hour timeframes.
🔍 The Venus project is one of the DeFi projects active in Lend and Borrow, boasting a TVL of $1.88 billion, ranking it among the top platforms on the Binance network. It's one of the most reputable projects on this network. The project's coin, named XVS, offers additional capabilities on this platform through staking and holding.
📅 Weekly Timeframe
In the weekly timeframe, we see a very large range box starting from a floor of 3.34 and a ceiling at 17.61. XVS is considered a heavy coin due to a lot of staking and a significant number of whales and holders. This means it experiences fewer fluctuations because it has a large amount of money invested in it. Despite Bitcoin and other coins that are near or even above their previous ATHs, this coin is still in its consolidation box.
✨ Another very important support is at 5.45, which is crucial and the price has hit it several times. The market volume started to decrease after reaching the resistance at 17.61 but has increased again in recent weeks. This shows that whales are moving back towards this coin, increasing both the inflow and outflow of money, and consequently, the 24-hour volume has also increased.
🚀 If the price can stabilize above 17.61, we can expect the start of an upward trend and the price could move towards higher targets. The targets for this coin are at 38.73 and 141 dollars. Given the market cap of 137 million dollars, if the project becomes one of the successful crypto projects and attracts more holders and whales, the targets I mentioned will be attainable and not far-fetched.
⚡️ Another important note in the chart is that the 5.45 support, as I mentioned, is crucial, and if it breaks and the RSI also drops below 38.36, the situation for this coin will be very grim. We can expect the price to even break below the floor of 3.34 and move towards newer lows.
📅 Daily Timeframe
As you can see in the daily timeframe, after breaking 7.99, the price moved down to 4.98, but we observed a V pattern in the price that caused it to move back above 7.99. Given the large volume of buying seen in the candles, it seems a significant upward momentum has entered the market, and I believe if the price can continue upwards and break the 11.85 area, we can expect the next bullish leg and even the appropriate momentum to break the 1.49 to finally start the upward trend of this coin in higher cycles.
🔽 On the other hand, if the price forms a lower ceiling relative to 11.85 and moves back towards 4.98, if this area breaks, the next support will be at 3.33. In the RSI, for a bullish position and to confirm the upward trend, breaking the 70 area can give us a suitable confirmation, but for a downward momentum, I currently don’t have a specific trigger and we need to wait for the site and market structure to form to see what trigger it gives us for the entry of downward momentum.
⏳ 4-Hour Timeframe
Let's go to the 4-hour timeframe to specify the futures triggers. As you can see, we can observe the last bullish leg of the price in this timeframe with more details.
📊 After being supported at 4.87 and moving upwards, the price reached 9.10. As you see above, a divergence in the RSI has occurred. Despite the price hitting two identical peaks at 9.10, the RSI has made a lower peak, which could indicate a divergence. The divergence trigger, which was the 50 area, was activated in yesterday’s candle, and we can expect to see the effect of this divergence in the market.
💥 However, keep in mind that in bullish trends with very high momentum, the presence of divergence is due to the mathematical calculations of the RSI and is completely natural. So until the price falls below the 7.69 area, we will not see the effect of the divergence on the price, and the divergence we see will simply be due to the formula and mathematical calculations of the RSI.
🧩 If the 7.69 area breaks, the price might make deeper corrections down to the 0.382 and 0.618 Fibonacci levels, which correspond to areas of 7 dollars and 6.12 dollars respectively. For a long position, our task is very clear and has a good trigger. If the 9.10 area breaks, we can open a long position towards the 11.85 target.
📝 Final Thoughts
This analysis reflects our opinions and is not financial advice.
Share your thoughts in the comments, and don’t forget to share this analysis with your friends! ❤️
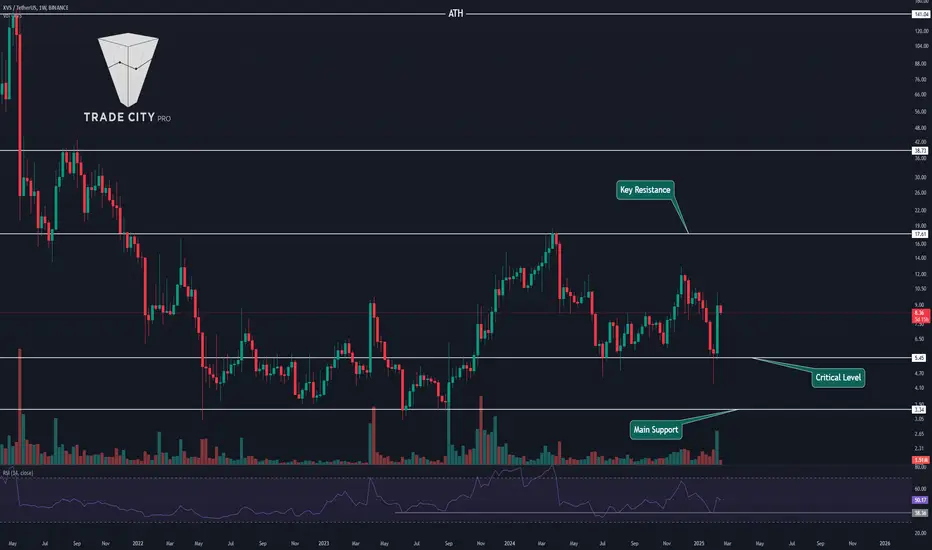
TradeCityPro | JUPUSDT Is Solana the best dex?👋 Welcome to TradeCityPro Channel!
Let's go together and analyze one of the best dexes of these days, Solana, which handles a high number of transactions and has relatively good performance, because I myself would like it to be one of the coins in my basket!
🌐 Overview Bitcoin
Before starting the analysis, I want to remind you again that we moved the Bitcoin analysis section from the analysis section to a separate analysis at your request, so that we can discuss the status of Bitcoin in more detail every day and analyze its charts and dominances together.
This is the general analysis of Bitcoin dominance, which we promised you in the analysis to analyze separately and analyze it for you in longer time frames.
📊 Weekly Timeframe
We don't have many candles on the weekly time frame, and the reason is that this coin is new and its dex space, but being in this range box is also quite acceptable for this coin.
In the weekly box we are in, there is some sellers' pressure due to the higher selling volume, but since we are in the range box, it doesn't make much difference to us and we can take a position from whichever side it comes out.
To buy again now, after the box ceiling and 1.2535 break, even if you participated in its private sale, it makes sense to cash out some of your tokens and exit, but your main exit point after the break is 0.6951 and you can cash out!
📈 Daily Timeframe
On the daily time frame, we are still in the box range, but we were rejected earlier than the resistance of 1.2681 and are forming lower ceilings and are on the important support of 0.7903
What happened is that after we did not reach our main trigger spot, which was 1.2681, the events of the Trump and his wife's token launch occurred, which both increased the trading volume on these two tokens in this dex and caused fluctuations on this token that these fluctuations can be ignored!
We are on the important support of 0.7903 and this support will essentially be a trigger before the main support trigger and its precursor, and we can open short positions by breaking this level. For buying, the sellers' power is currently very high and we need a change in momentum, which we will update this analysis whenever it happens!
📝 Final Thoughts
Stay calm, trade wisely, and let's capture the market's best opportunities!
This analysis reflects our opinions and is not financial advice.
Share your thoughts in the comments, and don’t forget to share this analysis with your friends! ❤️
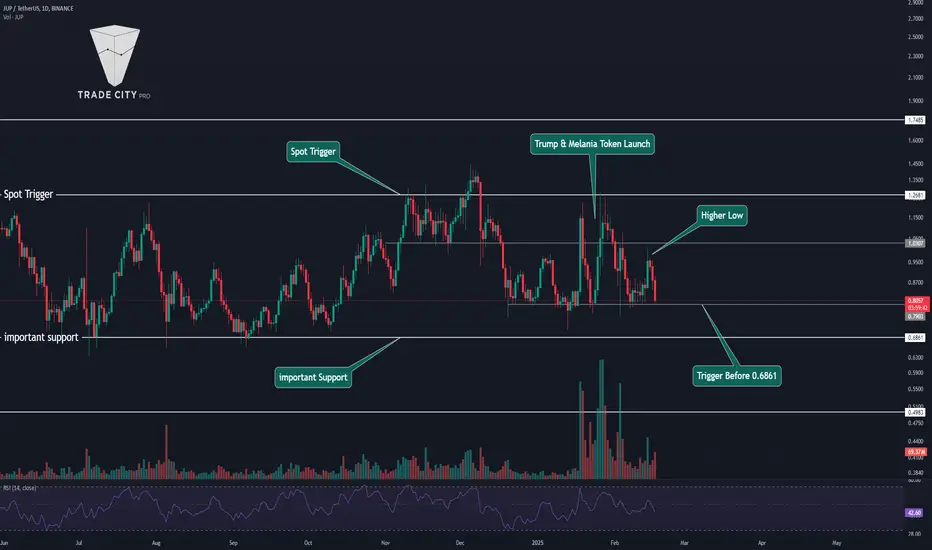
TradeCityPro | Bitcoin Daily Analysis #8👋 Welcome to TradeCityPro!
Let's delve into the Bitcoin analysis. Today is Monday, the start of the week, so let's check out the weekly and daily timeframes for Bitcoin to see what happened last week and how the weekly candle closed.
📅 Weekly Timeframe
The scenario I mentioned before still stands in the weekly timeframe. If the price stabilizes below 93,419, we can expect further corrections. The initial correction targets remain at 82,000 and then 71,000, which are still relevant.
🔍 On the other hand, if the ATH area, which is a resistance at 105,000 in the weekly timeframe, is broken, the price could start its next bullish leg. If this resistance breaks, I will update the analysis as usual and include Bitcoin’s next ATH targets.
📊 The market volume is still decreasing. The candles are also becoming smaller and smaller. As you can see, last week's candle hardly showed any fluctuation, indicating very minimal price range.
✨ That covers everything for the Bitcoin analysis in the weekly timeframe. Since the RSI hasn't activated any triggers yet, it's better to move on to the daily timeframe to see what has happened there over the past seven days.
📅 Daily Timeframe
The main supports and resistances in the daily timeframe are at 92,470 and 106,212, unchanged from last week.
🧩 However, the change is in the support at 96,312, which I mentioned last week could be a good area for the price to form a higher low and move towards the ceiling. This support has slightly shifted and is now at 95,601, which is still a significant support for the price. If supported at this level, and if it forms a higher low relative to 92,470, the price could move towards the ceiling of 106,200. In this case, if it can form a higher ceiling, the likelihood of breaking 106,212 will increase.
🔼 The early trigger for opening a long position that we discussed last week worked out well, and in the daily timeframe, if the price can stabilize above 98,061, we can expect it to form a higher low and move towards the main resistance at 106,212.
💥 The market volume, as I mentioned in previous analyses, has decreased significantly and has reached its minimal possible state. When the market volume decreases, the chart can move more easily. So, again, as I mentioned in the previous analysis, be ready behind the chart in these few days because movements after such low-volume ranges can be very volatile and can help you open profitable positions.
⚡️ Now that we've reviewed the weekly and daily timeframes, let's move on to lower timeframes and identify suitable futures triggers.
⏳ 4-Hour Timeframe
We have an expanding triangle in the four-hour timeframe, and the price has been reacting well to it. Yesterday, it was rejected from the triangle's ceiling, which could have provided a good position. I will show you this position in the one-hour timeframe.
👀 The support at 95,108 remains very important, and I suggest that if the price reaches this area and you want to break it, have a short position ready. For long positions, I still believe that the triangle's trendline must be broken from above, and in that case, the triggers at 98,482 and 99,946 would be suitable.
🚀 The first target for these positions, as a scalp, is 101,819, and their main target is 105,928. The short position target could be the bottom of the triangle or the area at 92,702.
🔑 The market volume has increased slightly in this timeframe. As you see, and as I mentioned yesterday, after the volume reaches its minimum, the price will definitely make a move in one direction, which I will specify in the one-hour timeframe how we could have taken our position.
⏳ 1-Hour Timeframe
Let's move to the one-hour timeframe. First, I want to review the position the market gave us yesterday, and then we'll see what today's trigger will be.
🔄 About an hour after I published the analysis yesterday, the support at 97,110 broke, and with this break, we could have opened a short position that could still remain open, and I suggest you make it risk-free because, as I said yesterday, this position is very risky and the maximum target we can consider for it is 95,308.
📈 However, I personally would save the profit and not allow it to remain open any longer because it was opened as a scalp. The trigger for the long position at 97,816 was not reached and was not activated.
🔽 But today, I don't have a special trigger for a short position, and 95,108 is the only trigger that we were waiting for last week to be broken, but this did not happen. Here in the market volume, we can see in more detail that after breaking the 97,110 area, it increased significantly, and currently, with the price starting to range again, the market volume has decreased again.
✅ For long positions, first wait for the price to return above 97,110 and see which area it reacts to, and we can specify our next trigger tomorrow. But if the price comes up unidirectionally, you can open a short position with the breaking of 97,816 or 98,482.
🧲 Be careful because the price moved a bit yesterday, it might range today. So make sure you only open positions with triggers you are sure about, not risky triggers.
📅 BTC.D Analysis
Let's move on to Bitcoin dominance. We specified a very good resistance for Bitcoin dominance yesterday at 60.95, and as you see, Bitcoin dominance reacted very well to it, hitting this area several times with a shadow point and then dropping again, and it is now back to its support at 60.48, which is very important. If 60.48 breaks, the dominance could drop to 59.84, as mentioned in previous analyses, and in this case, if short positions are activated, their triggers within Bitcoin could allow us to open a very good short position on Bitcoin.
💣 But if at the same time as the activation of these triggers, the dominance increases and the resistance of 60.95 breaks, short positions on altcoins would be better than on Bitcoin.
📅 Total2 Analysis
Let's move on to the Total2 analysis to see what suitable triggers will be for opening positions on altcoins.
🛎 The Total2 trigger was activated yesterday as you see at 1.24, which I said you could open a position with it riskily. However, as you see, the price has engulfed all the downward movements and returned up. However, I had said that this position was to be opened riskily and as a scalp, and if you opened a position with the trigger, quickly close your position.
📚 However, as you saw, Bitcoin still has a better bearish structure compared to Total2, and the reason is that Bitcoin dominance was bearish simultaneously with breaking the bearish areas, and if you had opened a position on Bitcoin, you would have made more profit, and now the position would still be open, but Total2 has returned all its upward movement and seems to want to form an upward structure. For now, I won’t change the 1.24 area and want to see what structure the price creates today and which ceiling it reacts to, and tomorrow I will change the location of this area for you.
📉 For short positions, you can open a position with the breaking of 1.23, but be aware, as you saw yesterday, altcoins did not drop much compared to Bitcoin, so if Bitcoin dominance is rising, you can open positions on altcoins. Otherwise, if the dominance is bearish, the short position you open on Bitcoin will give more profit.
📅 USDT.D Analysis
Yesterday’s trigger for Tether dominance at 4.48 was activated, and Tether dominance had an upward move or leg, which was not very strong in terms of upward momentum and does not seem to be continuing.
💫 We can draw a trend line in this chart that the price has currently hit and seems to have been rejected. In this case, if the 4.48 area, which is now acting as support, is broken again, the price could drop to 4.24. Otherwise, if the price can break the downward trendline, we can expect Tether dominance to move up to 4.62.
❌ Disclaimer ❌
Trading futures is highly risky and dangerous. If you're not an expert, these triggers may not be suitable for you. You should first learn risk and capital management. You can also use the educational content from this channel.
Finally, these triggers reflect my personal opinions on price action, and the market may move completely against this analysis. So, do your own research before opening any position.