TCS Chart Analysis: Key Trends and Predictions for August 2025**TCS Historical Pullbacks Analysis and Outlook**
Tata Consultancy Services (TCS) has exhibited a remarkable long-term uptrend, punctuated by a series of significant corrections. Your chart annotation highlights a compelling technical pattern: TCS has experienced three major pullbacks of approximately **27%** each over the past decade. These deep corrections have historically been followed by periods of robust recovery and new highs.
Interestingly, your chart also marks two exceptional occasions where the stock witnessed even deeper corrections, around **34%**, the most recent of which may still be in progress. The ability of TCS to consistently bounce back after such steep declines testifies to its underlying strength, market leadership, and the confidence of long-term investors.
**Key Insights From the Chart:**
- **Three 27% Pullbacks:** Marked by distinct blue boxes, each of these corrections provided attractive accumulation opportunities, and each was followed by renewed bullish momentum.
- **Rare 34% Corrections:** These are far less frequent, indicating abnormal market stress or broader corrections, but also highlight zones of potential capitulation and renewed accumulation.
- **Current Status:** The latest price action suggests another 34% pullback may be underway or nearing completion, as marked in orange annotation.
**Strategic Takeaway:**
Given TCS’s proven track record of recovery after such corrections, investors may view these deep pullbacks as strategic buying opportunities for the long term. Patience and discipline are critical, as the stock often rewards those who accumulate during periods of pessimism.
**Conclusion:**
TCS remains a robust large-cap IT pick. Historical patterns suggest that major corrections—while unnerving—tend to precede strong rallies. Investors should watch for signs of stabilization and reversal to position themselves for the next phase of growth, always aligning choices with personal risk tolerance.
Tcs-chart

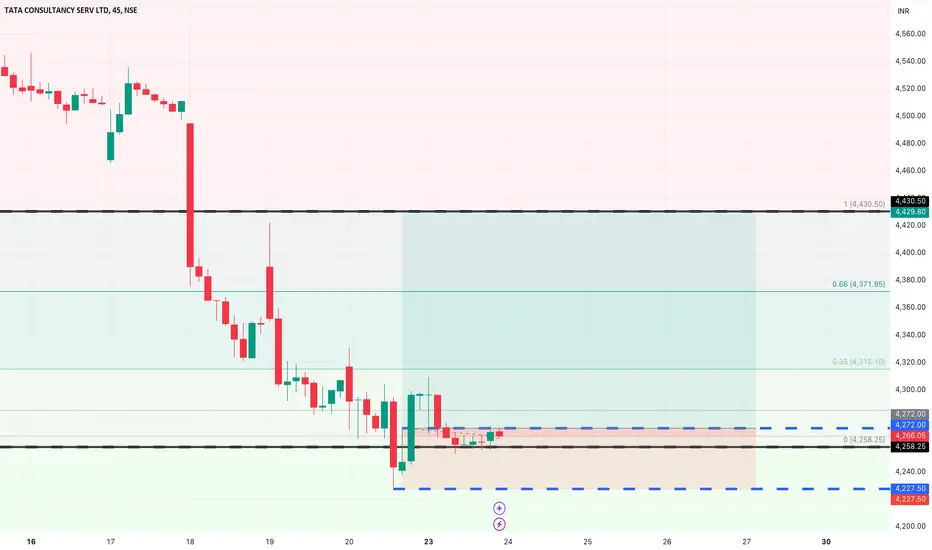
TCS POSITIONAL LONG TRADE
Here is the valid Source and its Destination which has violated its opposite Supply;
This is the Demand & Supply Equilibrium Curve according to the Fresh Demand and Supply available.
We have further sub-divided the Curve into 5 areas; considering we as traders are supposed to buy low and sell high where is high and how low can it get; these areas give us an understanding about the Price position as per the Curve.
Price has come into the Demand making Lower Lows and then after reacting to the Weekly Demand Price has violated a previous High; which shows a possibility of Buyers upping their game vs the available sellers.
Finally we have a Demand formed in 45 mins which is the first Demand formed after Price has reacted to the Weekly Demand and we have a Buying momentum confirmation hence this is a Buy Trade favourable reward to risk ratio
TCS--@Breakout or Breakdown ??I am sharing the important levels of Support and Resistance. These levels plays a crucial role in trading decisions, as they act as reliable markers of price movements.
------>>Support levels are price points where an asset tends to find buying interest, preventing it from falling further.
---->Resistance levels, on the other hand, are points where selling pressure typically prevents the asset from rising higher.
Take a look at these levels and trade accordingly. Recognizing and respecting these support and resistance levels can help traders make informed decisions and manage risk effectively. They serve as key reference points for technical analysis and are vital tools in successful trading strategies.
Trade safe...Thank you guys for your support
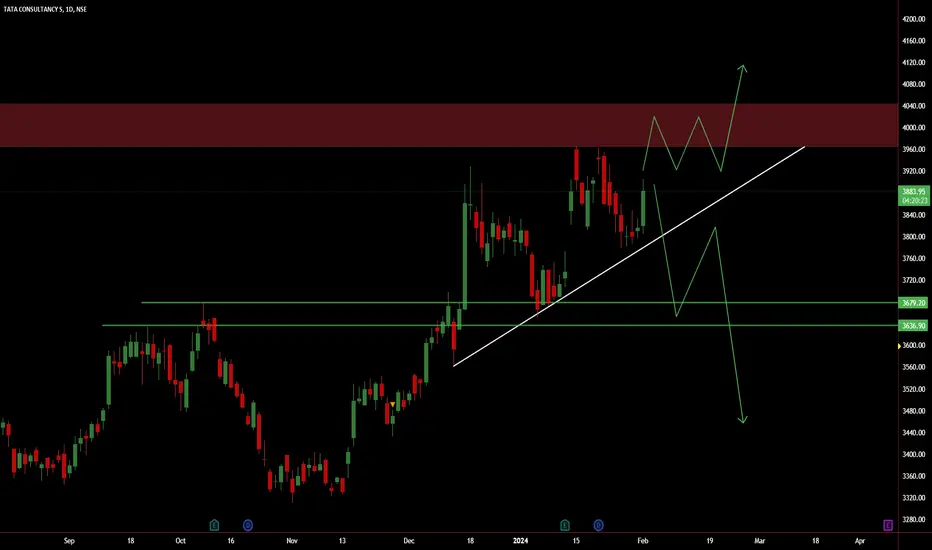
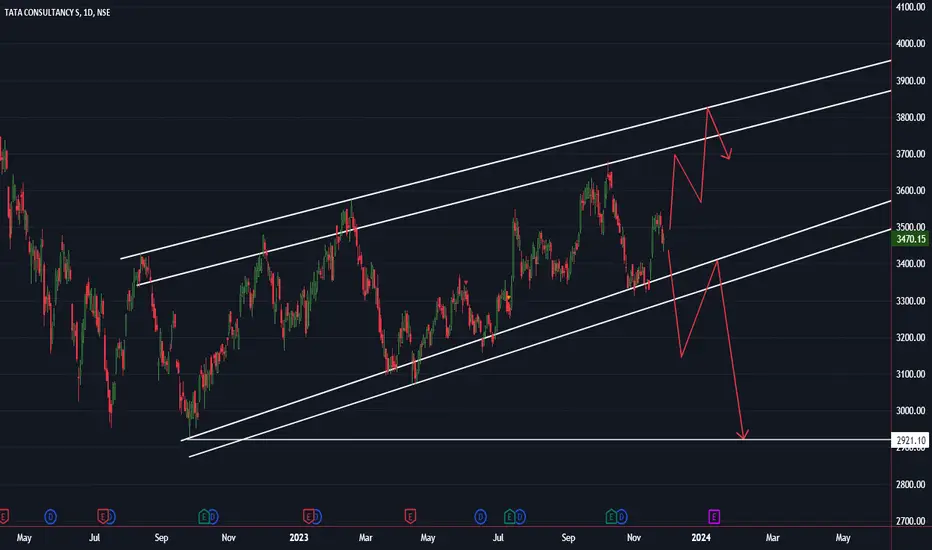
TCS --Trading in a channelThis stock is trading in a bullish channel...
wait until price breaks this channel and gives us retest to sell...If price comes back again to top side will look for sell...keep looking for short..
TCS--@Resistance Zone?? This stock has encountered persistent resistance within the 3460 range on multiple occasions. On the flip side, the price has consistently found support along a trendline, leading to upward movements.
It's advisable to maintain a bullish perspective as long as the price remains above this trendline. However, exercise caution, as there's a possibility of a false breakdown below the trendline, which could mislead traders and necessitate a prudent approach before considering short positions.

TCS--Will break 3400 ??observations::
facing resistance multiple times from this zone...3400 range...
if this range is broken will see a strong momentum towards upside is possible...
we have a trendline support as well...now price is at important level...
if price takes the help of trendline will be on buyside...keep track this levels...
3200 and 3400.

TCS Low Risk High Reward IdeaAs per my analysis NSE:TCS is now ready to move upside for big levels. My buy level is 3189-3195 with stop loss of 3155 (-44 Points Risk). My expected upside target would be 3234 (+45), 3275 (+85) & 3435 (+246). This could be very low risk and high reward opportunity.
Note: This is my personal analysis, only to learn stock market behavior. Thanks.

TCS BREAKOUTIF ITS CROSS THE UPPER TRADELINE WE SHOULD GO BULLISH trade and next is low tradeline break than we are going to down side trade.
have a great day to all thank you

TCS 1DTCS currently at the bottom of a crucial zone. It can give a good move either side.
If it breaks down expected target can be around 3100.
If reverses from this zone one can expect a target of 4050+
Trade safe. Manage risk. Be profitable.
Please follow us for more simple trading analysis and setups. Also let me know in the comment in case you have any queries.
Disclaimer :- This is just my view. Please analyze charts yourself and then decide to take any trades.

Falling ChannelStock Analysis: TCS has formed falling channel it is good buy now with below demand level as stop loss for the target given on the chart.
lets' see
Happy Investing!

TCS Daily TimeframeSNIPER STRATEGY
This magical strategy works like a clock on almost any charts
Although I have to say it can’t predict pullbacks, so I do not suggest this strategy for leverage trading.
It will not give you the whole wave like any other strategy out there but it will give you huge part of the wave.
The best timeframe for this strategy is Daily, Weekly and Monthly however it can work any timeframe above three minutes.
Start believing in this strategy because it will reward believers with huge profit.
There is a lot more about this strategy.
It can predict and also it can give you almost exact buy or sell time on the spot.
I am developing it even more so stay tuned and start to follow me for more signals and forecasts.
TCS Levels For 14 May 2021BUY TCS RANGE 3050-3080 TGT1 3120 TGT2 3155 SL 3024
SELL TCS BELOW 3024 TGT1 2980 TGT2 2950 SL 3051

R-0141 BUY TCS 2292-2300 SL 2244 TGT 2384Ichimoku cloud break out + MACD cross over + TK cross over + Above VWAP so we expect rally to continues 2350-2400
