"TCS Takes a COVID-Style Dive Again – Is It Time to Buy?"Price Action History:
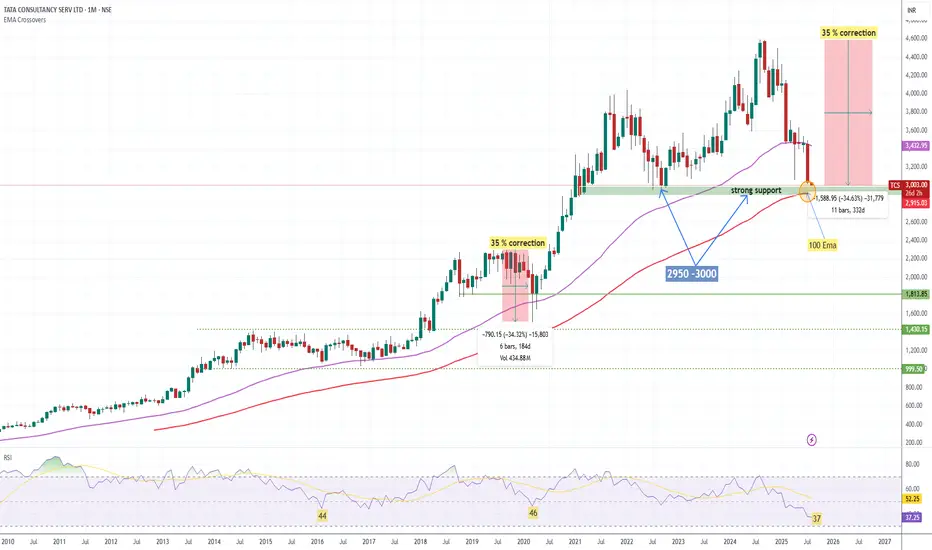
During the COVID crash, TCS fell nearly 35% from its top, eventually taking support at the 100 EMA on the monthly chart and staging a strong bounce.
In 2022 (June,july,Sep,Oct), around 3000 zone was tested multiple times, followed by a significant rally.
📊 Current Scenario:
Once again, TCS is trading near the ₹2950–₹3000 zone, which coincides with the 100-month EMA – a historically proven support level.
Price action suggests we are at a critical inflection point similar to past major bottoms.
✅ Key Technical Levels:
Support Zone: ₹2950–₹3000 (100 EMA Monthly+ 2022 support level)
Immediate Resistance: ₹3300–₹3400
Upside Potential: A bounce similar to COVID & 2022 patterns could trigger a strong upside move.
Trading Strategy:
if you are short term trader Keep a strict stop-loss below ₹2900 (monthly close basis) or 100 monthly EMA
Position sizing is key – don’t over-leverage.
🔎 Conclusion:
For long term trader This zone has historically acted as a strong accumulation area for long-term investors. If history repeats, this could be a high probability buying opportunity for swing and positional traders.
Fundamental Factor
Net Profit (Q1 FY26) ₹12,760 cr (+6% YoY)
Revenue Growth +1.3% YoY (−3.1% in CC)
Operating Margin 24.5% (↑30 bps QoQ)
Trailing P/E 22× (vs 5‑yr average ~24‑26×)
Dividend Yield 2.0%
ROE /ROCE 52%/64%