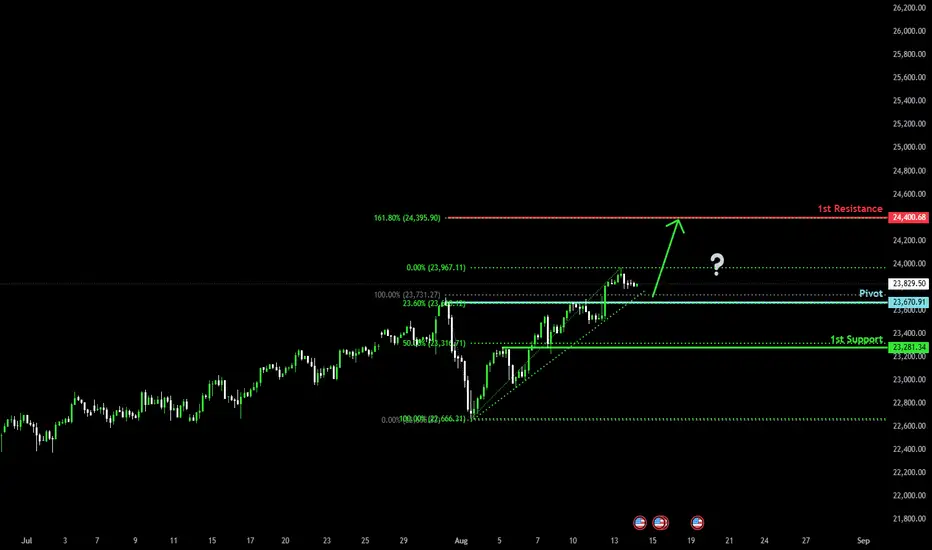
Bullish continuation?USTEC is falling towards the pivot which has been identified as a pullback support and could bounce to the 1st resistance.
Pivot: 23,670.91
1st Support: 23,281.34
1st Resistance: 24,400.68
Risk Warning:
Trading Forex and CFDs carries a high level of risk to your capital and you should only trade with money you can afford to lose. Trading Forex and CFDs may not be suitable for all investors, so please ensure that you fully understand the risks involved and seek independent advice if necessary.
Disclaimer:
The above opinions given constitute general market commentary, and do not constitute the opinion or advice of IC Markets or any form of personal or investment advice.
Any opinions, news, research, analyses, prices, other information, or links to third-party sites contained on this website are provided on an "as-is" basis, are intended only to be informative, is not an advice nor a recommendation, nor research, or a record of our trading prices, or an offer of, or solicitation for a transaction in any financial instrument and thus should not be treated as such. The information provided does not involve any specific investment objectives, financial situation and needs of any specific person who may receive it. Please be aware, that past performance is not a reliable indicator of future performance and/or results. Past Performance or Forward-looking scenarios based upon the reasonable beliefs of the third-party provider are not a guarantee of future performance. Actual results may differ materially from those anticipated in forward-looking or past performance statements. IC Markets makes no representation or warranty and assumes no liability as to the accuracy or completeness of the information provided, nor any loss arising from any investment based on a recommendation, forecast or any information supplied by any third-party.
Tec
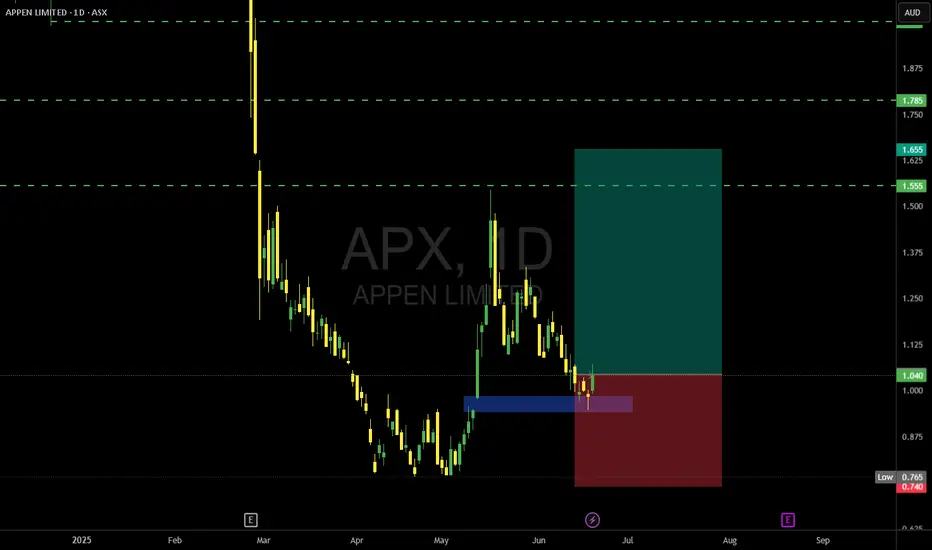
APX Rebound in Play?📈 “APX Rebound in Play? Eyeing the AUD 1.55 Resistance”
Appen (APX) has shown a significant uptick today, closing at AUD 1.040 (+5.58%) with a sharp volume spike (8.96M shares) that could suggest accumulation. After a long downtrend, price appears to be consolidating above key support near AUD 1.00, forming a potential base for reversal.
🔍 Chart Highlights:
Support Zone: AUD 1.000 – strong historical level holding.
Resistance Targets: → AUD 1.555 → AUD 1.655 → AUD 1.785
R/R Setup: Defined green zone shows potential upside if momentum continues; red zone clearly marks invalidation below support.
🧠 Thesis: If APX maintains momentum and holds above AUD 1.00, we may be witnessing a structural shift with upside potential toward AUD 1.78 in stages. Breakout traders might watch for confirmation via volume and price action at each resistance.
💬 “Could we be looking at an early-stage reversal or just a dead-cat bounce? Watching the 1.00 level closely.”
#ASX #APX #APPEN #MJTRADING #TRADING #SHARE #STOCKMARKET #BUY #CHART #MONEYMANAGEMENT
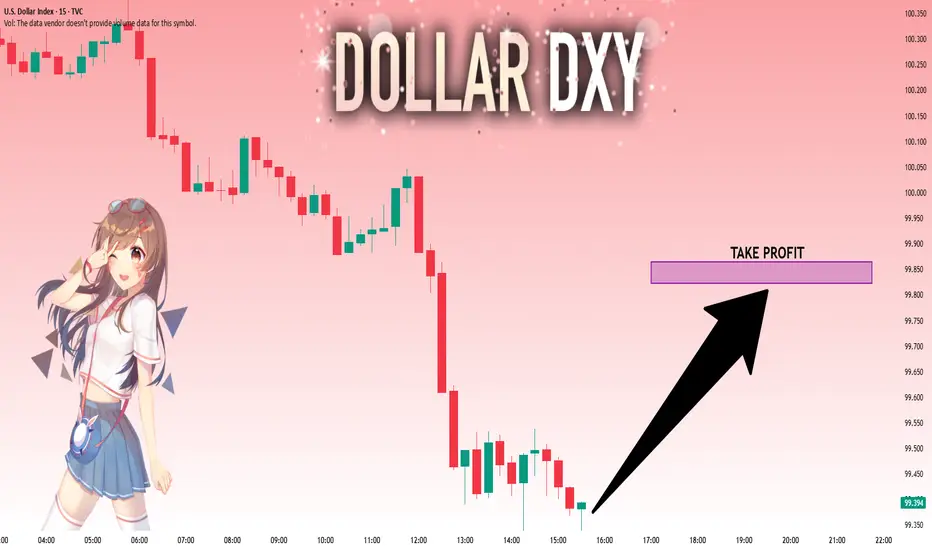
DXY: Bulls Are Winning! Long!
My dear friends,
Today we will analyse DXY together☺️
The recent price action suggests a shift in mid-term momentum. A break above the current local range around 99.377 will confirm the new direction upwards with the target being the next key level of 99.823 and a reconvened placement of a stop-loss beyond the range.
❤️Sending you lots of Love and Hugs❤️
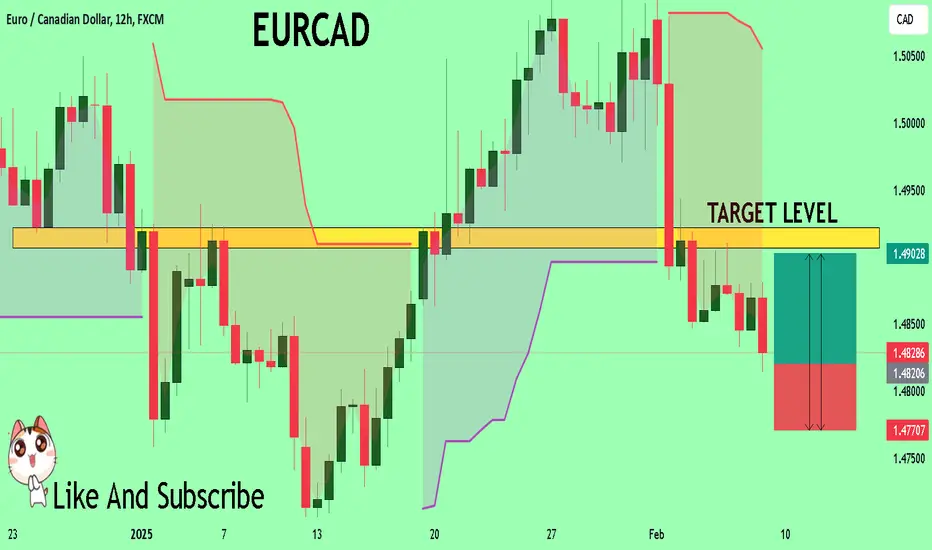
EURCAD Expected Growth! BUY!
My dear friends,
EURCAD looks like it will make a good move, and here are the details:
The market is trading on 1.4823 pivot level.
Bias - Bullish
Technical Indicators: Supper Trend generates a clear long signal while Pivot Point HL is currently determining the overall Bullish trend of the market.
Goal - 1.4906
Recommended Stop Loss - 1.4770
About Used Indicators:
Pivot points are a great way to identify areas of support and resistance, but they work best when combined with other kinds of technical analysis
———————————
WISH YOU ALL LUCK
EURAUD A Fall Expected! SELL!
My dear subscribers,
This is my opinion on the EURAUD next move:
The instrument tests an important psychological level 1.6525
Bias - Bearish
Technical Indicators: Supper Trend gives a precise Bearish signal, while Pivot Point HL predicts price changes and potential reversals in the market.
Target - 1.6383
My Stop Loss - 1.6605
About Used Indicators:
On the subsequent day, trading above the pivot point is thought to indicate ongoing bullish sentiment, while trading below the pivot point indicates bearish sentiment.
———————————
WISH YOU ALL LUCK

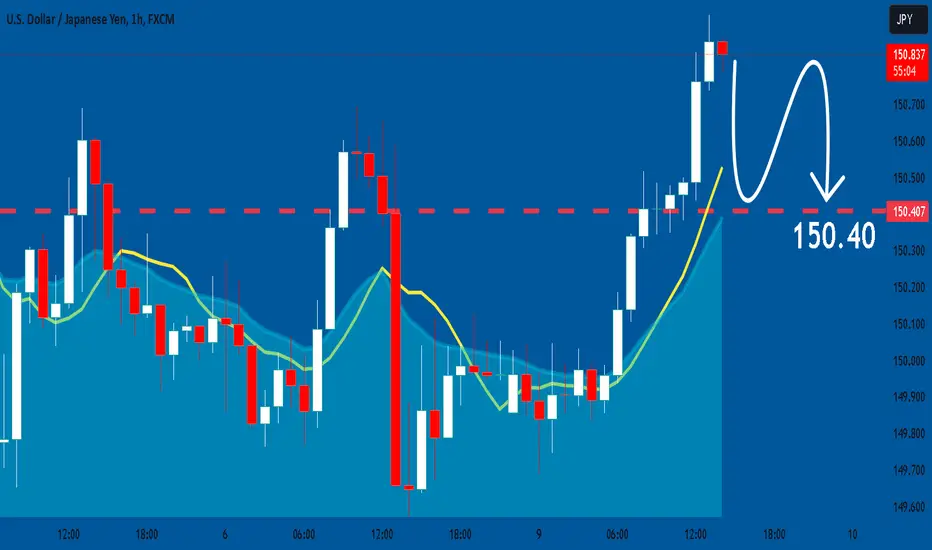
USDJPY: Weak Market & Bearish Continuation
Remember that we can not, and should not impose our will on the market but rather listen to its whims and make profit by following it. And thus shall be done today on the USDJPY pair which is likely to be pushed down by the bears so we will sell!
❤️ Please, support our work with like & comment! ❤️
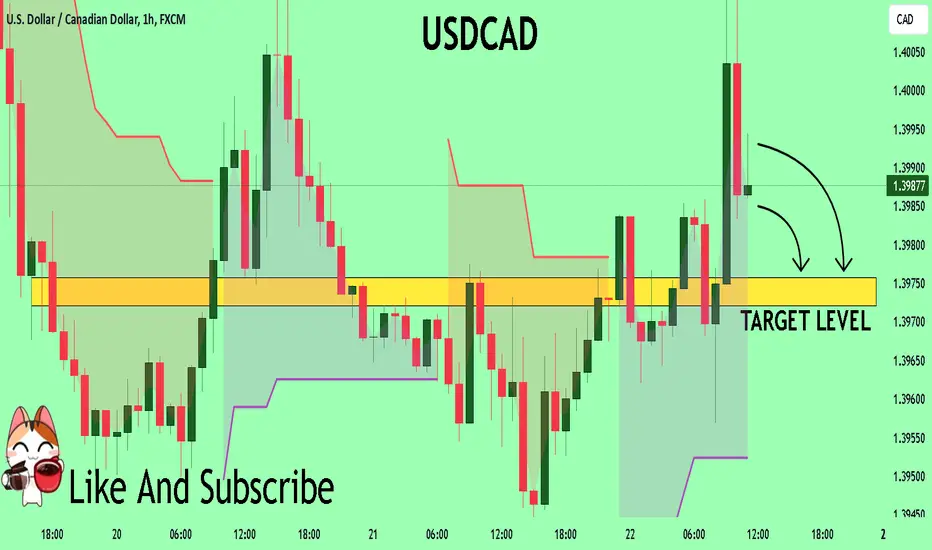
USDCAD Under Pressure! SELL!
My dear subscribers,
This is my opinion on the USDCAD next move:
The instrument tests an important psychological level 1.3989
Bias - Bearish
Technical Indicators: Supper Trend gives a precise Bearish signal, while Pivot Point HL predicts price changes and potential reversals in the market.
Target - 1.3975
About Used Indicators:
On the subsequent day, trading above the pivot point is thought to indicate ongoing bullish sentiment, while trading below the pivot point indicates bearish sentiment.
———————————
WISH YOU ALL LUCK
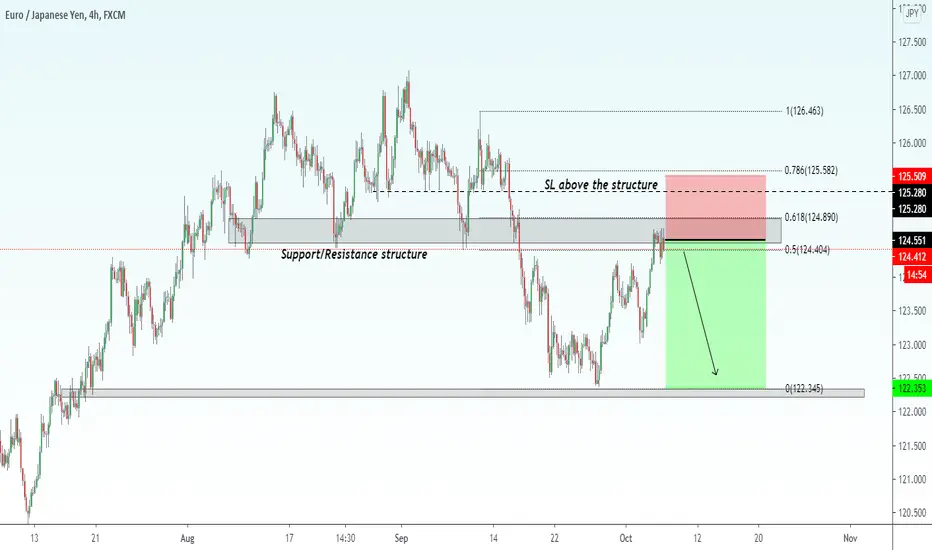
EURJPY, price will go lower..Please Support this Idea with LIKE if it is Useful....
EURJPY
The price is close to support/resistance structure, if price rejects from the level I expect the price to continue lower...
For Entry:
Wait for the formation of Bearish Candlestick Pattern to close on 4hr timeframe for confirmation to SELL..
Trade it with proper Sl..
In case, if price breaks above the support/resistance then we have to wait for a clear direction..
Push LIKE & SUPPORT the Idea...
*The content on this analysis is subject to change at any time without notice, and is provided for the sole purpose of assisting traders to make independent investment decisions.
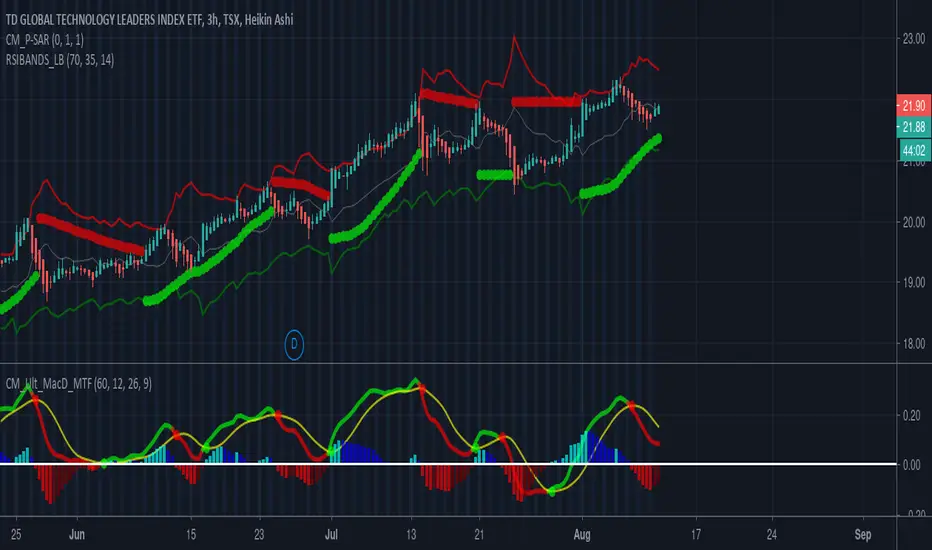
Strong RSI-based buy/sell strategyUsing MACD and RSI, await a crossover and proper signal crossover for a buy/sell signal
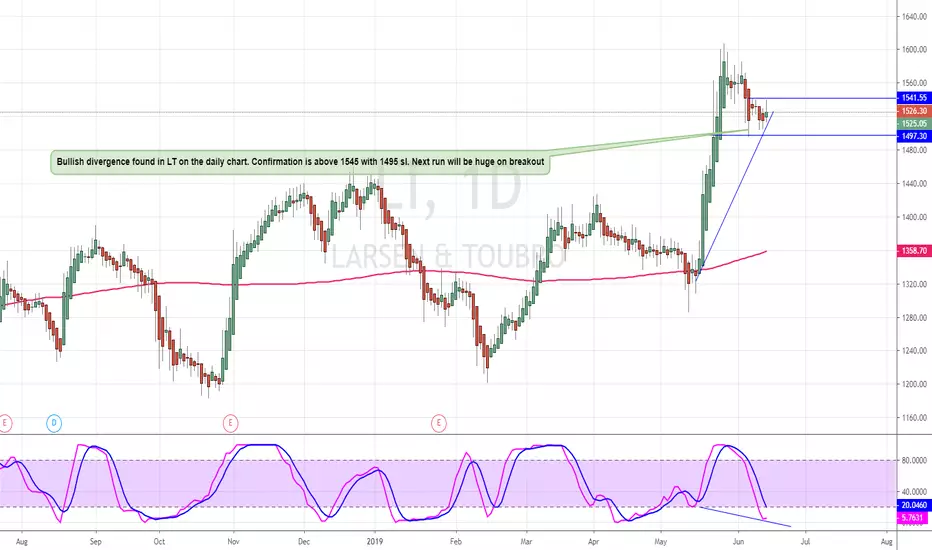
LT - Rady for next bull runBullish divergence found in LT on the daily chart. Confirmation is above 1545 with 1495 sl. Next run will be huge on breakout