Should you be selling your #Bitcoin for #TSLA right now?These types of rotations and range trades offer investors fantastic opportunities
if these relationships continue.
We have seen this for Bitcoin and it's ratio's to stocks/metals & altcoins is not a one way trade as it ONCE used to be.
2009 - 2017 was the golden #crypto era when gains were the easiest to acquire.
However the low hanging fruit has been totally plucked, as #BTC's returns have crawled to not much more (or sometimes less) than the leading stocks of the day.
I still maintain a $140-145k price target for this cycle for bitcoin
But I also have a very aggressive long term price objective for #TESLA of $1000
(which is around 3 trillion dollars market cap)
TECH

Is the market crashing? The SPY and IWM have completely diverged.
On the back of rate cut expectations, many investors are piling back into the junk and high beta names.
A clear relative strength move has occurred in small caps: IWM
Whilst the megacap stocks have been sold off.
The SPY sliced through the 50 MA yesterday and cofirmed the break below.
Although this is typically bearish, we are getting into an area of oversold support.
If the SPY gaps down tomorrow, I think traders will be buying the dip with both hands.
The IWM has blasted above the 50MA, basically moving the exact opposite of the S&P500.
The question remains....are small caps going to hold their gains inside of the weekly topping tail?

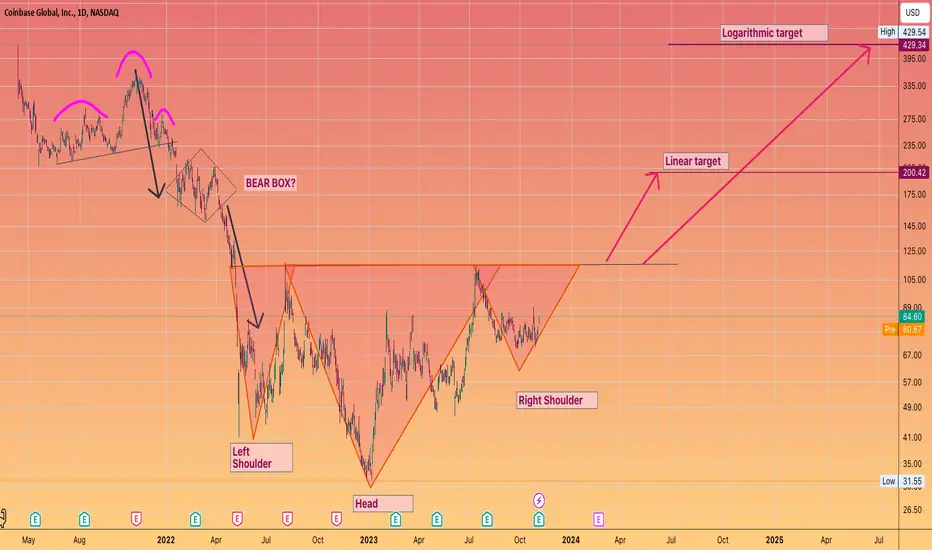
COINBASE - #COIN massive Inverse Head & ShouldersTwo targets
Linear and Log projections
Both are juicy obviously
Brian Armstrong timed their IPO perfectly and extracted billions of dollars kudos to them
Wouldn't it be something if Coinbase was to return back it's #IPO price this coming bull , seems like destiny
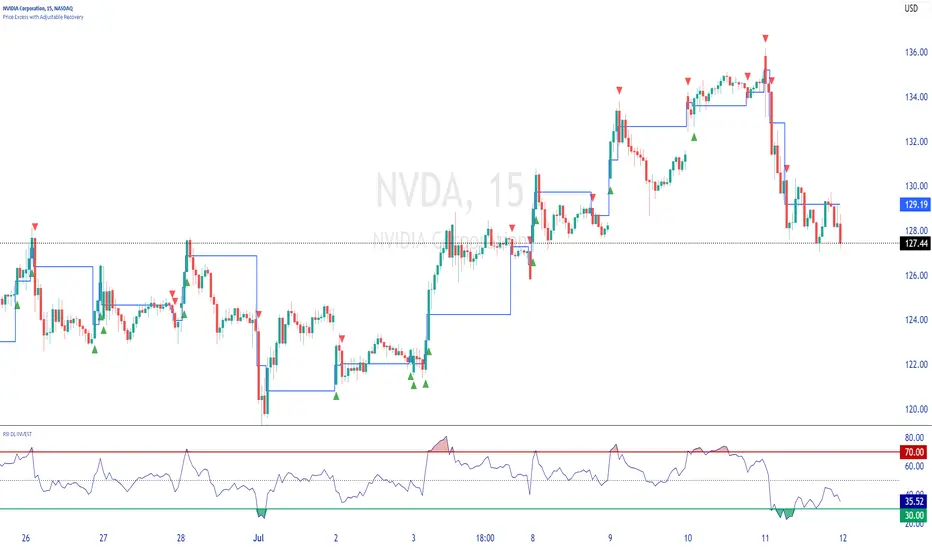
NVDA Looks Good For Higher PricesLooking good for higher now that we are trading above the POC. We need to flip the VWAP into support next to really aim for the VAH (White Line).
Calculate Your Risk/Reward so you don't lose more than 1% of your account per trade.
Every day the charts provide new information. You have to adjust or get REKT.
Love it or hate it, hit that thumbs up and share your thoughts below!
This is not financial advice. This is for educational purposes only.

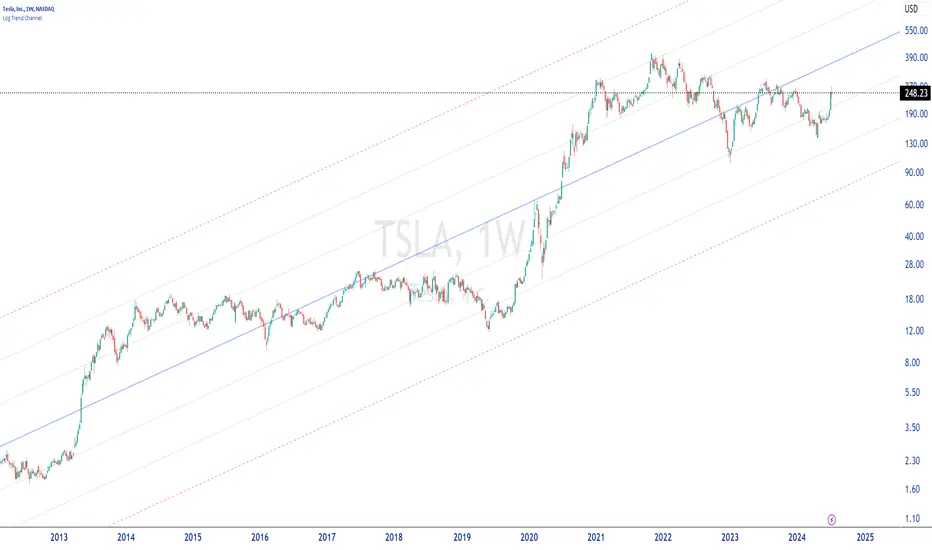
TESLAWeekly graph in log.
Linear regression line from the start of the quotation.
We are below one standard deviation from the median.
So for me possible purchasing area.
Make up your mind before placing an order.
► Please boost, comment, subscribe!
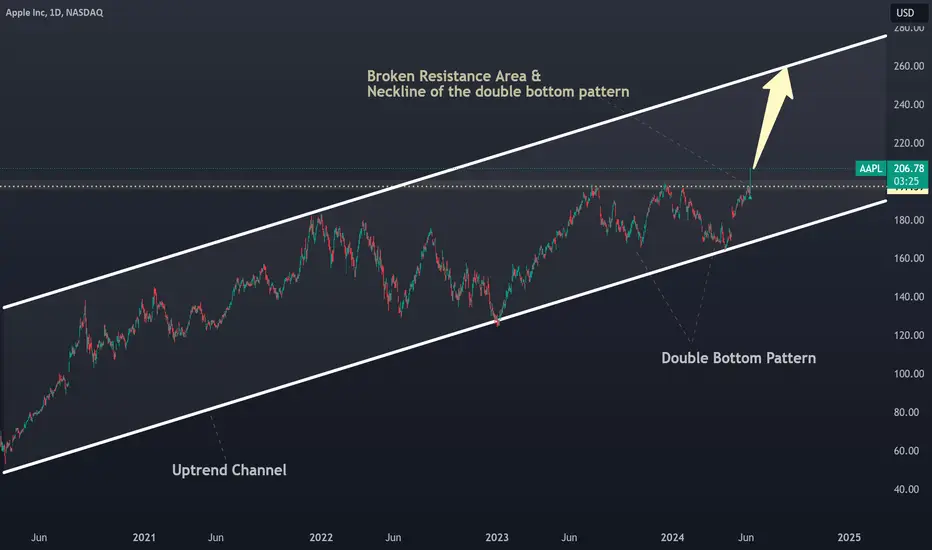
Apple is BullishApple is bullish and in an uptrend channel on the daily timeframe.
With today's close will confirm, a break out above the resistance area around 195-200 (to become the new support/demand zone) and a break out of the double-bottom pattern. Target is set to the upper levels of the channel at 250.
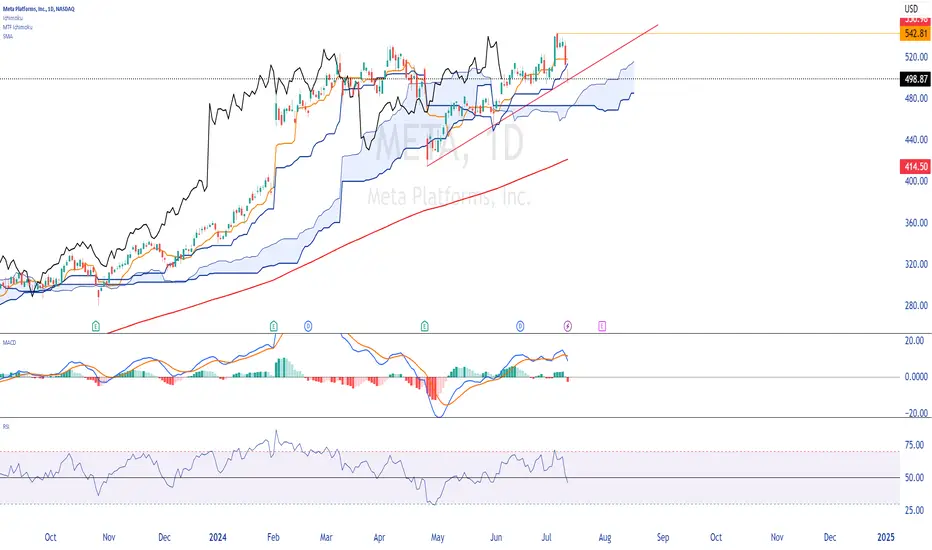
Meta PlatformsDaily chart with ichimoku.
Price under the tankan and under the kinjun.
We are above the cloud. Be careful, the cloud is thin and prices could pass through it easily.
The SMA 200 is under the cloud, so no worries.
MACD increasing, but above the 0 line.
The RSI is slightly below 50.
To conclude, the trend is bullish, we must monitor the break of my red line, which could announce a corrective movement.
Happy trading to you.
NVIDIA15 minute chart.
Price Excess with Adjustable Recovery indicator, ideal for trading price excesses.
Make up your mind before placing an order.
► Please boost, comment, subscribe!
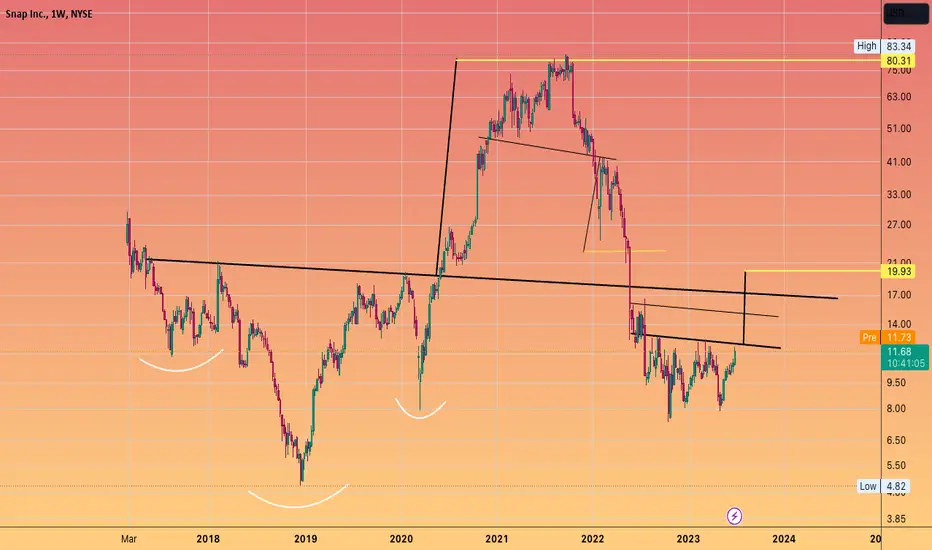
$SNAP Bear to Bull reversal in progressLate cycle
catch up momentum play?
seems likely
#APPL is closing in on $200
could that push the laggards higher?
Nasdaq Composite - Can U see this happening?I can.
See it.
And also Believe it.
These securities are measured in #Fiat
which only becomes worth ... less with each passing year.
Until #Vivek comes into office, of course and backs the dollar with a basket of commoditie!
(maybe that basket may include #BTC)
Inverse head and shoulders has massive linear and log targets
Will be fun to watch this play out.

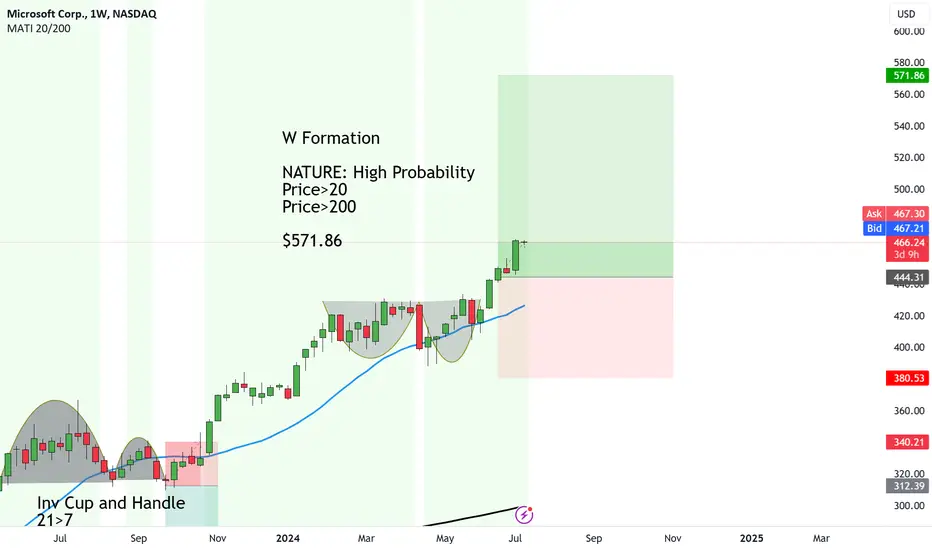
Microsoft following the tech footsteps or major upside to $571.8W Formation formed on Microsoft. The price broke up and out of the formation and now it's heading on up.
We see a similar trend with Apple and the Nasdaq so they are all following suites.
NATURE: High Probability
Price>20
Price>200
Target $571.86
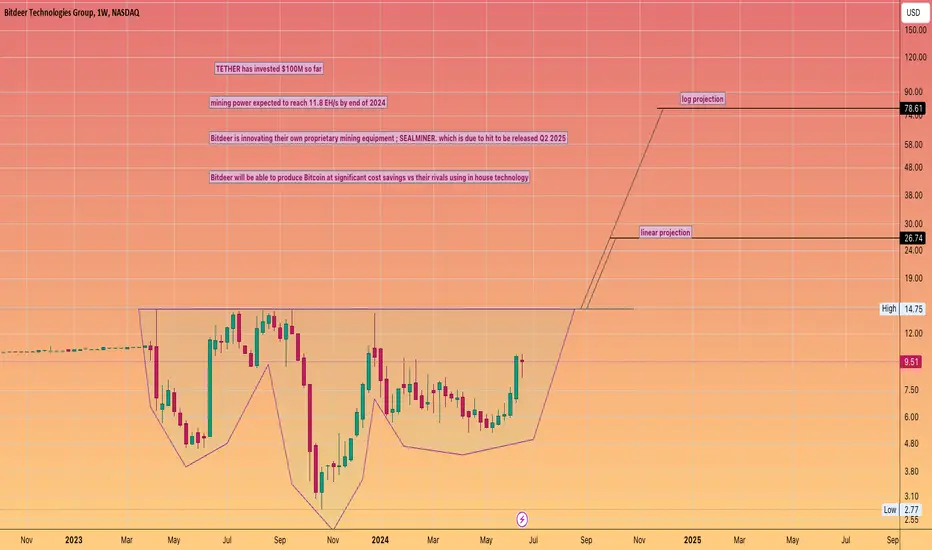
BITDEER deserves to be re-rated HIGHERBased on fundamentals and technicals of course!
This company I expect to comfortably trade as a double digit company by years end
And during the #Bitcoin bull top even has the potential to tag this log projection
we can see an Inverse head and shoulders clearly being formed.
Yet to trigger, but it has some impressive projections.
Will Bitdeer outperform it's more well known rival #Mining competitors?
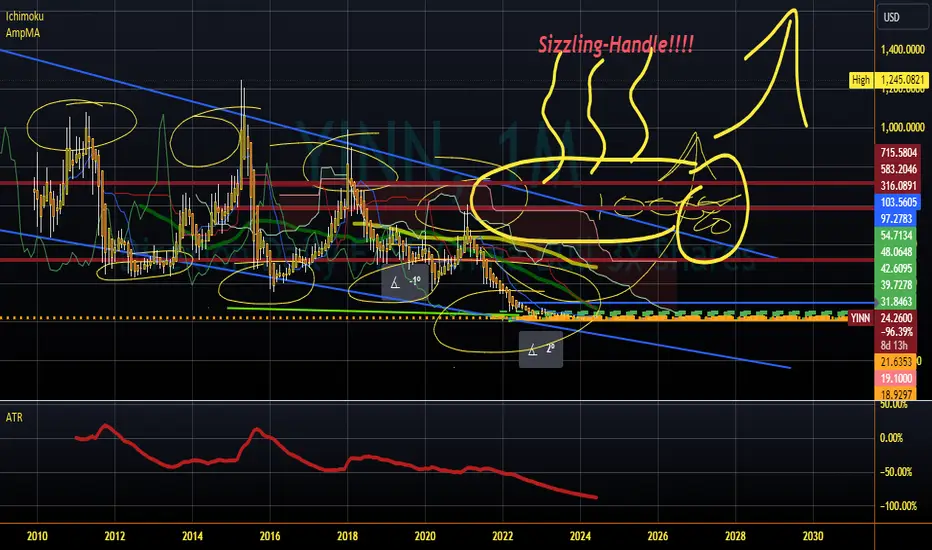
SIZZLING-YINN-HANDLE!!!! There's been a global paradigm shift As Biden's re-election prospects diminish and recent events are raising concerns. While US and Europe valuations are within fair value range based on forward P/E ratios the tremendous laggard China has turned its corner in cracking the chip after Pres Xi spent about $2T equivalent in US dollar that is a lot but at least he accomplished what he intended when he came in office and announced the "common prosperity initiative" to solve demographic generational chasm from the one child policy before and thee are not enough producers to support the rest and to solve this make home affordable again as children live with their parents until age 55 on average and this is not ideal for starting a family they need their own home. Well fold housing down 95% mission accomplished lol Tech Sector crackdown and sanctions on top of a strong US dollar also beat down China tech index clubbed like a baby seal down 75% . many have contemplated is China investable. We ladies and gentlemen. Bottom Line = YES! .........PLAY BALL!
Notice: Think for yourself before comparing your analysis. Past does not equal future, same goes with price discovery. Leverage ETF products have additional risks and design for short term trading and speculation and someone who has a system with automations and watching the Bloomberg. This is not intended to be a recommendation in absolute. If you do not fully understand please consult an advisor, make sure you have adequate cash reserve and can afford to lose as invest like this leverage 3x so that is a notional value of 300% of a potential 25%83=74% in one handle (move). Remember to cut your losses because it takes a 100% return to break even from a 50% loss. I would expect this trade to take 2 weeks to mature but could take a month and it may be down at first, but the paradigm has changed, and this is the trade for now.
Big Tech is nearly at All time High's. Just 3% away!It has doubled since the peak Recession fears of 2021
#BTC has also more than doubled
#SOL has 4 or 5 X'd
This chart is combined price chart of
#Googl
#Appl
#MSFT
#Amzn
#NVDA
#NFLX
#META
U can see the two head and shoulder tops in 2021
and also the inverse head and shoulders in 2022
The clean break and run.
And also the Bull Pennant which has already bullishly triggered 3 weeks ago.
From these levels if that Bull pennant target is to be met (log scale)
It seems this basket has another 30% move left in it.

#NASDAQ vs #DJIA has only been lower on the RSI 3 times! I wager #TECH is still the place to earn better gains going forward.
It also doesn't carry the risk of #Financials
and it is not dragged down by slow growth "stable" companies like utilities.
Bleeding edge has always been the place to grow your money
and with #AI manifesting itself for the next wave of user growth along with #CRYPTO
you need exsposure to network effects investments.

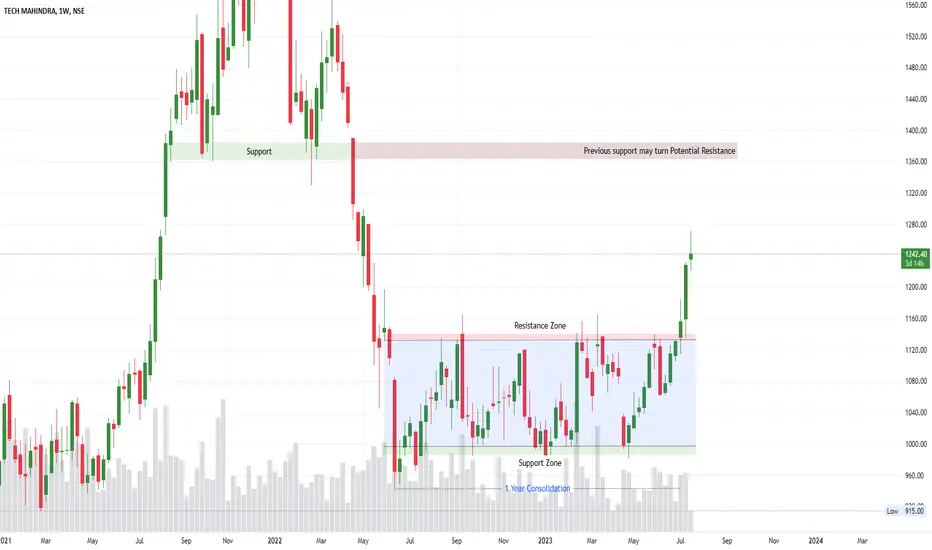
Tech M : Updated Price Action- We posted the initial analysis of Tech M on March 5th, 2023 which can be accessed below.
- Given that the price action changed with time, we decided to post the updated price action for the ease of our followers
- The chart is pretty self-explanatory
- The Price action is similar to that of NSE:WIPRO . The price consolidated for over a year and finally gave a good breakout.
- Follow the comments below for regular updates on future price action 👇
- The Indian IT sector too is approaching its critical resistance for the third time.
- Looks like we may see some good momentum in the IT Space. What do you think?
- We appreciate your support! If you liked our analysis, Do give us a 🚀
⚠️Disclaimer: We are not registered advisors. The views expressed here are merely personal opinions. Irrespective of the language used, Nothing mentioned here should be considered as advice or recommendation. Please consult with your financial advisors before making any investment decisions. Like everybody else, we too can be wrong at times ✌🏻
SNAP: $10 | Bleeding Stopped
2023 should be a come back
with revenue | profit improving though in the negative area
bleeding has subsided
one quarter was positive in 2022 yet
price barely went up or down
it just hovered along $10 +-15 levels
Tiktok is around $200bn as bytedance valuation
this at $15bn needs a campaign to revive it's HYPE back in the day

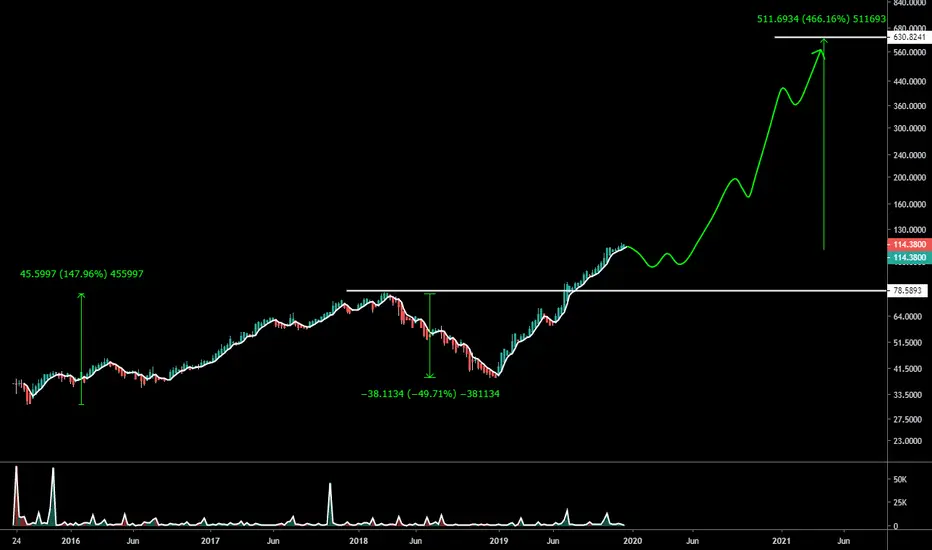
ASM: $114 | water processing Tech a goldmine towards $600positioned for the next generation technology requirements
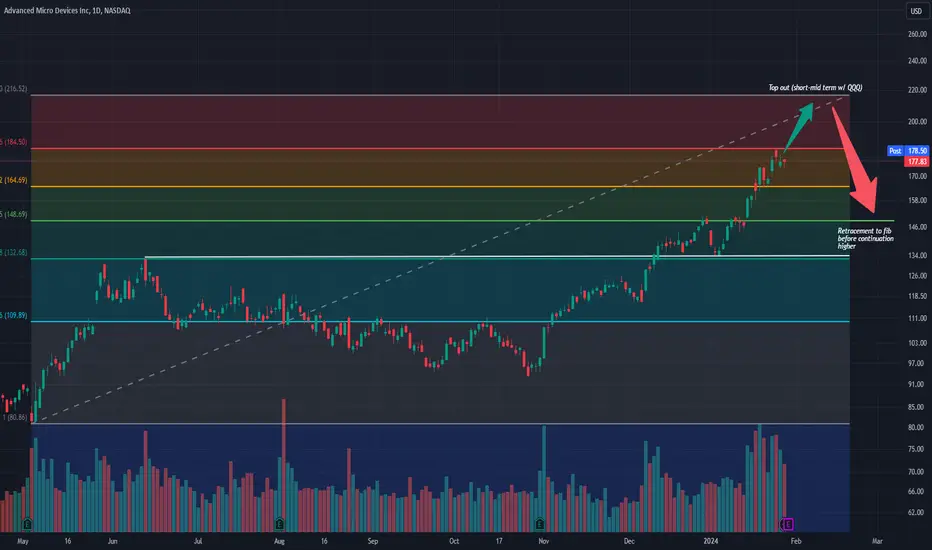
Earnings Strength before Slight PullbackHello everyone, happy Monday. Here I am presenting my idea of a strong bullish continuation by NASDAQ:AMD going into tomorrow's earnings. Despite the already strong momentum upwards, I believe we see further buying action after tomorrow's earnings into the lower $200s along with strong buying action across broader tech in $PYTH:QQQ. I believe both these securities will top out short-term in the upcoming 4-6 weeks before a brief pullback to the $149 price point before a further continuation upwards.
Position: Shares (added between 2018-2020); holding long-term.
Please let me know your thoughts and feedback and happy trading!
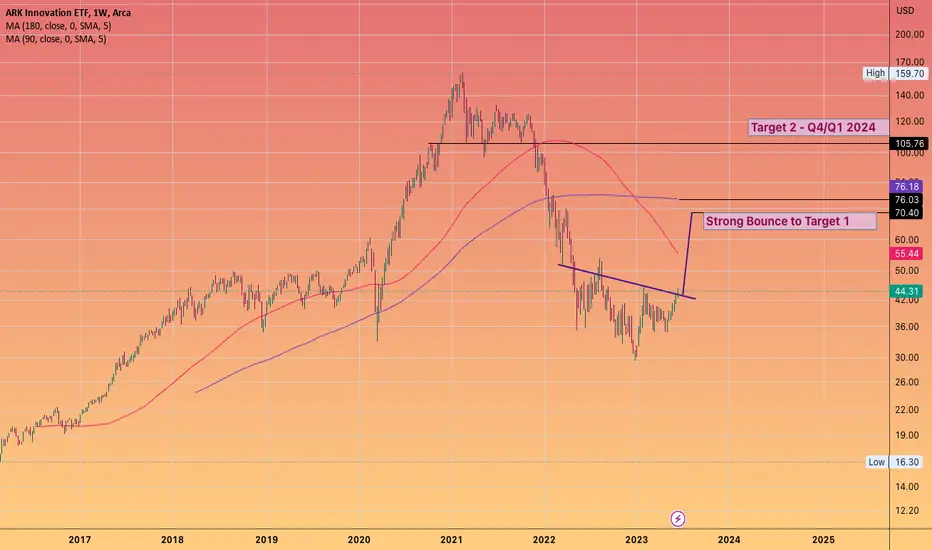
#ARKK to have a strong recovery Target 1 I expect to come quite quickly ... closely correlating to a strong bounce in #BITCOIN
My overall thesis for an Equity top in April 20024 is now firmly in place.
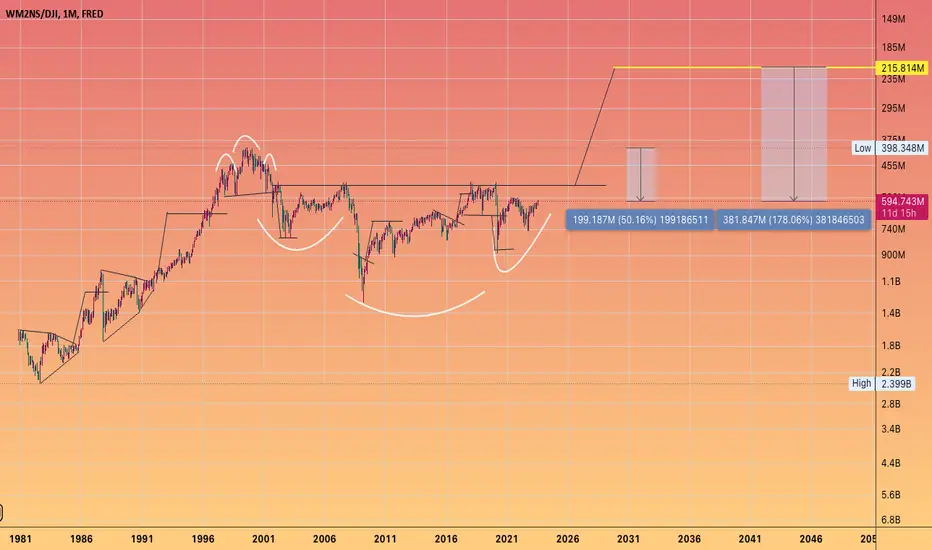
Are #Stocks expensive? No measured against M2 money supplyThe 2000 Top was still the "real" peak of the US stock market
Built obviously on the expectation that the internet would change the world and teh global economy.
This highlights how the market foresees the future and how market participants are forward looking.
The #DownJones index is still 50% down form that peak
on this chart you can multiple chart patterns tat have played out previously
HVF's, double top, head & shoulder tops, and inv H&S bottoms
currently in a 22 year continuation inv head and shoulders which is still in progress
my stance is Top in April/May 24 .... downdraft into the election and a run up for 2/3 years into the Giga Uber TOP
Tessy for the Win ($TSLA)Need above 176 to confirm move up. Looks to potentially be in a 5 wave move up.
If we reject 176 to 180 expect lower to come
if not this is upside just about
Looks to be in five wave like apple
Sub waves so within next few weeks to week
If not though probably lower than last low coming for sure. We need to break trend
Update as we go
tradingview.sweetlogin.com

Apple for Apples ($AAPL)Stalled at the 138.2 on the wave 3 of five. Aim for potential double top at 199 next after retrace tradingview.sweetlogin.com
