JOHN HOLT LONG IDEAJOHN HOLT stock retested a support level and trendline last week and closed above these key levels, showing the readiness of buyers to push price higher. This was confirmed with a strong volume momentum.
To take advantage of this long signal, you can buy at the current market price. The stop can be at N5.75 (-20.14%) while the targets are N10 (38.89%) and N10.95 (52.08%).
Confluences for the long idea:
1. Breakout and retest of a trendline
2. Uptrend
3. Strong volume momentum
4. Support level
Disclaimer: This is not a financial advice. The outcome maybe different from the projection. Don't take the signal if you're not willing to accept the risk.
Techbicalanalysis

TANTALIZER LONG IDEATANTALIZER stock is looking promising. There was a bullish divergence on the awesome oscillator (daily timeframe), which was followed by a bullish change of character. This is a confirmation that the stock is ready to go higher. Price has recently dropped to the demand zone confluenced with trendline and support level, which is a good point to take a long position. After mitigating the demand zone, there was a rejection showing that buyers are willing to push price higher.
To take advantage of this long opportunity, one can buy at the current market price. The first target is N2.99 (24.58%) and the final target is N3.45 (43.75%). The stop can be at 2.10 (-12.50%).
Confluences for the long idea:
1. Bullish market structure
2. Trendline
3. Awesome oscillator divergence
4. Rejection candle
5. Support level
Disclaimer: This is not a financial advice. The outcome maybe different from the projection. Don't take the signal if you're not willing to accept the risk.

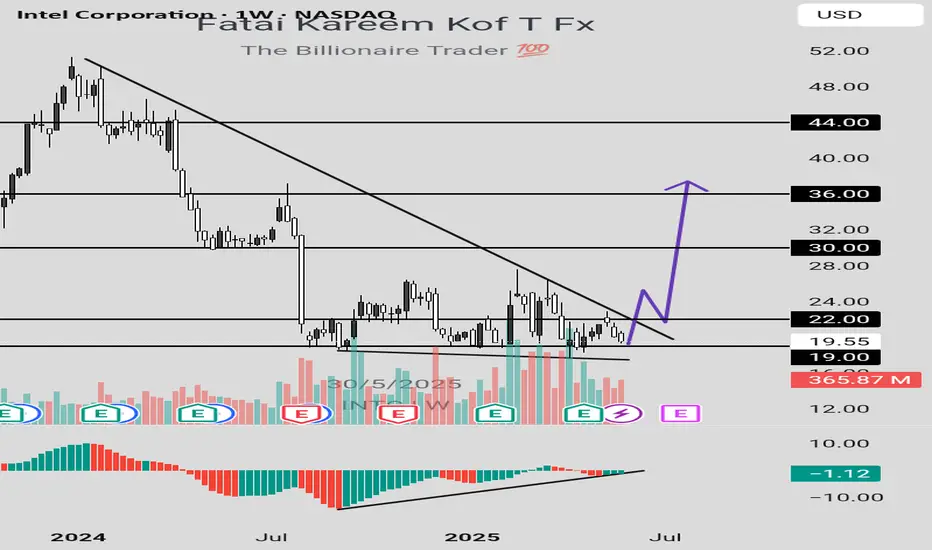
WHAT'S THE FATE OF INTEL CORPORATION STOCK?From the perspective of technical analysis, INTC is approaching a key psychological level at $19. In addition, it's in a downtrend. If the key level should hold by pushing price higher, leading to a break out of the downtrend line and closing with a strong bullish candle above the down trend line and resistance level around $22, this will indicate a strong bullish signal. Likewise, this is supported by a bullish divergence signal from the awesome oscillator. Otherwise, a failure of the psychological level of $19 may lead to price dropping further.
Furthermore, we need to look beyond technical analysis. Fundamental analysis also has some insights for our decisions.
Fundamentals for INTC established a bearish bias. The summary is as follows:
Financial Health:
• Negative EPS (-$4.47): Intel is losing money.
• High Debt ($50B): This can limit growth and increase risk.
• Declining Revenue: Sales dropped from $80B (2021) to $51B (2024).
Valuation:
• Cheap P/S (1.66x), but no P/E (due to negative earnings).
• Dividend yield (2.56%) is at risk of being cut.
Sentiment:
Stock price fell from $56 to $19.55 (65% drop). Institutional investors may be wary.
Fundamentally, INTC is weak — best suited for speculative, long-term bets (if you believe in a turnaround).
Strategy for Traders:
1. Conservative Approach:
- Wait for:
- Break out of downtrend line and resistance around $22 and positive earnings/news.
- Rising volume to confirm momentum.
- Target: $27–$30
- Stop-loss: Below $17 (apply proper risk management).
2. Aggressive Approach:
- Buy near $18–$19 with tight stop-loss ($16).
- Target resistance level at $22.
3. Avoid If:
- You’re risk-averse or prefer stable companies.
- Intel’s debt/revenue trends worsen.
Note:
- Short-Term Trade: Only if breakout confirms ($22+). High risk, but possible 20% bounce.
- Long-Term Investment: Avoid unless Intel shows profit/debt improvement.
Always use stop-losses —Intel’s fundamentals make it volatile.
Disclaimer: This is not a financial advice. The outcome maybe different from the projection. Don't take the signal if you can't accept the risk.
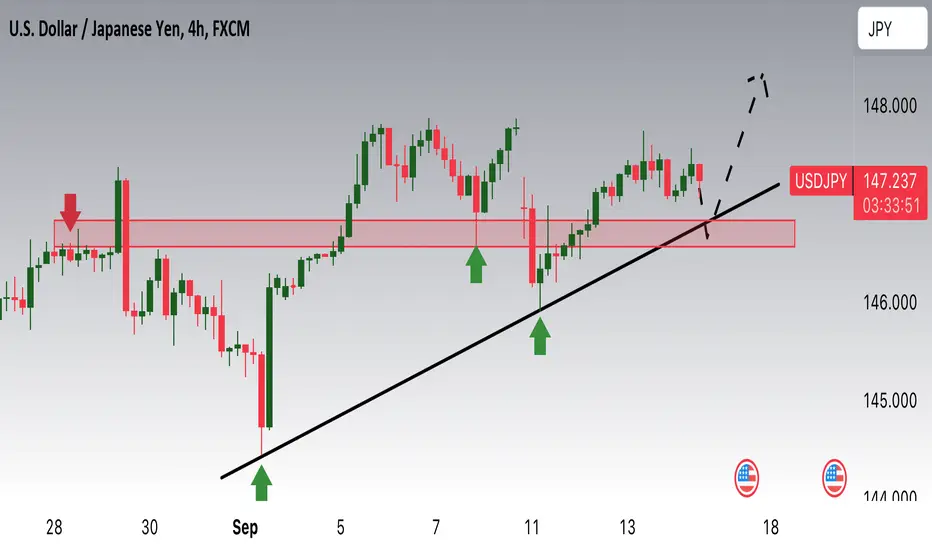
USDJPY Potential UpsidesHey Traders, in today’s trading session we are monitoring 146.800 zone, USDJPY is trading in an uptrend and currently is in a correction phase in which it is approaching the trend at 146.800 support and resistance zone.
Trade safe, Joe.