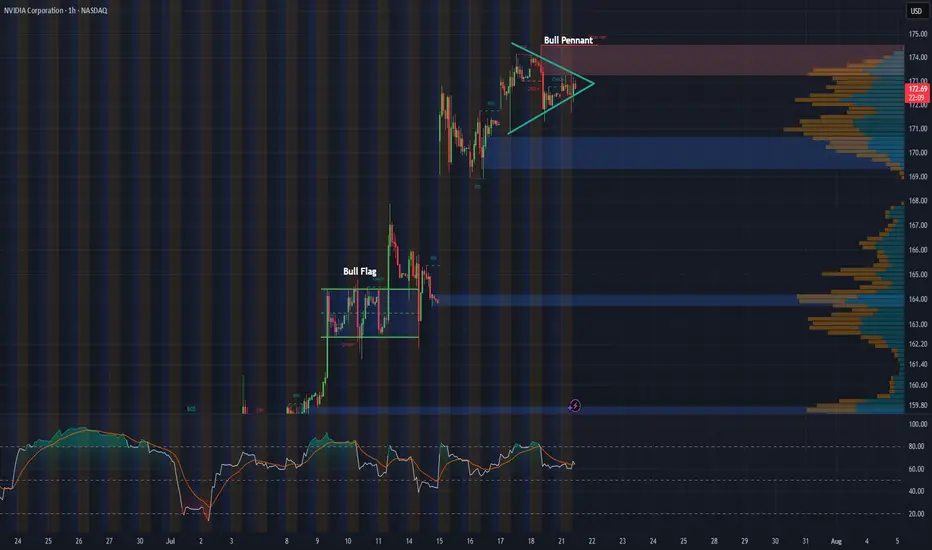
NVDA 1-Hour Chart UpdateHey everyone, just wanted to share a quick update on NVDA’s 1-hour chart. Following last week’s bull flag breakout, the stock appears to be consolidating into what looks like a solid bull pennant formation.
With major tech earnings on the horizon and the recent approval to sell H20 chips to China, this pattern could be setting the stage for another breakout. Will NVDA continue its impressive rally, or is this just a breather before the next move?
Techearnings
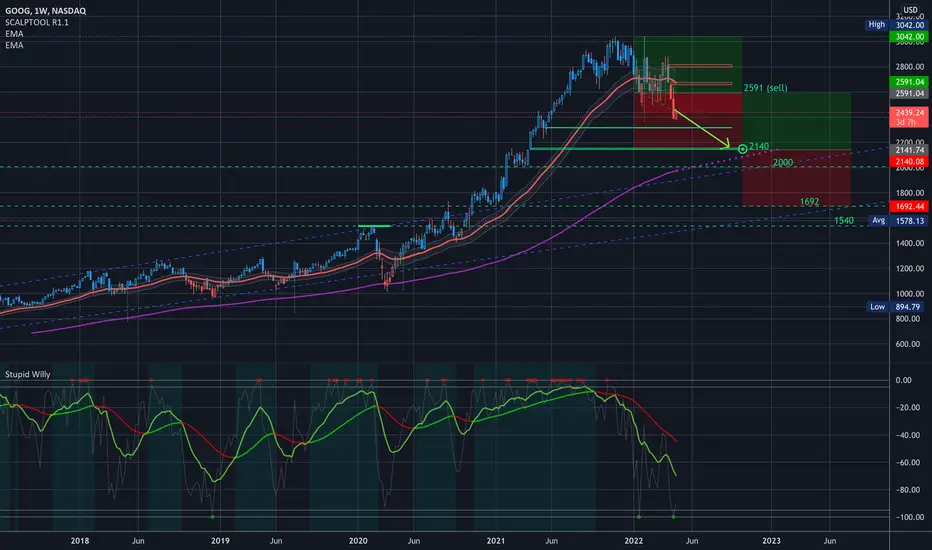
$GOOG Key Levels, Analysis, & Targets $GOOG Key Levels, Analysis, & Targets
—-
I am not your financial advisor. Watch my setups first before you jump in… My trade set ups work very well and they are for my personal reference and if you decide to trade them you do so at your own risk. I will gladly answer questions to the best of my knowledge but ultimately the risk is on you. I will update targets as needed.
GL and happy trading.
IF you need anything analyzed Technically just comment with the Ticker and I’ll do it as soon as possible…
IMPORTANT WEEK! MARKET VOLATILITY EXPECTED!TICKER:$SPY
We closed friday with a big red day; Largest red day since October 1st of 2019. This is due to the financial sector (XLF) topping out at the all time high.
Next week is a very important week for the market. FOMC is on Wednesday in addition to tech earnings ($AAPL, $AMZN, $FB, $MSFT, etc...). I expect high volatility this coming week and depending on this week, the market will either consolidate or continue to reach all time highs.
Regardless if its bulls or bears, I am looking to go aggressive this coming week. If XLF continue to dump with spy breaking the low of friday (327.36), I will play TVIX.
However, bulls still have complete control on the daily and weekly time frame. Anything above 320.15 is just a daily HL.
