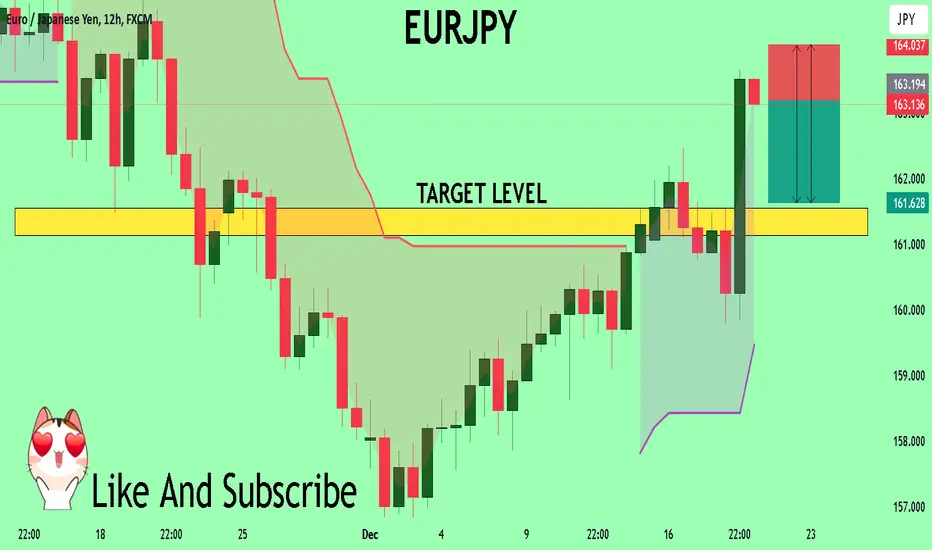
EURJPY Under Pressure! SELL!
My dear friends,
Please, find my technical outlook for EURJPY below:
The price is coiling around a solid key level - 163.20
Bias - Bearish
Technical Indicators: Pivot Points High anticipates a potential price reversal.
Super trend shows a clear sell, giving a perfect indicators' convergence.
Goal - 161.54
Safe Stop Loss - 164.03
About Used Indicators:
The pivot point itself is simply the average of the high, low and closing prices from the previous trading day.
———————————
WISH YOU ALL LUCK
Techincalanalysis
GBPCHF: Forecast & Technical Analysis
The recent price action on the GBPCHF pair was keeping me on the fence, however, my bias is slowly but surely changing into the bullish one and I think we will see the price go up.
❤️ Please, support our work with like & comment! ❤️

EURAUD: Bearish Continuation is Expected! Here is Why:
It is essential that we apply multitimeframe technical analysis and there is no better example of why that is the case than the current EURUSD chart which, if analyzed properly, clearly points in the downward direction.
❤️ Please, support our work with like & comment! ❤️

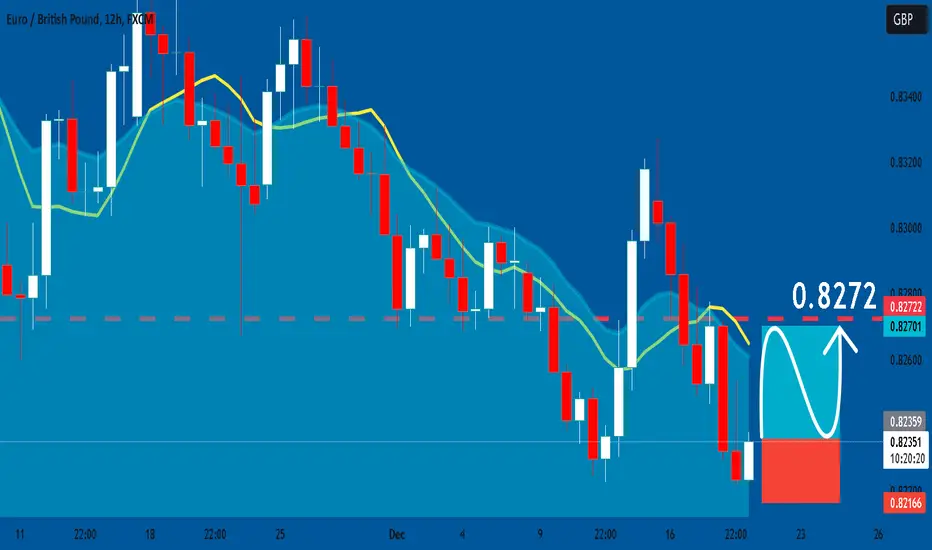
EURGBP: Long Trade with Entry/SL/TP
EURGBP
- Classic bullish pattern
- Our team expects retracement
SUGGESTED TRADE:
Swing Trade
Buy EURGBP
Entry - 0.8235
Stop - 0.8216
Take - 0.8272
Our Risk - 1%
Start protection of your profits from lower levels
❤️ Please, support our work with like & comment! ❤️
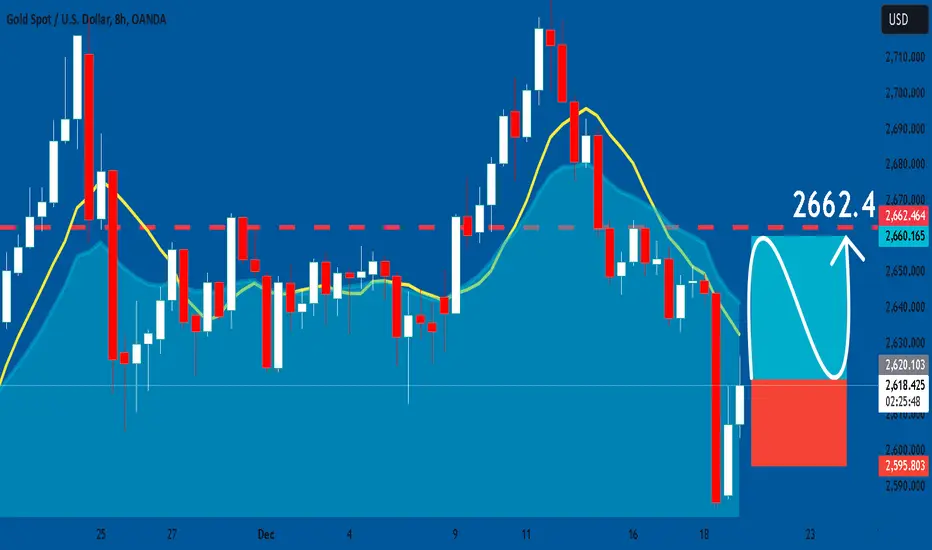
GOLD: Bullish Continuation & Long Trade
GOLD
- Classic bullish setup
- Our team expects bullish continuation
SUGGESTED TRADE:
Swing Trade
Long GOLD
Entry Point - 2619.7
Stop Loss - 2595.8
Take Profit - 2662.4
Our Risk - 1%
Start protection of your profits from lower levels
❤️ Please, support our work with like & comment! ❤️
EURUSD Set To Grow! BUY!
My dear friends,
My technical analysis for EURUSD is below:
The market is trading on 1.0410 pivot level.
Bias - Bullish
Technical Indicators: Both Super Trend & Pivot HL indicate a highly probable Bullish continuation.
Target - 1.0470
Recommended Stop Loss - 1.0376
About Used Indicators:
A pivot point is a technical analysis indicator, or calculations, used to determine the overall trend of the market over different time frames.
———————————
WISH YOU ALL LUCK
NZDCAD: Bullish Forecast & Outlook
It is essential that we apply multitimeframe technical analysis and there is no better example of why that is the case than the current NZDCAD chart which, if analyzed properly, clearly points in the upward direction.
❤️ Please, support our work with like & comment! ❤️

EURCHF: Expecting Bullish Continuation! Here is Why:
The analysis of the EURCHF chart clearly shows us that the pair is finally about to go up due to the rising pressure from the buyers.
❤️ Please, support our work with like & comment! ❤️

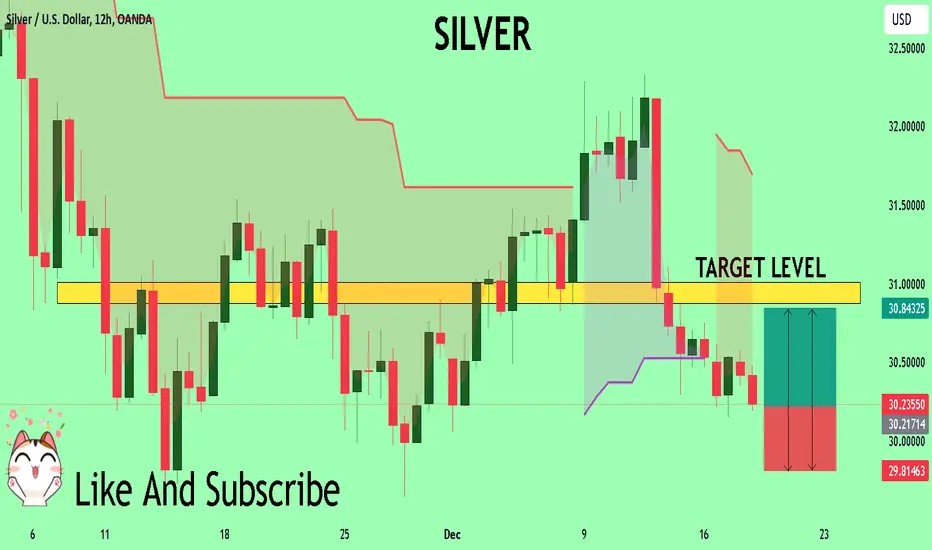
SILVER Will Explode! BUY!
My dear subscribers,
SILVER looks like it will make a good move, and here are the details:
The market is trading on 30.206 pivot level.
Bias - Bullish
My Stop Loss - 28.814
Technical Indicators: Both Super Trend & Pivot HL indicate a highly probable Bullish continuation.
Target - 30.873
About Used Indicators:
The average true range (ATR) plays an important role in 'Supertrend' as the indicator uses ATR to calculate its value. The ATR indicator signals the degree of price volatility.
———————————
WISH YOU ALL LUCK
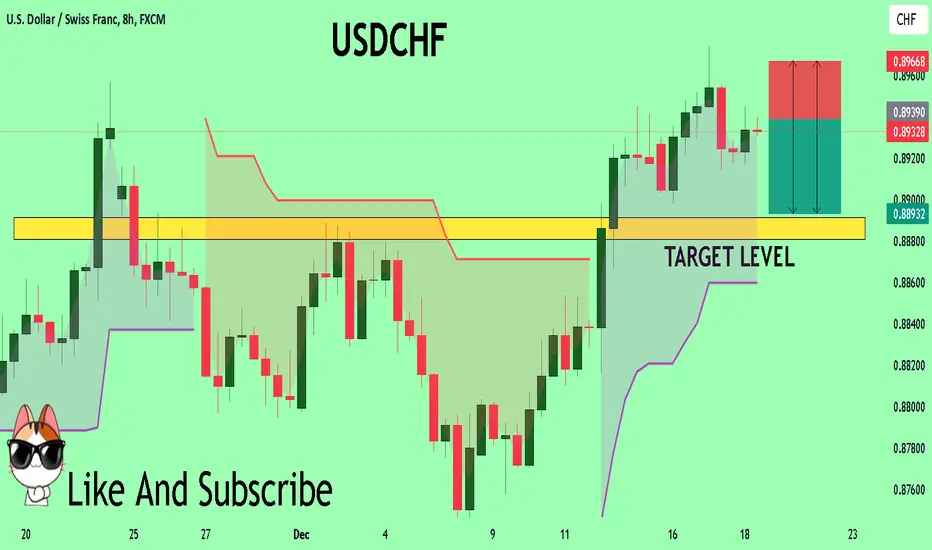
USDCHF A Fall Expected! SELL!
My dear followers,
This is my opinion on the USDCHF next move:
The asset is approaching an important pivot point 0.8939
Bias - Bearish
Safe Stop Loss - 0.8966
Technical Indicators: Supper Trend generates a clear short signal while Pivot Point HL is currently determining the overall Bearish trend of the market.
Goal - 0.8891
About Used Indicators:
For more efficient signals, super-trend is used in combination with other indicators like Pivot Points.
———————————
WISH YOU ALL LUCK
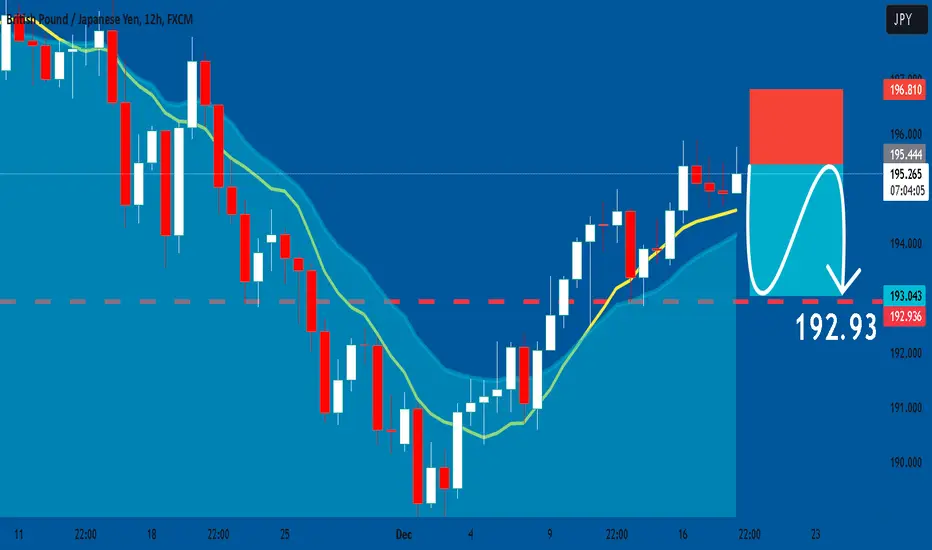
GBPJPY: Short Trading Opportunity
GBPJPY
- Classic bearish formation
- Our team expects fall
SUGGESTED TRADE:
Swing Trade
Sell GBPJPY
Entry Level - 195.44
Sl - 196.81
Tp - 192.93
Our Risk - 1%
Start protection of your profits from lower levels
❤️ Please, support our work with like & comment! ❤️
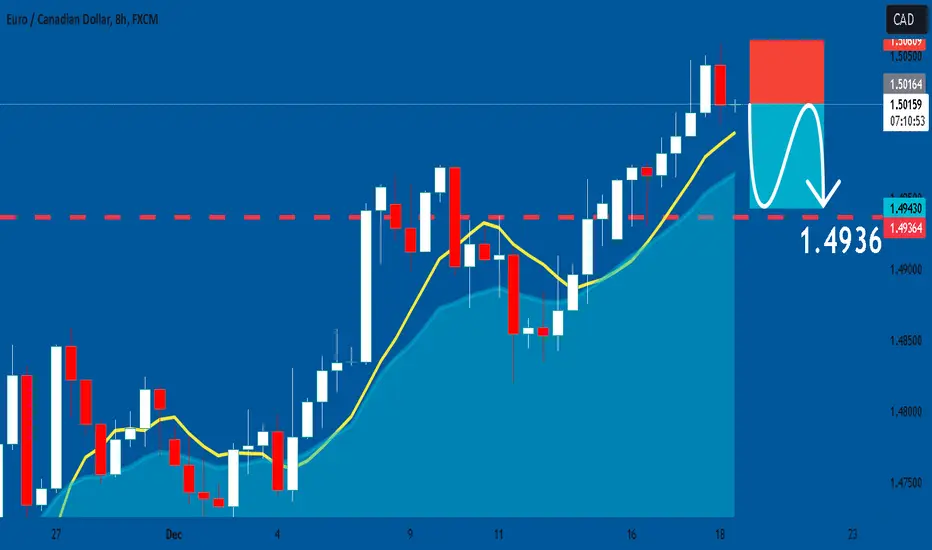
EURCAD: Short Trade Explained
EURCAD
- Classic bearish formation
- Our team expects pullback
SUGGESTED TRADE:
Swing Trade
Short EURCAD
Entry - 1.5016
Sl - 1.5060
Tp - 1.4936
Our Risk - 1%
Start protection of your profits from lower levels
❤️ Please, support our work with like & comment! ❤️
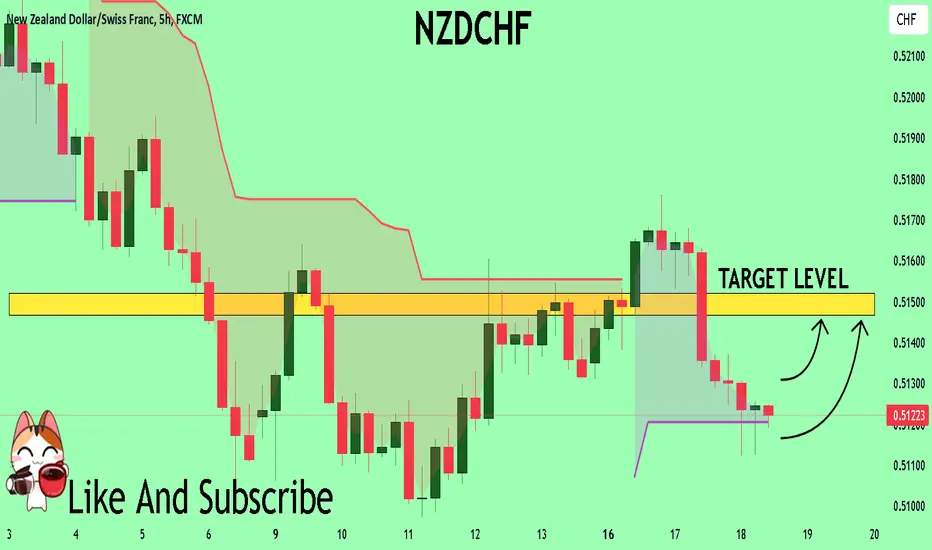
NZDCHF The Target Is UP! BUY!
My dear followers,
I analysed this chart on NZDCHF and concluded the following:
The market is trading on 0.5121 pivot level.
Bias - Bullish
Technical Indicators: Both Super Trend & Pivot HL indicate a highly probable Bullish continuation.
Target - 0.5146
About Used Indicators:
A super-trend indicator is plotted on either above or below the closing price to signal a buy or sell. The indicator changes color, based on whether or not you should be buying. If the super-trend indicator moves below the closing price, the indicator turns green, and it signals an entry point or points to buy.
———————————
WISH YOU ALL LUCK
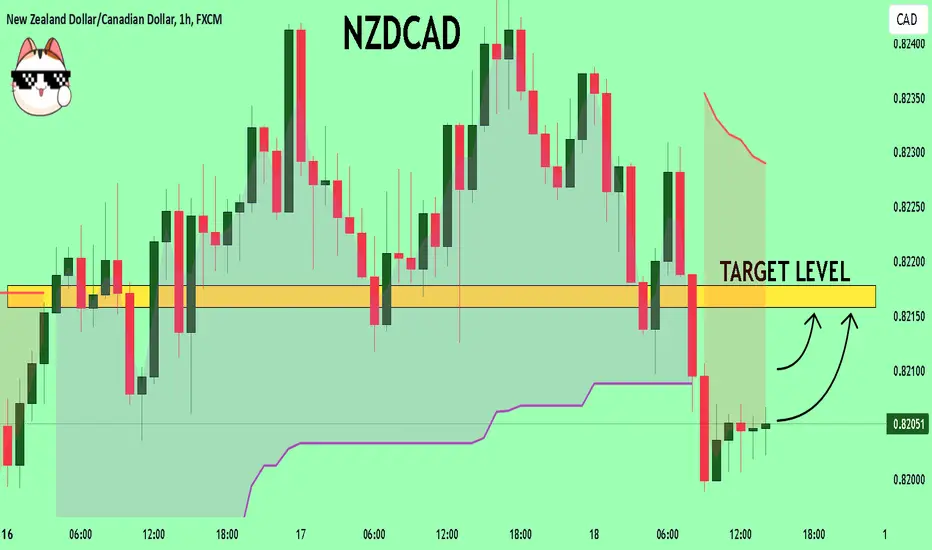
NZDCAD Sellers In Panic! BUY!
My dear friends,
NZDCAD looks like it will make a good move, and here are the details:
The market is trading on 0.8205 pivot level.
Bias - Bullish
Technical Indicators: Supper Trend generates a clear long signal while Pivot Point HL is currently determining the overall Bullish trend of the market.
Goal - 0.8215
About Used Indicators:
Pivot points are a great way to identify areas of support and resistance, but they work best when combined with other kinds of technical analysis
———————————
WISH YOU ALL LUCK
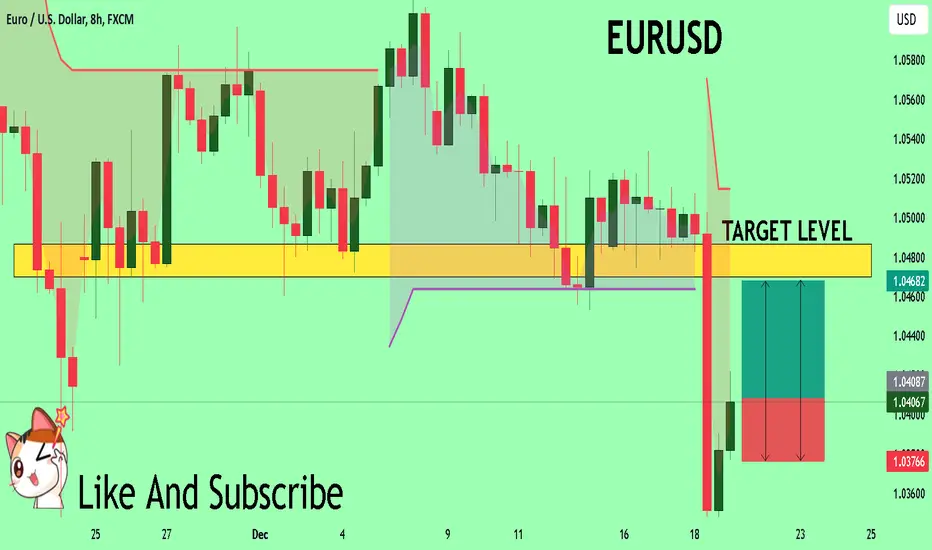
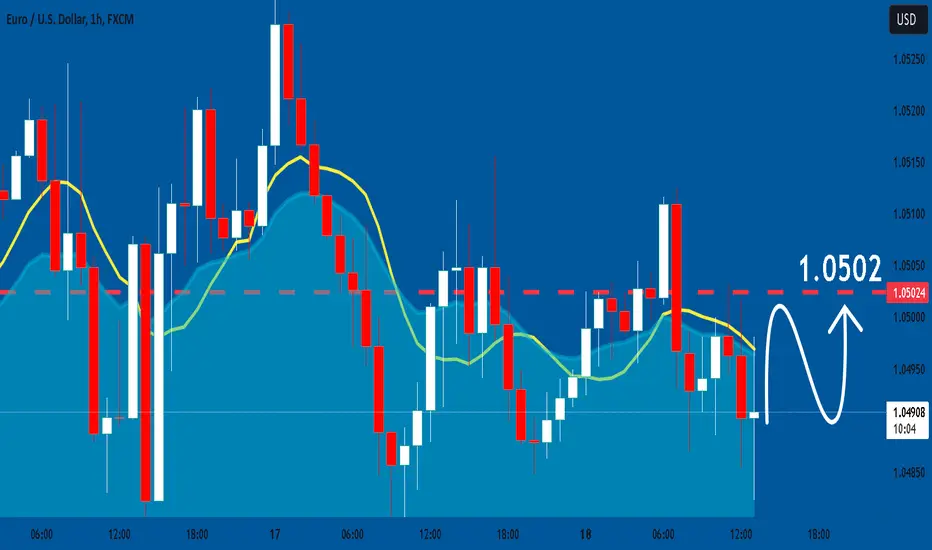
EURUSD Set To Fall! SELL!
My dear friends,
Please, find my technical outlook for EURUSD below:
The instrument tests an important psychological level 1.0498
Bias - Bearish
Technical Indicators: Supper Trend gives a precise Bearish signal, while Pivot Point HL predicts price changes and potential reversals in the market.
Target - 1.0482
About Used Indicators:
Super-trend indicator is more useful in trending markets where there are clear uptrends and downtrends in price.
———————————
WISH YOU ALL LUCK

AUDCHF The Target Is DOWN! SELL!
My dear friends,
Please, find my technical outlook for AUDCHF below:
The price is coiling around a solid key level - 0.5674
Bias - Bearish
Technical Indicators: Pivot Points High anticipates a potential price reversal.
Super trend shows a clear sell, giving a perfect indicators' convergence.
Goal - 0.5637
About Used Indicators:
The pivot point itself is simply the average of the high, low and closing prices from the previous trading day.
———————————
WISH YOU ALL LUCK

GBPCHF Trading Opportunity! SELL!
My dear subscribers,
This is my opinion on the GBPCHF next move:
The instrument tests an important psychological level 1.1361
Bias - Bearish
Technical Indicators: Supper Trend gives a precise Bearish signal, while Pivot Point HL predicts price changes and potential reversals in the market.
Target - 1.1313
About Used Indicators:
On the subsequent day, trading above the pivot point is thought to indicate ongoing bullish sentiment, while trading below the pivot point indicates bearish sentiment.
———————————
WISH YOU ALL LUCK

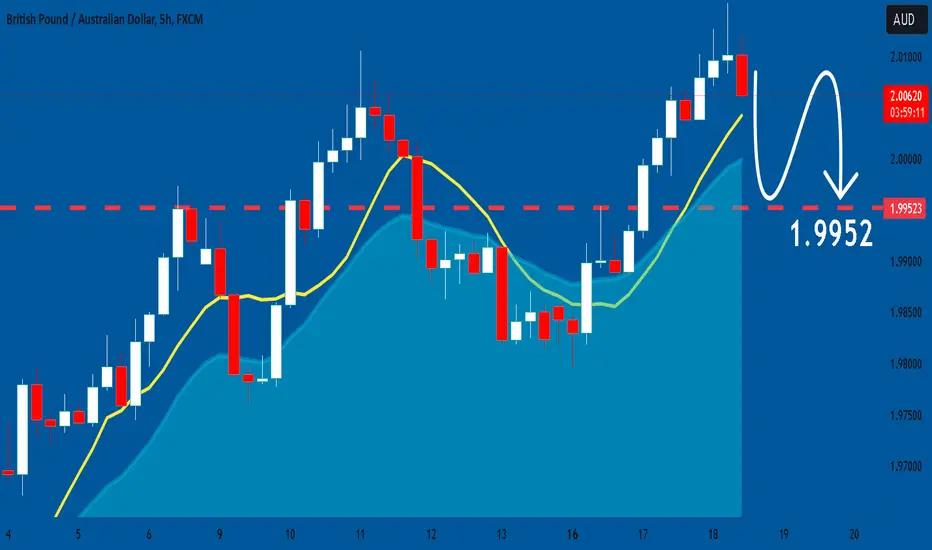
GBPAUD: Market of Sellers
The analysis of the GBPAUD chart clearly shows us that the pair is finally about to tank due to the rising pressure from the sellers.
❤️Please, support our work with like & comment!❤️
EURUSD: Will Keep Growing! Here is Why:
Looking at the chart of EURUSD right now we are seeing some interesting price action on the lower timeframes. Thus a local move up seems to be quite likely.
❤️ Please, support our work with like & comment! ❤️
AUD/CHF BULLS WILL DOMINATE THE MARKET|LONG
Hello, Friends!
It makes sense for us to go long on AUD/CHF right now from the support line below with the target of 0.566 because of the confluence of the two strong factors which are the general uptrend on the previous 1W candle and the oversold situation on the lower TF determined by it’s proximity to the lower BB band.
✅LIKE AND COMMENT MY IDEAS✅

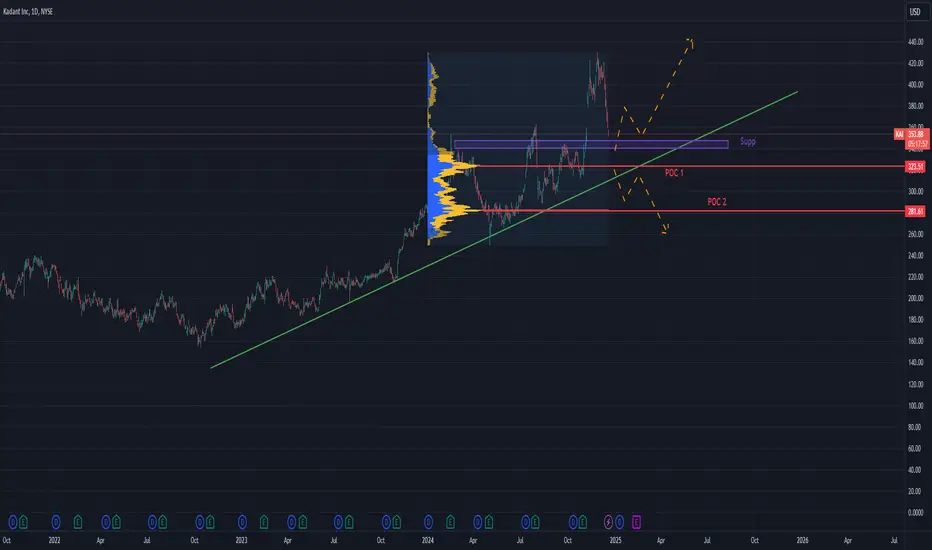
Technical Analysis on Kadant (KAI)Kadant ( KAI ) has maintained a clear upward trend, characterized by higher highs and higher lows. Throughout its bullish phase, the stock experienced periodic pullbacks between 20% and 30%.
After recently hitting its all-time highs, the stock is currently undergoing a retracement, approaching potential support zones.
Bullish Scenario
The first potential support levels are close to the current price:
SUP 1 around $304
POC 1 around $320
Another possible support zone is POC 2 near $280, which could provide a significant base if the price continues to drop.
Bearish Scenario
For a bearish outlook, key levels to monitor include:
A breakdown below POC 1 ($320)
A trendline break (green line)
A breach of POC 2 ($280), indicating a potential continuation of the downtrend.
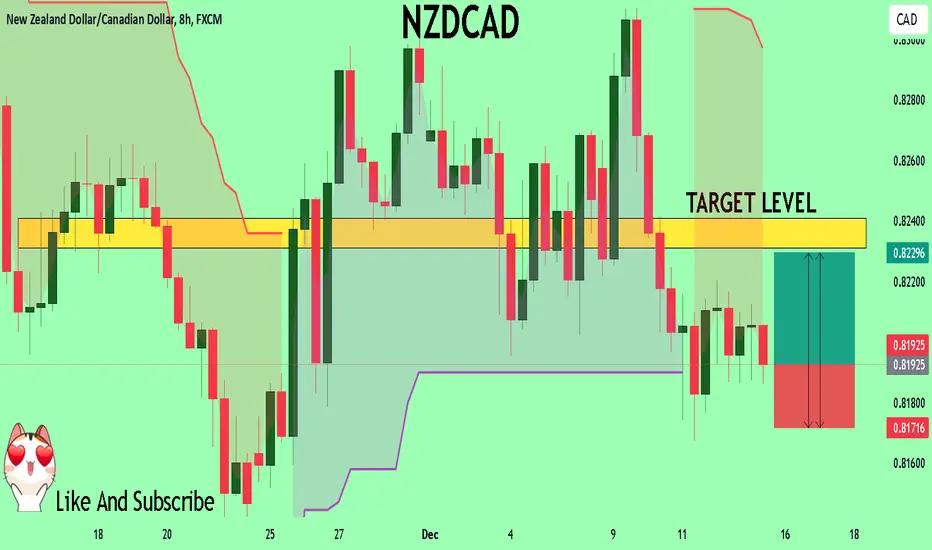
NZDCAD On The Rise! BUY!
My dear friends,
Please, find my technical outlook for NZDCAD below:
The price is coiling around a solid key level - 0.8192
Bias - Bullish
Technical Indicators: Pivot Points Low anticipates a potential price reversal.
Super trend shows a clear buy, giving a perfect indicators' convergence.
Goal - 0.8231
Safe Stop Loss - 0.8171
About Used Indicators:
The pivot point itself is simply the average of the high, low and closing prices from the previous trading day.
———————————
WISH YOU ALL LUCK
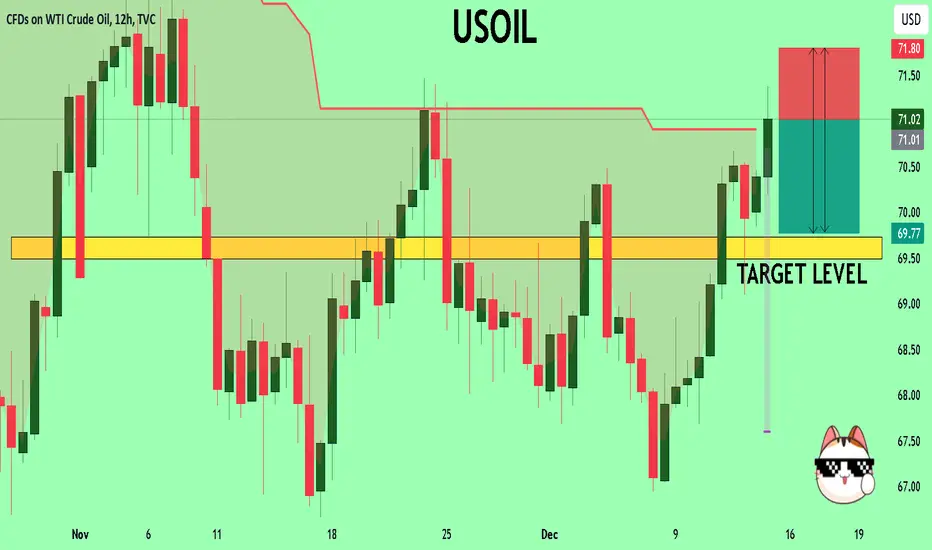
USOIL Under Pressure! SELL!
My dear subscribers,
This is my opinion on the USOIL next move:
The instrument tests an important psychological level 71.02
Bias - Bearish
Technical Indicators: Supper Trend gives a precise Bearish signal, while Pivot Point HL predicts price changes and potential reversals in the market.
Target - 69.73
My Stop Loss - 71.80
About Used Indicators:
On the subsequent day, trading above the pivot point is thought to indicate ongoing bullish sentiment, while trading below the pivot point indicates bearish sentiment.
———————————
WISH YOU ALL LUCK