Nasdaq: Bull flag breakout on daily chart, testing ATHsBeen a while since I last posted. So figured I'd share this quick chart. Market undoubtedly have been incredibly volatile this month. However luckily, the Nasdaq has been forming bull flag on the daily chart. This follows a strong prior uptrend. The breakout took place today, sending the index to test ATHs.
Notable stocks making a move are names like NASDAQ:AMZN and NASDAQ:NVDA , mainly due to the broader market strength. Other indices, such as the S&P 500 ( SP:SPX ) also are breaking out as they form a similar bull flag pattern.
At ATHs, this is a deciding factor of where the market goes next. Either it bounces off to near-term support, or the market rallies to a new all-time high until next cooldown.
Note: not financial advice
Techincalanalysis

SoFi Technologies (SOFI, 1D)On the daily chart, SoFi has broken out of its descending trendline, confirmed the breakout with a clean retest of the 0.618 Fibonacci retracement level at $12.33, and is now building upward momentum from this demand zone. This “buy zone” is acting as a launchpad for a potential mid-term move toward higher resistance levels.
Key Fibonacci-based upside targets:
– $13.48 (0.5 retracement)
– $14.64 (0.382 retracement)
– $16.07 (0.236 retracement) — within the defined target zone
– Extended target: $18.37 (1.0 Fibonacci projection)
Technical structure highlights:
– Breakout of multi-month downtrend + successful retest
– Price now trading above key EMAs (50/100/200)
– Volume expansion on bullish candles confirms demand
– Daily momentum favors further continuation toward the $14–$16 zone
– Premium supply zone above $16 may slow initial momentum but offers long-term potential toward $18+
Fundamental context:
SoFi is evolving as a vertically integrated fintech platform with strong brand recognition and growing user engagement across banking, investing, and lending services. As the company narrows losses and strengthens recurring revenue, investor interest in SOFI is growing — particularly as market appetite returns for high-quality fintech with path-to-profitability models.
The technical breakout is confirmed. As long as price remains above the $12.33–$12.50 buy zone, the bullish scenario remains valid with targets toward $14.64 and $16.07. A breakout above $16 would activate the full expansion toward $18.37 in the mid-term.

GBP/USD Downtrend Wedge Breakout Setup – Bullish Target AheadThe GBP/USD pair is currently displaying a downtrend wedge pattern, a structure that typically signals a bullish reversal when confirmed. The pattern is formed by a descending resistance trendline (in red) and a gradually sloping support line (in green), converging to a point. Price has bounced off the wedge’s support multiple times while forming lower highs, creating pressure that often leads to a breakout.
As seen in the chart, the pair recently surged toward the upper resistance line and is now attempting to break above it. A successful breakout with bullish candle confirmation could lead to a strong move upward.
📈 Breakout Scenario
If the price manages to close above the resistance zone (~1.3490–1.3500), it would confirm the wedge breakout. Based on the height of the pattern, the projected breakout target is around 1.3692. This target is calculated by measuring the vertical height of the wedge and adding it to the breakout point. Confirmation of breakout should ideally include a retest of the broken resistance acting as new support.
📉 Rejection Scenario
However, if the breakout attempt fails and the price gets rejected again from the red resistance line, the pair could retest the wedge’s support area around 1.3360. A breakdown below the green zone would invalidate the bullish outlook and suggest continued bearish pressure.
⚙️ Strategy Tips
Buy Setup: Enter after breakout candle closes above 1.3500 with stop loss just below breakout zone.
Take Profit: Use the 1.3692 level as the primary target or scale out on the way up.
Confirmation: Always wait for breakout confirmation before entering; avoid false breakouts.
✅ Conclusion
This wedge breakout setup offers a bullish trading opportunity if confirmed. The clear structure, repeated tests of both support and resistance, and recent momentum build a strong technical case. Still, confirmation is key before initiating any positions.
=================================================================
Disclosure: I am part of Trade Nation's Influencer program and receive a monthly fee for using their TradingView charts in my analysis.
=================================================================

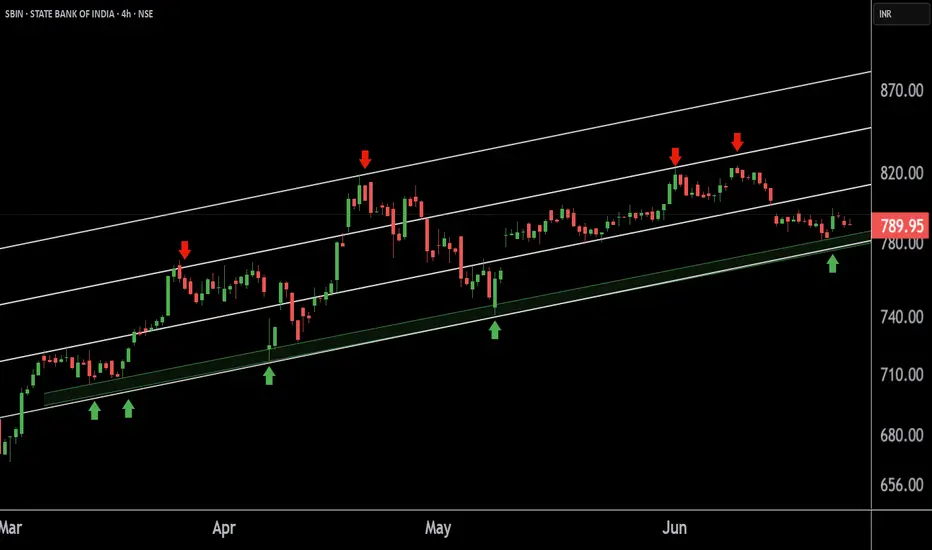
STATE BANK OF INDIA at Best Support !!This is the 4 hour Chart of STATE BANK OF INDIA.
SBIN is having good Support at 770 range.
SBIN is moving within an ascending channel, with a support zone in the range of 770–780.
If this level is Sustain ,then we may see higher prics in SBIN.
Thank You !!
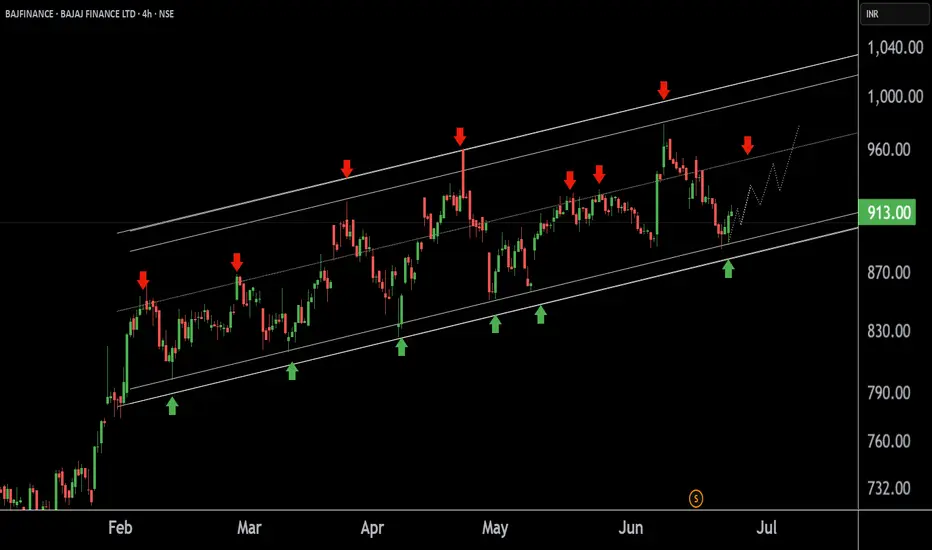
BAJAJ FINANCE LTD at Best Support !!This is the 4 hour Chart of BAJFINANCE.
BAJFINANCE having a good support at 880-900 range.
BAJFINANCE is currently trading within an ascending channel pattern, indicating a structure of higher highs and higher lows, which reflects a sustained uptrend.
If this level is sustain, then we may see higher prices again BAJFINANCE.
Thank You !!
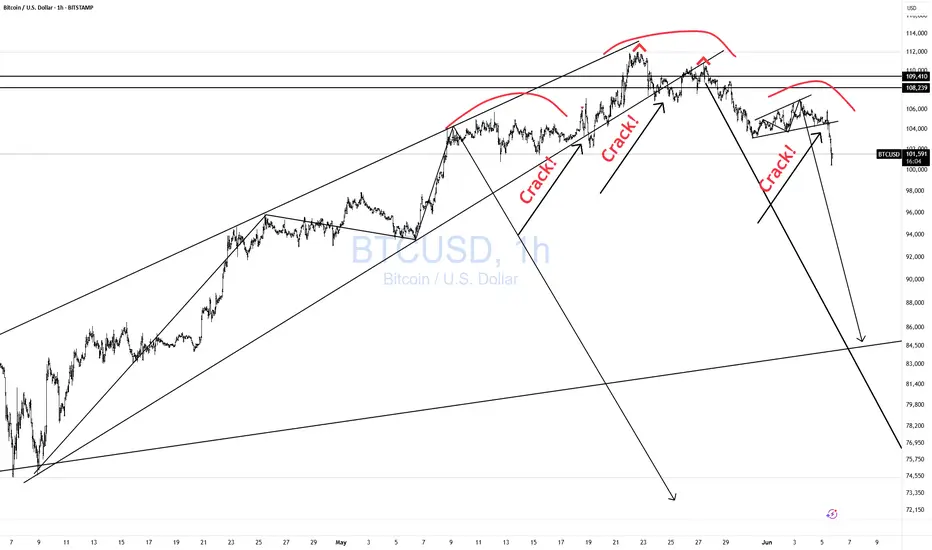
BTCUSD CRACKing Everywhere!As I have been warning for a while now. See previous post.
I first warned to wait for the CRACK!
Then we got the 2nd CRACK!, very normal.
Then a nice M pattern with a lower high.
Then another CRACK!
And now a right Shoulder.
MAGIC!
Now we wait for the H&S to break down.
Click boost, follow, and subscribe for more. Let's get to 5,000 followers. ))
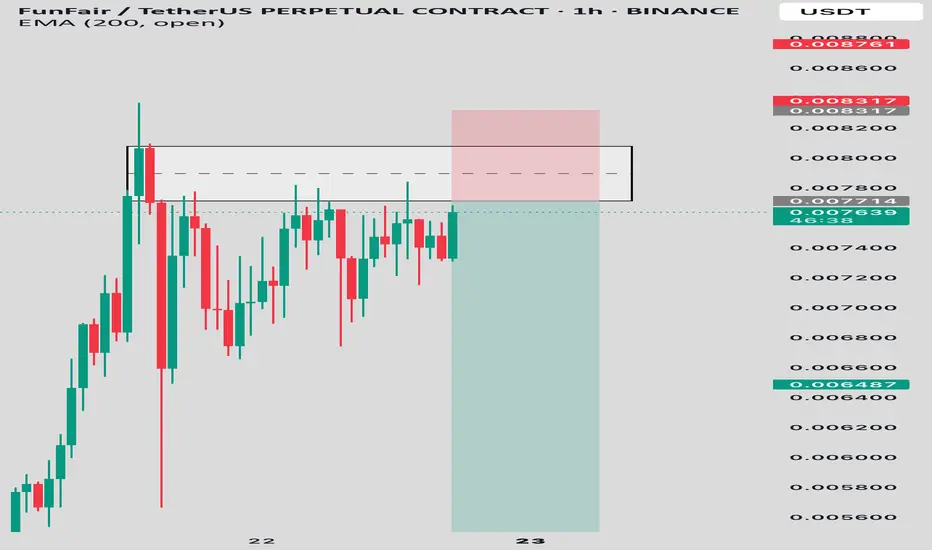
FUNUSDT SHORTAfter a strong impulsive rally, FUN/USDT tapped into a high-probability supply zone between 0.00771 – 0.00831, showing clear rejection with long upper wicks. Multiple attempts to break above the zone failed indicating buyer exhaustion and a potential reversal
• Entry: 0.00771
• Stop Loss: 0.008317 (above supply zone)
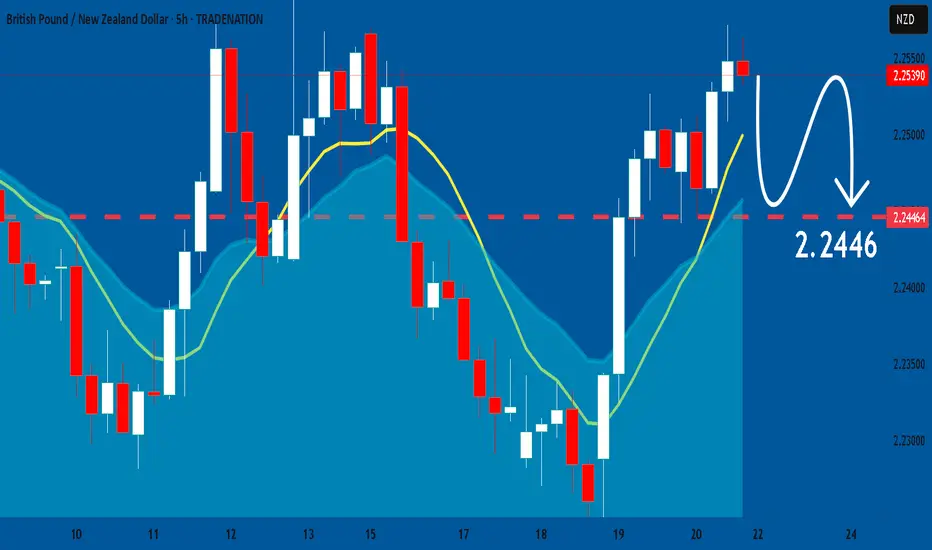
GBPNZD: Market Sentiment & Forecast
Looking at the chart of GBPNZD right now we are seeing some interesting price action on the lower timeframes. Thus a local move down seems to be quite likely.
Disclosure: I am part of Trade Nation's Influencer program and receive a monthly fee for using their TradingView charts in my analysis.
❤️ Please, support our work with like & comment! ❤️
BTCUSD Analysis | is 100k the Next Target?🔍 Chart Breakdown:
Price previously formed a range under key resistance at $108,800.
A Triangle Pattern emerged after a sharp rejection from the resistance zone.
The recent breakdown from this pattern signals bearish momentum.
Support Level: $100,513 — Key level to watch for a potential bounce or further breakdown.
📊 Scenarios to Watch:
🔴 Bearish Case (Preferred):
Breakdown continuation below $104,000 could trigger a move toward the $100,500 support.
Clean rejection from triangle breakdown area confirms the bearish structure.
🟢 Bullish Case (Less Likely):
If BTC holds above $104,000 and breaks above the mid-range zone (~$106,500), a retest of $108,800 is possible.
Watch for fakeouts at the top of the range.
💡Trade Ideas:
Short opportunities on breakdown retest or rejection from $106,000–106,500.
Potential long only if $108,800 is broken with strong volume confirmation.
🛑 Risk Management:
Always use stop-loss. Monitor BTC dominance and macro sentiment for confluence.
💬 What do you think? Bearish breakdown or fakeout trap? Let’s discuss below!

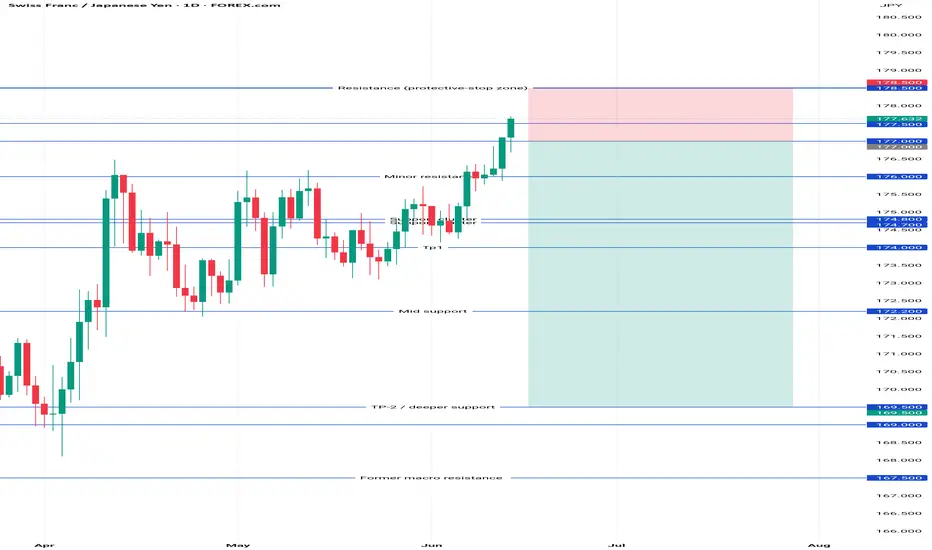
CHF/JPY SellCHF/JPY Pull-back Short (set-and-forget)
Condition to place order:
Wait for a daily candle to close below 177.50.
Then enter the order:
• Sell Limit 177.00
• Stop Loss 178.50
• Take Profit 1 174.50
• Take Profit 2 169.50
• Expiry: cancel if not filled after 5 trading days.
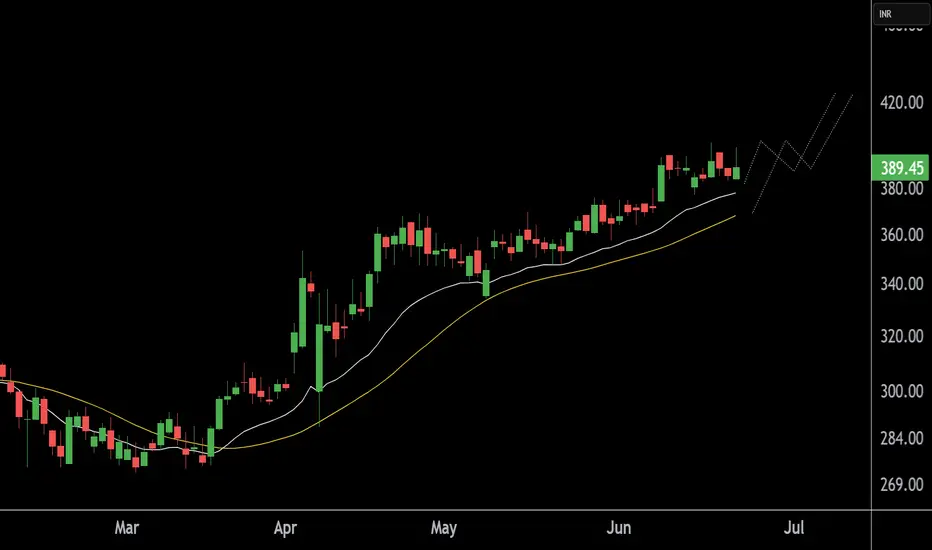
CSBBANK at Best Support !!This is the Daily Chart of CSBBANK.
CSBBANK is currently showing momentum while taking support from the EMA and SMA at 380 and 368 range.
If this level is sustain , then We may see higher prices in CSBBANK
Thank You !!
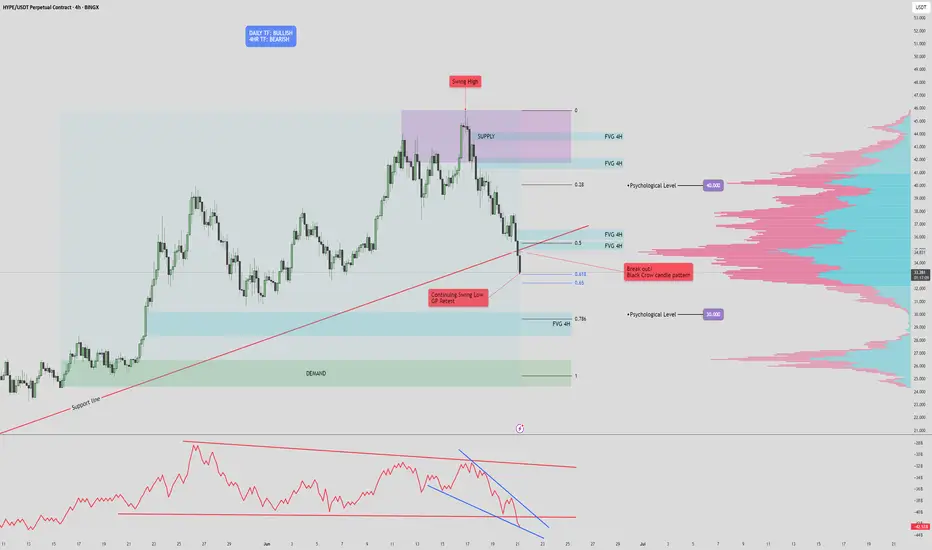
HYPE/USDT Technical Analysis (4H Chart)🔍 HYPE/USDT Technical Analysis (4H Chart)
High Time Frame (Daily): Bullish
Despite recent pullbacks, the overall trend remains bullish on the daily timeframe. However, current price action suggests a potential fakeout or legitimate breakdown, as we test key structural and volume-based supports.
Short-Term Time Frame (4H): Bearish
The 4-hour chart displays clear bearish pressure, confirmed by the Three Black Crows candlestick pattern. This signals sustained selling interest and supports the current downward move.
🧱 Key Zones
Supply Zone: $41.7 – $45.9
Strong resistance marked by prior selling pressure and overlapping FVGs.
Demand Zone: $24.4 – $26.3
Historical area of buying support, aligned with a low-volume node and an unfilled FVG.
📏 Fair Value Gaps (FVGs)
Above Price:
Four 4H FVGs act as upside inefficiencies, offering targets in a bullish recovery:
~$34.9
~$36.6
~$37.8
~$40.0 (psychological level & POC cluster)
Below Price:
One major 4H FVG remains unfilled, directly above the demand zone.
📐 Fibonacci Analysis
Price is testing the Golden Pocket (0.618–0.65) from the recent swing low to high.
A clean break below this area (with confirmation) targets the unfilled FVG around $30, and potentially the demand zone ($24.4–$26.3).
📉 Volume Profile Insight
Volume is clustered around $34–$37, indicating strong past market participation.
Very low volume between $29–$30, creating a volume void — if price loses support at the FVG and golden pocket, it could rapidly drop into the demand zone.
🔻 OBV Analysis (Volume Momentum)
OBV has broken below a larger rising wedge, confirming bearish divergence.
A falling wedge is now forming within OBV.
Break below this wedge: Confirms further price breakdown.
Reclaim of the larger wedge trendline: Suggests potential bullish reversal.
✅ Trade Scenarios
🔺 Bullish Scenario
Trigger: Bullish reversal pattern at the golden pocket (e.g., double bottom, falling wedge, inverse H&S) + OBV recovery.
Entry: Upon confirmation around $32.5.
Targets:
$34.9 (FVG)
$36.6 (FVG)
$37.8 (FVG)
$40.0 (psychological)
Stop: Below $30 or recent swing low (tight below FVG).
🔻 Bearish Scenario
Trigger : Confirmed breakdown of golden pocket & 4H FVG with OBV falling wedge breakdown.
Entry : Below $32.5 with confirmation (e.g., retest or strong momentum candle).
Targets:
$30.0 (psychological level)
$28.5 (FVG zone)
$26.3 → $24.4 (Demand zone)
Stop : Above golden pocket resistance (~$33.8–$34.2).
📝 Conclusion: The market is at a pivotal point. A confirmed break below $32.5 could accelerate selling due to the volume gap, while a strong bullish reaction from the golden pocket could drive a recovery toward $40. Always wait for confirmation before entering either scenario.
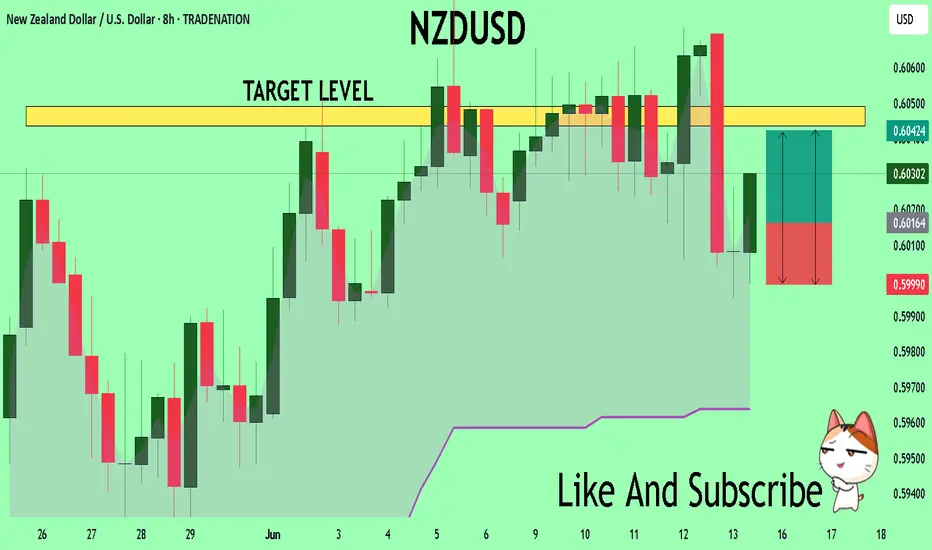
NZDUSD My Opinion! BUY!
My dear subscribers,
My technical analysis for NZDUSD is below:
The price is coiling around a solid key level - 0.6015
Bias - Bullish
Technical Indicators: Pivot Points High anticipates a potential price reversal.
Super trend shows a clear buy, giving a perfect indicators' convergence.
Goal - 0.6043
My Stop Loss - 0.5999
About Used Indicators:
By the very nature of the supertrend indicator, it offers firm support and resistance levels for traders to enter and exit trades. Additionally, it also provides signals for setting stop losses
Disclosure: I am part of Trade Nation's Influencer program and receive a monthly fee for using their TradingView charts in my analysis.
———————————
WISH YOU ALL LUCK
+177% in last hour $1.33 to $3.69 $NXTTThis is what I mean when I say Power Hour 🚀 NASDAQ:NXTT
The move triggered exactly at 15:00 and went into power vertical
Can't wait for market to open next week, hot summer coming 🤑

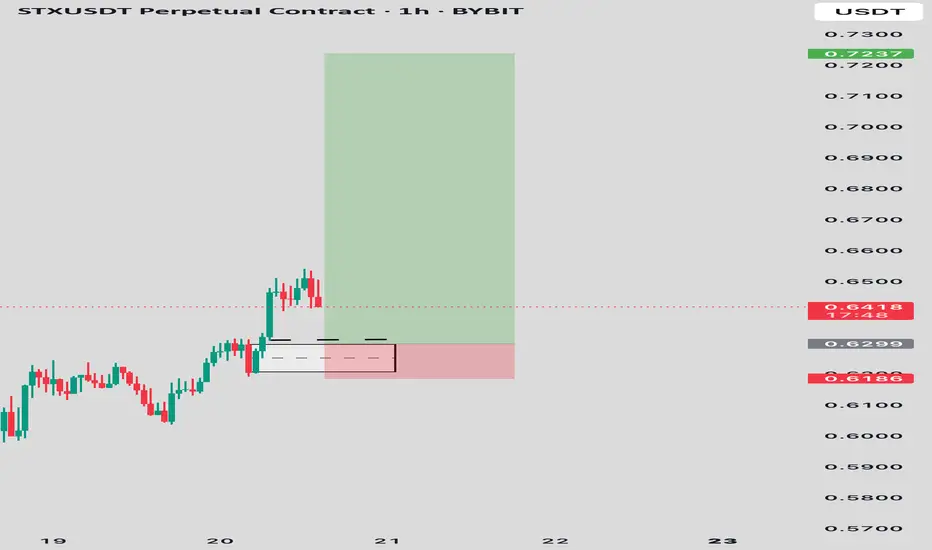
STXUSDT LONGPrice has broken out of a consolidation range and retested previous structure support at 0.6299. Bullish momentum followed with a clean engulfing candle on the 1H timeframe, confirming potential continuation.
Entry: $0.6299 (demand zone retest)
Stop Loss: $0.6186 (below demand)
Target: $0.6900 zone (key resistance, can be extended depending on the market conditions)
GOLD (XAUUSD) – Wave b Complete? Preparing for Wave c RallyGold tapped into the key demand zone and swept sell-side liquidity (SSL) beneath wave (iii) lows.
A five-wave decline appears complete, with wave (v) of b terminating just below the o.618 fib extension at 3344.86.
🟢 Wave c projection now in focus — looking for a 5-wave impulsive rally to develop.
Targeting the Sell Zone between the 0.5–0.764 retracement (3395.87–3425.07).
🧠 Structure Notes:
✅ Imbalance Zone (IMB) formed during the breakdown has now been tapped
🔻 SSL swept + bullish reaction = potential change of state
🟢 Wave (i) and (ii) projection underway – price needs to maintain structure above 3357.43 for bullish continuation
Targets: 3408.81 (0.618 Fib)
Invalidation below: 3340.31
Momentum and RSI divergence support reversal

XRP ANALYSIS🔮 #XRP Analysis - Update 🚀🚀
💲 As we said earlier #XRP performed the same. Resistance1 achieved easily. Now we can see that there is a formation of Falling Wedge Wedge Pattern in #XRP and we can see a more retest before a bullish movement again.
💸Current Price -- $2.1729
📈Target Price -- $2.5964
⁉️ What to do?
- We have marked crucial levels in the chart . We can trade according to the chart and make some profits. 🚀💸
#XRP #Cryptocurrency #Breakout #DYOR

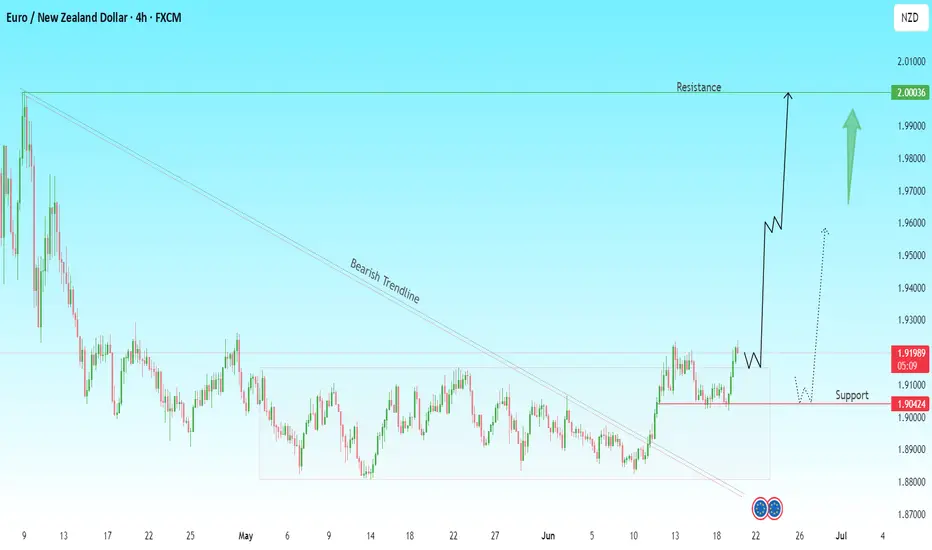
EURNZD Breakout Incoming? Watch This Zone Closely!The Euro has broken out of a long-standing bearish trendline, signaling a potential shift in momentum.
🔍 Key Levels to Watch:
Resistance: 2.0000 (psychological & technical level)
Support: 1.9042
Current Price: 1.9202
What I'm Seeing:
Price has broken the descending trendline and is consolidating above support.
A successful retest of the 1.9042 support zone could trigger a bullish wave toward 2.0000.
Two scenarios to watch:
Aggressive move: Price continues upwards from current consolidation.
Retest play: Price pulls back to support, forms a higher low, and then launches.
📊 Trade Idea (Not Financial Advice):
Buy zone: 1.9050–1.9100 (upon confirmation)
Target: 2.0000
Invalidation: Clean break below 1.9000
Momentum is building, and a rally toward 2.0000 could be on the horizon. Patience is key — wait for confirmation.
What are your thoughts on EUR/NZD? Bullish or bearish?
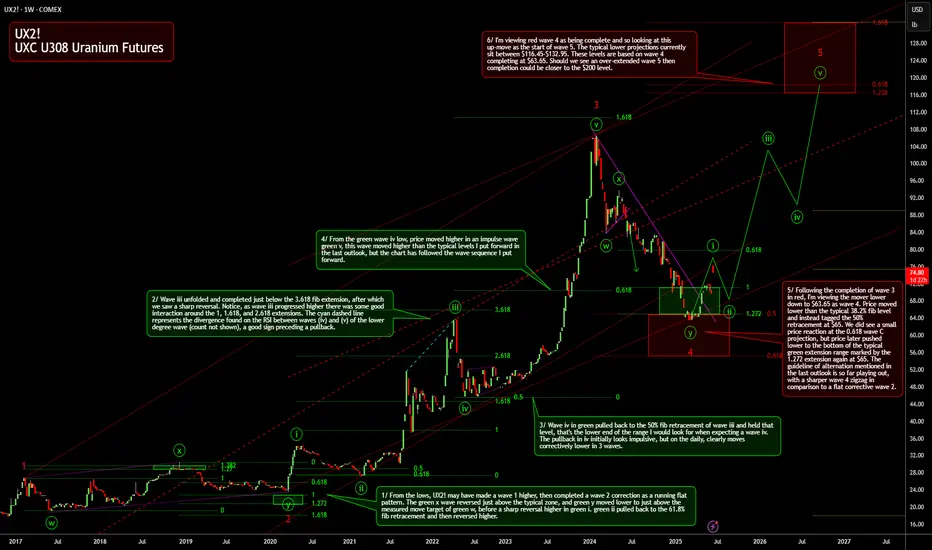
UX2! Uranium Futures OutlookExpecting a continuation higher on COMEX:UX2! uranium futures, looking for a wave 5 in red to unfold.
GOLD is in Retracement GOLD is in bullish trend and it can make a retracement so that would be around 3260

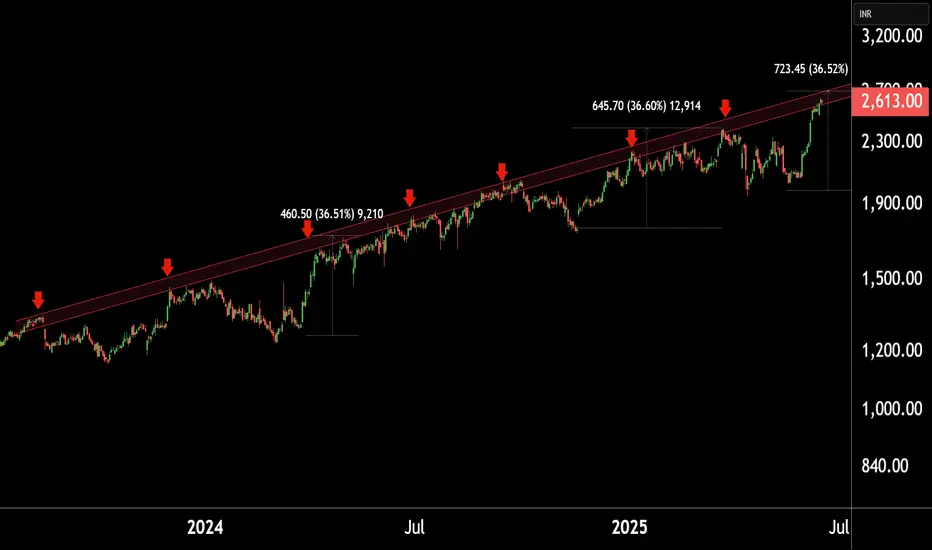
MUTHOOT FINANCE at Best Resistance !! This is the Daily Chart of MUTHOOT FINANCE .
MUTHOOTFIN is currently trading near its resistance range around the 2700 range.
MUTHOOTFIN has completed its upward move as per its natural price behavior, with the rise reaching up to the 2700 range.
If This level is sustain , then we may see lower prices in MUTHOOTFIN.
Thank You !!
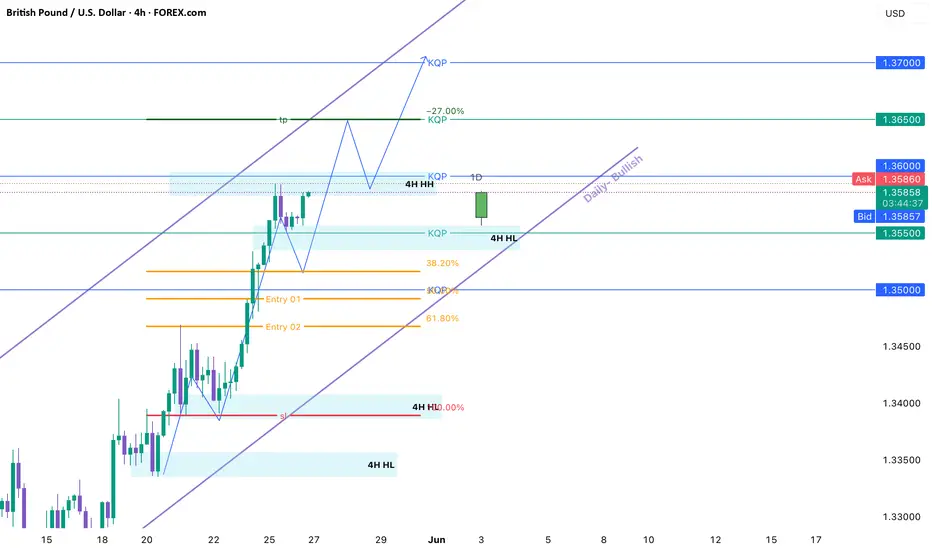
GBPUSD ANALYSIS Based on technical analysis GU is in a bullish trend and we should only be looking for buys.
Expect a pullback near the fibs reversal zone for a buy entry.
Risk Reward- 1% : 3 or your TP can be the 4H HH zone.
Keep your trading plan simple and only take quality trades in the direction of the trend. The trend is your soulmate.
GBPCHF: Long Trade Explained
GBPCHF
- Classic bullish formation
- Our team expects pullback
SUGGESTED TRADE:
Swing Trade
Long GBPCHF
Entry - 1.1005
Sl - 1.0971
Tp - 1.1064
Our Risk - 1%
Start protection of your profits from lower levels
Disclosure: I am part of Trade Nation's Influencer program and receive a monthly fee for using their TradingView charts in my analysis.
❤️ Please, support our work with like & comment! ❤️
