GBPUSD LONG Risky trade- 1-6RRGBPUSD LONG - 1-6RR - Lets see if this Long holds. But its too risky because we might week falling.
Techincalanalysis
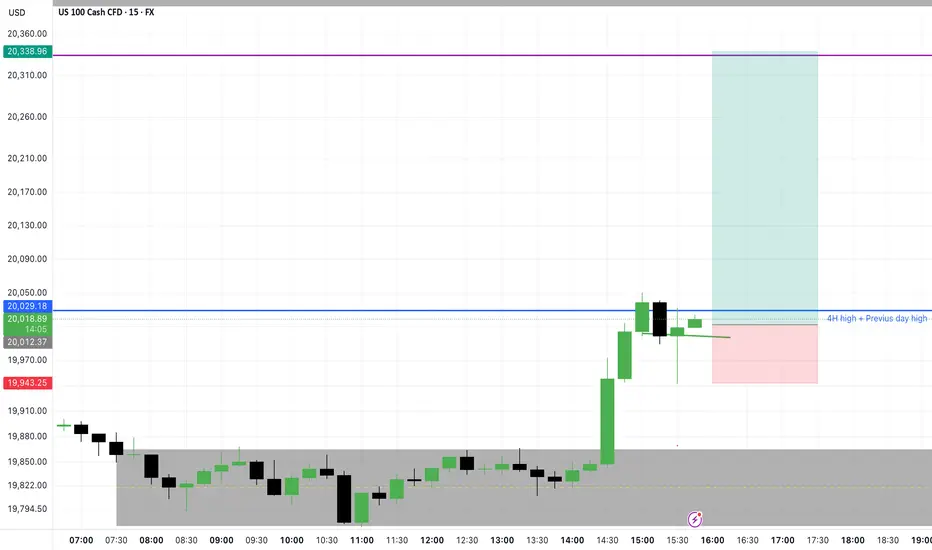
NAS100 LONG 1-8RR Trade ideiaNAS100 LONG 1-8RR Trade ideia. Trying this one now. Lets see. Always proper risk manegement.
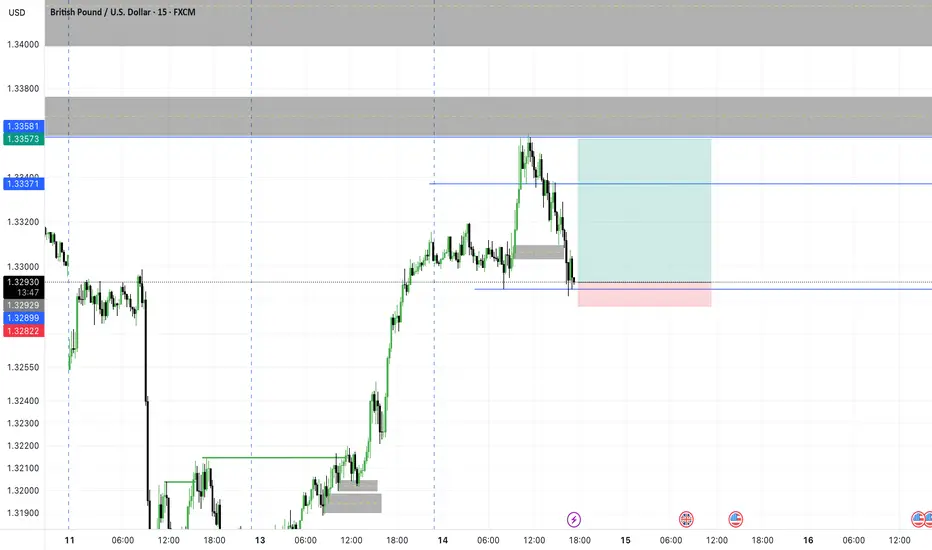
GBPUSD - POSSIBLE Sell Trade 1-7RRGBPUSD - POSSIBLE Sell Trade - Im looking for a possible sell opportunity on GU. Be careful and lets see

XAU/USD 14 May 2025 Intraday AnalysisHi everyone — thanks for stopping by.
I’m Amin, a London-based technical analyst-in-training, currently preparing for the CMT Level I exam (June 2025) and building towards a career as a Market Strategist/Analyst.
I post daily/weekly analysis using Smart Money Concepts (SMC) soon to be blended with CMT-aligned tools like RSI, Moving Averages, trend structure, and market phase models.
My Goal: To secure a strategist or analyst role in London.
Recent highlight: One of my TradingView ideas was featured by an editor.
If you're in the industry, a fellow learner, or hiring, feel free to reach out — I’m open to opportunities and connections.
Let’s keep growing and learning!
Amin.
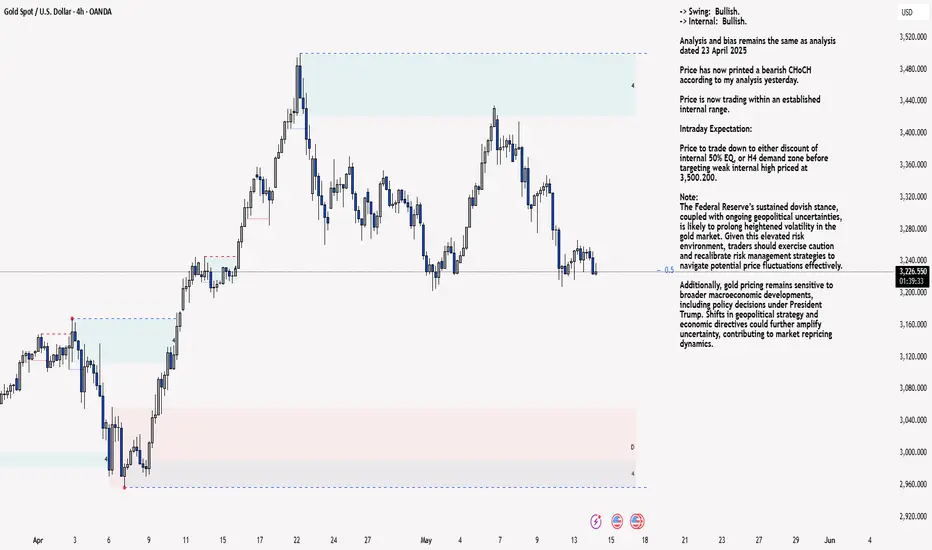
H4 Analysis:
-> Swing: Bullish.
-> Internal: Bullish.
Analysis and bias remains the same as analysis dated 23 April 2025
Price has now printed a bearish CHoCH according to my analysis yesterday.
Price is now trading within an established internal range.
Intraday Expectation:
Price to trade down to either discount of internal 50% EQ, or H4 demand zone before targeting weak internal high priced at 3,500.200.
Note:
The Federal Reserve’s sustained dovish stance, coupled with ongoing geopolitical uncertainties, is likely to prolong heightened volatility in the gold market. Given this elevated risk environment, traders should exercise caution and recalibrate risk management strategies to navigate potential price fluctuations effectively.
Additionally, gold pricing remains sensitive to broader macroeconomic developments, including policy decisions under President Trump. Shifts in geopolitical strategy and economic directives could further amplify uncertainty, contributing to market repricing dynamics.
H4 Chart:
M15 Analysis:
-> Swing: Bullish.
-> Internal: Bullish.
Analysis and bias remains remains the same as analysis dated 07 May 2025.
As mentioned in yesterday's analysis that I would continue to monitor price and depth of bearish pullback following previous bullish iBOS.
Price did not pull back with any significance, therefore, I will apply discretion and not mark the previous iBOS. I have however marked this in red.
Price continued bullish and subsequently printed a bearish iBOS to indicate, but not confirm bearish pullback phase initiation.
Price is now trading within an established internal range, however, I will continue to monitor depth of pullback.
Intraday Expectation:
Price to trade down to either discount of internal 50% EQ, or M15 supply zones before targeting weak internal high priced at 3,435.055
Note:
Gold remains highly volatile amid the Federal Reserve's continued dovish stance and persistent geopolitical uncertainties. Traders should implement robust risk management strategies and remain vigilant, as price swings may become more pronounced in this elevated volatility environment.
Additionally, President Trump’s recent tariff announcements are expected to further amplify market turbulence, potentially triggering sharp price fluctuations and whipsaws.
M15 Chart:
Gold Price Analysis Major Pullback as Geopolitical Tensions Ease🔥 Gold Price Analysis: Major Pullback as Geopolitical Tensions Ease
Technical Analysis Overview:
Yesterday's sharp decline in gold prices suggests a temporary de-escalation in geopolitical tensions, particularly in terms of the ongoing conflicts and political uncertainties. The global situation seems to be calming down, which has had a significant impact on the market.
From a political and trade perspective, the current price trend seems to be rational, though nothing is set in stone. Key negotiations are still underway, and important agreements may still be signed. After the sharp fall, gold has found some recovery, especially as it returns to liquidity gaps to fill.
Current Viewpoint:
At this stage, I am still expecting a retracement in gold prices, which will present better selling opportunities. While yesterday’s outlook focused on selling, we successfully identified key levels for buying. Today, selling opportunities seem more favorable than buying.
We need a pullback to fill the FVG (Fair Value Gap) and yesterday’s gap, after which gold may undergo another significant adjustment. The political dynamics, along with potential delays in the Federal Reserve's interest rate cuts, could push gold back to $3000 per ounce. If this happens, the rise in gold prices would be easy to foresee.
Short-Term Strategy:
In the short term, we will continue following the market’s wave of corrections. Short positions may be more sustainable, and holding onto them could prove more beneficial in the current environment.
Key Levels to Watch:
Resistance Levels: 3264 – 3278 – 3307 – 3328
Support Levels: 3241 – 3207 – 3196 – 3172 – 3156
Buy Opportunities:
Scalp Buy Zone: 3196 – 3164
SL: 3190
TP: 3200 – 3204 – 3208 – 3212 – 3216 – 3220
Buy Zone: 3158 – 3156
SL: 3152
TP: 3162 – 3166 – 3170 – 3174 – 3178 – 3182 – 3190
Sell Opportunities:
Scalp Sell Zone: 3278 – 3280
SL: 3284
TP: 3274 – 3270 – 3266 – 3260 – 3250 – 3240
Sell Zone: 3328 – 3330
SL: 3334
TP: 3324 – 3320 – 3316 – 3312 – 3308 – 3300 – 3290 – 3280
Upcoming Key News:
In the US session, we are expecting the release of CPI data for this period. As this is a crucial data point for the month, traders should pay attention. Currently, there is not enough information to analyze the CPI in-depth, so I will update you on the developments at the end of the European session, as we head into the US market.
Important Notes:
Ensure that you manage risk effectively and stick to your TP/SL levels to safeguard your account. We are still in a volatile period, and as always, caution is key when navigating these types of market conditions.
Good Luck!

Mon 12th May 2025 GBP/AUD Daily Forex Chart Buy SetupGood morning fellow traders. On my Daily Forex charts using the High Probability & Divergence trading methods from my books, I have identified a new trade setup this morning. This trade being a GBP/AUD Buy. As usual, you can see the details of the trade/s on the chart. Keep in mind that I am generally looking to buy when the MACD is below the zero level & sell when it is above the zero level. The red/blue QMP Filter dots on the price chart produce the actual trade signal. I am also considering things like divergence, support/resistance, round numbers etc, and these will be marked up on the chart. Enjoy the day all. Cheers. Jim

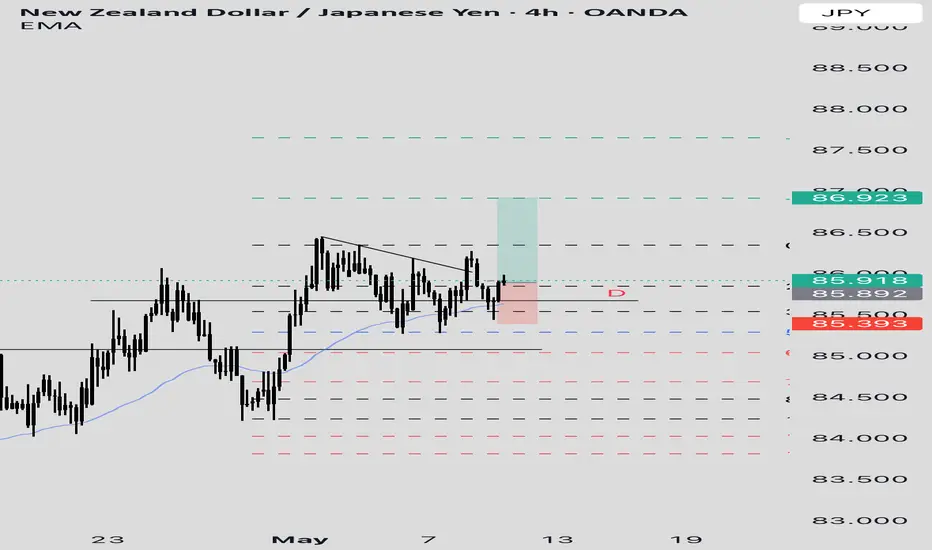
NZDJPY LONGHey everyone we looking for a long NZDJPY, we were having a uptrend for an quiet a while so this is what i see and why i will taking a buy
1) break and retest to daily support and reject few times
2) reject from a 50% Fib level
3) break our counter trend line on 4h which shows us buyer is taking over
4) shift from bearish to bullish market after break of structure on1h
5) reject Daily and 4h 50 EMA
6) engulfing bullish on 4h
Im aiming 1:2 risk to reward Ratio
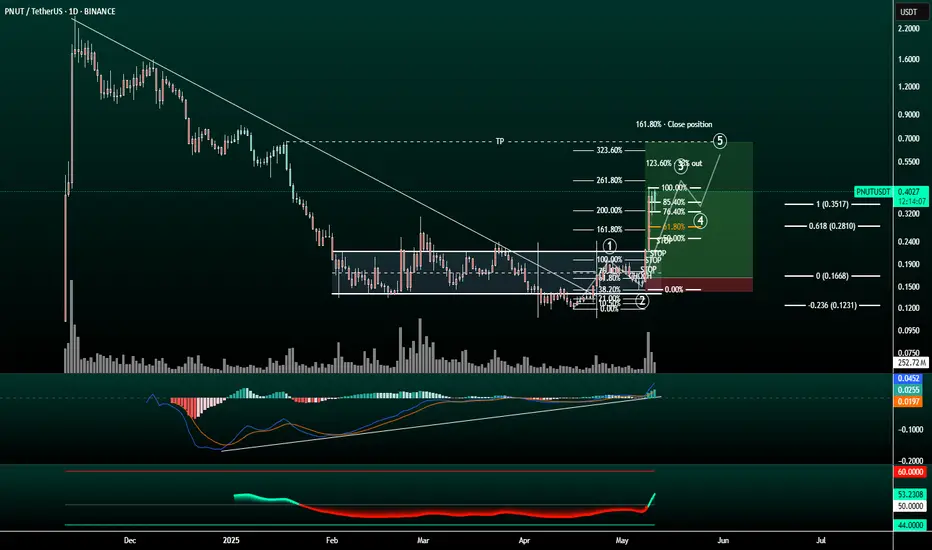
#SEIUSDT remains in bullish continuation mode📉 LONG BYBIT:SEIUSDT.P from $0.2747
🛡 Stop loss: $0.2640
🕒 Timeframe: 4H
✅ Market Overview:
➡️ Falling Wedge pattern has played out — confirmed breakout to the upside.
➡️ A strong Inverse Head and Shoulders pattern is visible — neckline broken with momentum.
➡️ Volume increases on upward impulse — bullish confirmation.
➡️ Current price is consolidating slightly — likely preparing for the next leg up.
➡️ POC at $0.1697 is far below — market structure flipped bullish.
➡️ Clear upward projection toward the $0.2810–$0.2910 range.
🎯 TP Targets:
💎 TP 1: $0.2810
💎 TP 2: $0.2870
💎 TP 3: $0.2910
📢 Holding above $0.2740 confirms bullish structure.
📢 Watch for minor resistance near TP1, then potential continuation to TP2 and TP3.
📢 Secure partial profits at TP1, and let the rest ride toward higher targets.
📢 It’s advisable to partially take profits near the specified resistance levels.
📢 A retest of the breakout zone (around $0.22) is possible — this can be used for adding to the position.
🚀 BYBIT:SEIUSDT.P remains in bullish continuation mode — targets still active!

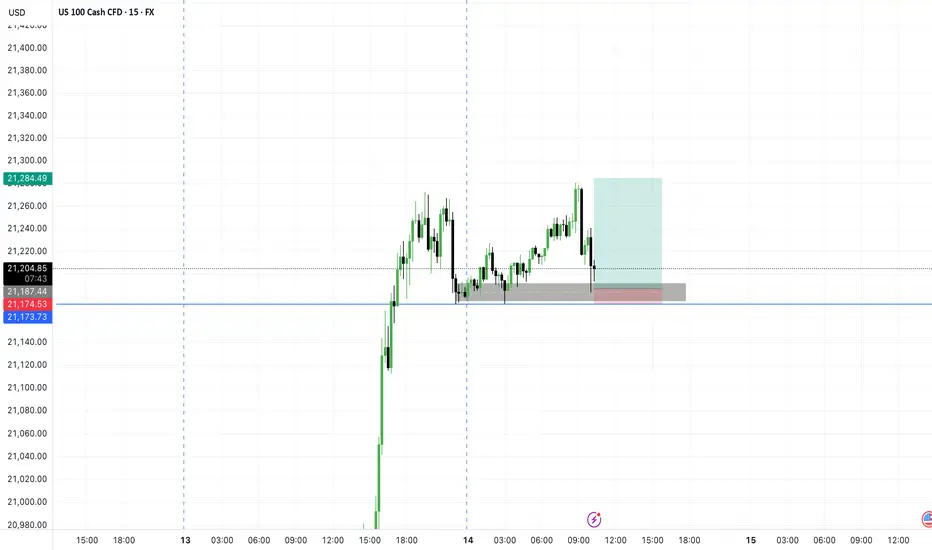
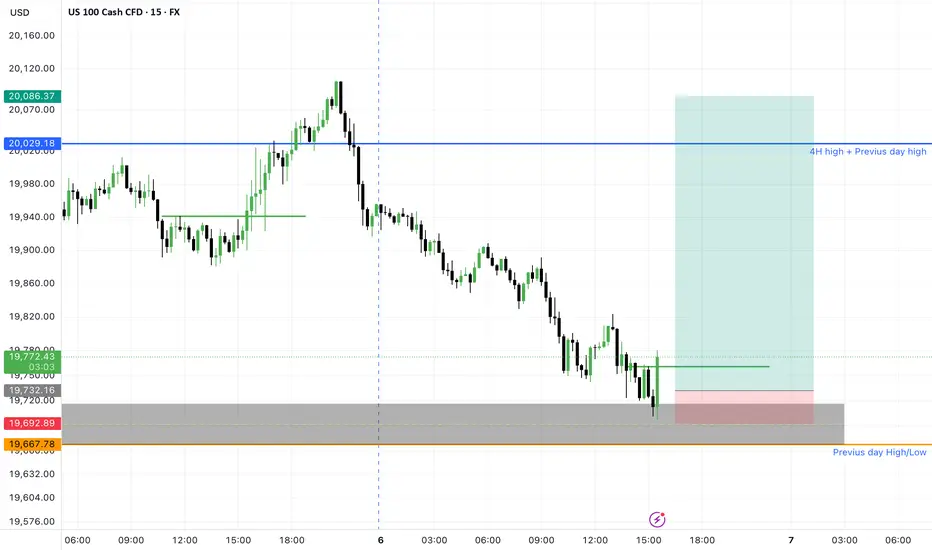
NAS100 BUY Trade ideia. 1-10RRNAS100 BUY Trade ideia. 1-10RR. After the TP hit from yesterday Im still expecting more bullish momentum so Im waiting to see if I can get this 1-10RR or at least 1-5RR from this. Remember we need confirmations to enter the trade. It has to brake structure in 5min before we enter.
Lets see

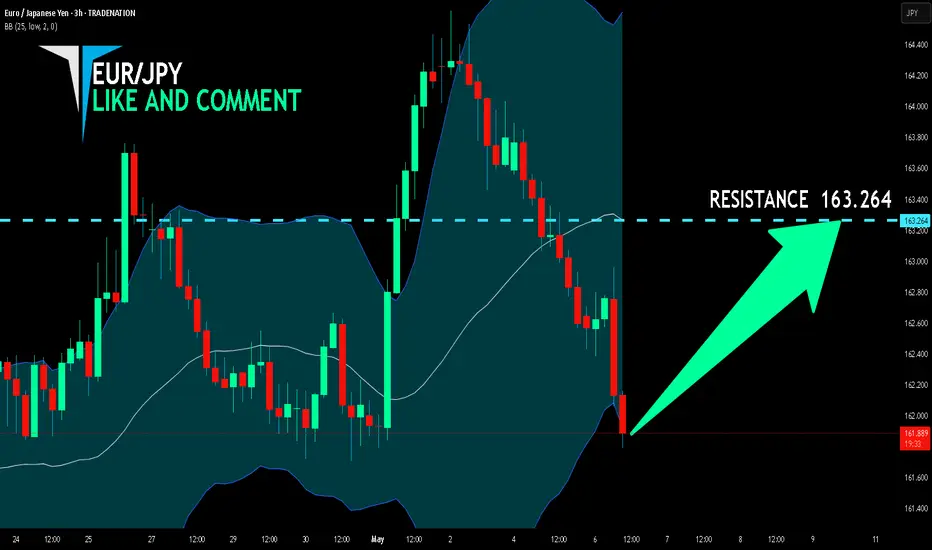
EUR/JPY LONG FROM SUPPORT
Hello, Friends!
EUR/JPY is making a bearish pullback on the 3H TF and is nearing the support line below while we are generally bullish biased on the pair due to our previous 1W candle analysis, thus making a trend-following long a good option for us with the target being the 163.264 level.
Disclosure: I am part of Trade Nation's Influencer program and receive a monthly fee for using their TradingView charts in my analysis.
✅LIKE AND COMMENT MY IDEAS✅
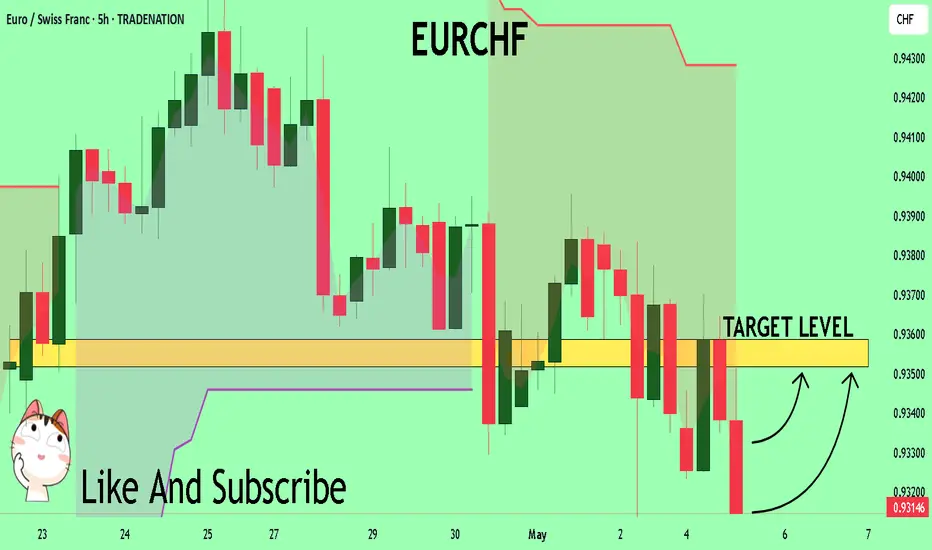
EURCHF Trading Opportunity! BUY!
My dear followers,
I analysed this chart on EURCHF and concluded the following:
The market is trading on 0.9315 pivot level.
Bias - Bullish
Technical Indicators: Both Super Trend & Pivot HL indicate a highly probable Bullish continuation.
Target - 0.9351
About Used Indicators:
A super-trend indicator is plotted on either above or below the closing price to signal a buy or sell. The indicator changes color, based on whether or not you should be buying. If the super-trend indicator moves below the closing price, the indicator turns green, and it signals an entry point or points to buy.
Disclosure: I am part of Trade Nation's Influencer program and receive a monthly fee for using their TradingView charts in my analysis.
———————————
WISH YOU ALL LUCK
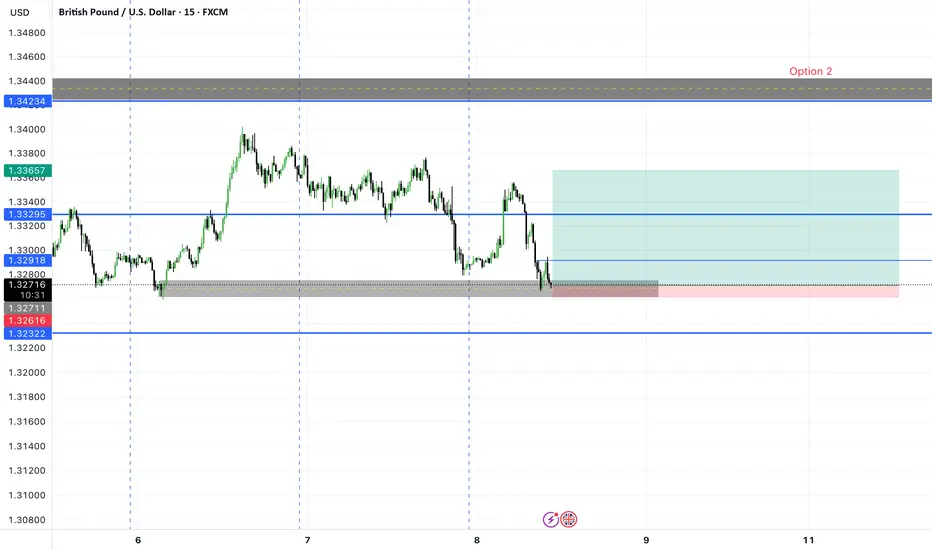
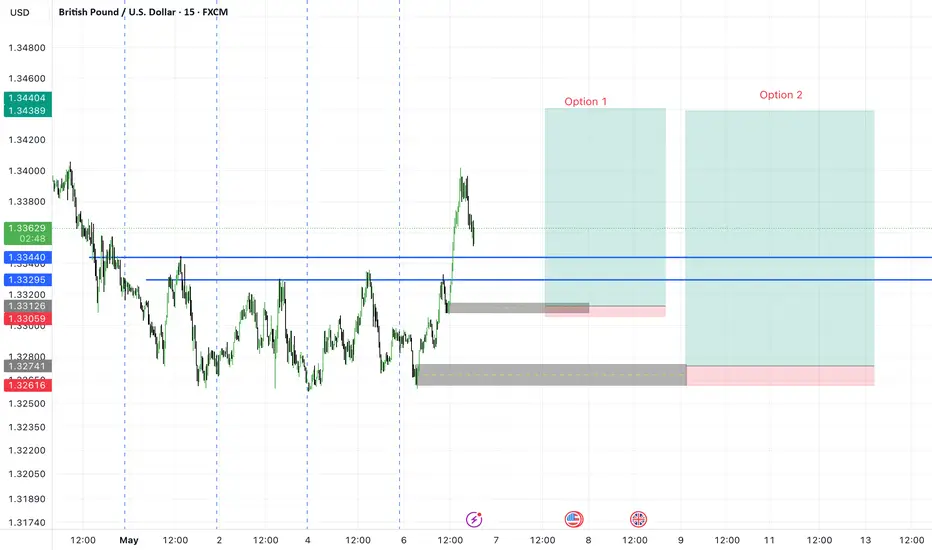
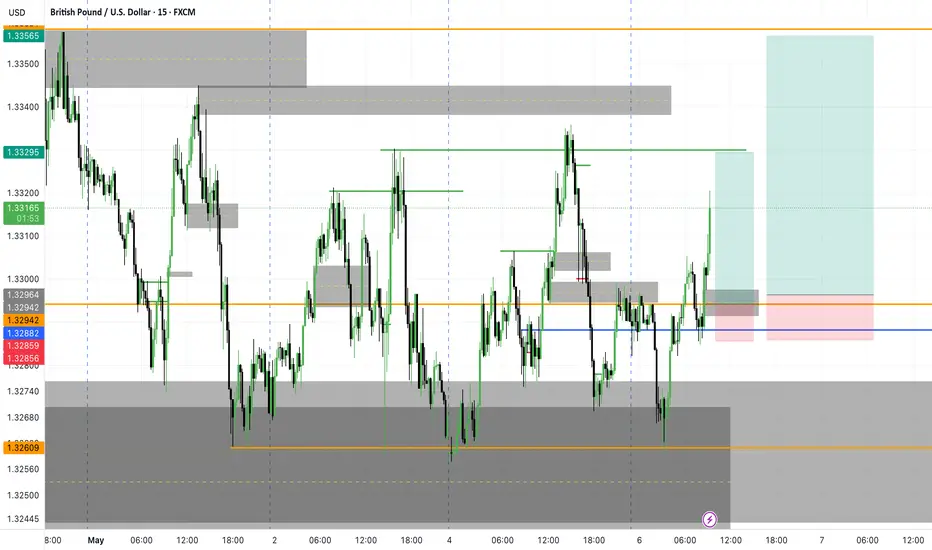
GBPUSD LONG- Two possible entry points.GBPUSD LONG- Two possible entry points. I belive this will be held tomorrow. In one of these possible entry pointsif we see a Switch of struckture in 5minutes we should buy. Lets see.
TSLA Eiffel Tower Not CompleteEiffel tower patterns are rare but very powerful TA structures when they develop.
They are very hard patterns to short since we can never know when the wave up ends. However, there is so much information we can extract from them during and after the collapse.
When they are rising and going vertical, and you happen to be in it. The benefits will be great! As the price action sucks in everyone all at once with virtually no sellers.
So, what info can we learn?
On the way up, when this is happening, you should have the ability to recognize it at some point without worrying if you got the top. Take your money and RUN!
Never try to get back in and try to chase it up!
Never try to short it, thinking it is too high, this is the top!
When it tops out, never buy the dip! Bc you know how this structure will end.
Never buy based on some silly FIB or bc it's down too much!
Never buy the base thinking it will go back to new all-time highs, and it is now safe to get back in bc it will only keep going lower, more through time, frustrating you until you puke it up.
So remember this gimmicky sound bite.
"If they don't scare you out, they will wear you out!"
Ain't nobody got time for that! Your money has a much better place to be allocated to make you money instead of being fixated on a chart like this.
The reason people get stuck is bc the move provoked emotion! Then, when they get involved thinking they will be Buffett tomorrow from this one trade, they will experience Euphoria, sadness, anger etc., further provoking even more emotions to the point they become obsessed! Guessing, waiting, hoping, doubling down on and on...
Ask me how I know! hahaha!
While I made a lot of money shorting GME, here is an example of an Eiffel tower with many, many people that have this trading disease I just spoke about.
In conclusion, anyone who believes that TSLA will hit $1,000 blah blah blah and suckered into buying it. You now know you are being honey dicked by a bunch of armatures and bots on X. Beyond TSLA there are many such charts out there tight now that have formed the beginnings of ET. As such, you should know how to recognize it quickly and avoid the pitfalls out there.FYI I called the Top on TSLA ))
Click Like, Follow, Subscribe to learn much more about real macroeconomics and technical analysis. Let me help you navigate these crazy markets.

NAS100 buy now more than 1-10RRNAS100 buy now more than 1-10RR. The Ideia I shared before is confirmed for me. Lets see
AUDNZD Bullish Trade Breakdown — 9.99R Return Using Harmonics +
Hello traders!
If you enjoyed my previous post on the XAUUSD buy setup, then you're going to love this breakdown on AUDNZD—especially if you're interested in combining Harmonic Patterns with Smart Money Concepts (SMC) for precise trade entries. If you haven’t seen the Gold analysis yet, be sure to check it out below this post.
Let’s dive into this AUDNZD trade:
🔹 Weekly Analysis
On the weekly timeframe, price was reacting strongly to a key support level, which was confirmed by a long rejection wick:
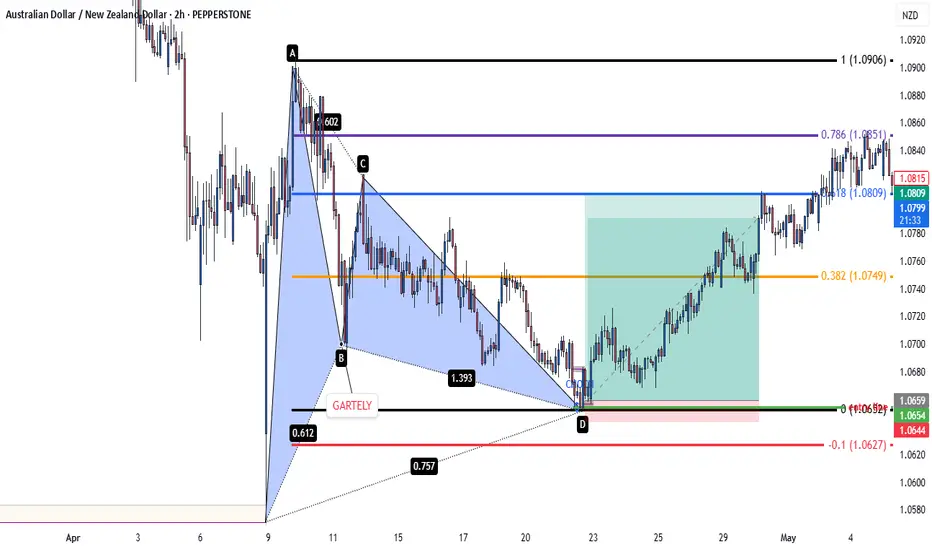
🔹 Harmonic Pattern Setup
I anticipated a retracement toward the 0.786/0.886 Fibonacci levels of the previous bullish impulsive move, with the expectation of forming a Bullish Harmonic Pattern. And that’s exactly how it played out:
🔹 Pattern: Bullish Gartley
The setup was a classic Bullish Gartley, with the PRZ (Potential Reversal Zone) aligning perfectly with the 0.786 level. Price tested this area and confirmed the setup:
🔹 Entry Strategy: SMC x Harmonics
Entry Model: S2D (Supply-to-Demand) Flip Entry
Confirmation: After a CHOCH (Change of Character) on the M15 timeframe
H1 Sniper Entry: Not tagged, but our setup remained valid
Stop Loss: A tight 15 pips, limiting potential loss if the market didn’t respect the analysis
🔹 Trade Outcome
The entry was triggered successfully, and the trade hit:
✅ TP1
✅ TP2
✅ TP3 (at the 0.786 retracement level)
📊 Result: +9.99R
That’s nearly 10R return on a single trade—an excellent example of how combining Harmonic Patterns with SMC execution models can yield high-probability setups and strong returns.
💬 What About You?
Did you catch this move on AUDNZD, or perhaps take a different approach?
Let me know in the comments below—I’d love to hear how you approached it.
And don’t forget to stay tuned for more in-depth trade breakdowns like this, where I blend Harmonics + SMC to find precision entries.
Thanks for reading, and happy trading! 🚀
Nas100 Long trade ideias. 2 possible Entry pointsNas100 Long trade ideias. 2 possible Entry points. Please wait for a brake of structure in 5min in one of these entry points. My favorite would be the lowest one but lets see.
Lets have a profitable week.

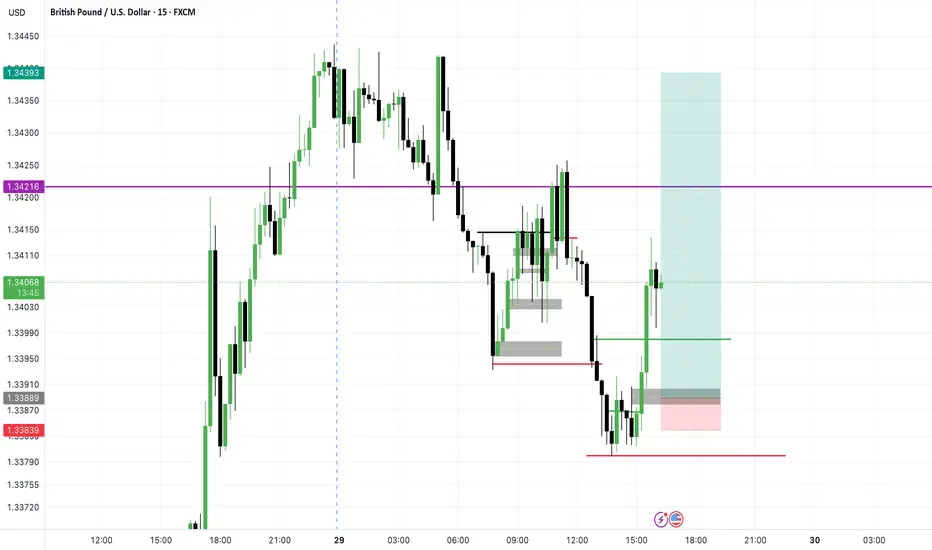
GBPUSD LOND Trade ideiaGBPUSD LOND Trade ideia - Im hoping to have a pull back to my entry zone. We might not even have this chance but I prefer to not chase price now. If I lose this move its ok. Lets see.
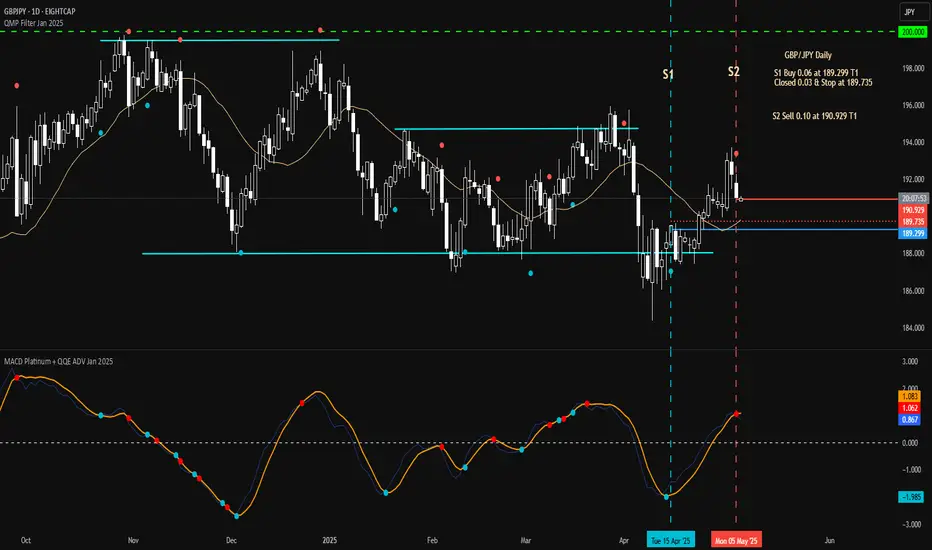
Tue 6th May 2025 GBP/JPY Daily Forex Chart Sell SetupGood morning fellow traders. On my Daily Forex charts using the High Probability & Divergence trading methods from my books, I have identified a new trade setup this morning. As usual, you can read my notes on the chart for my thoughts on this setup. The trade being a GBP/JPY Sell. Enjoy the day all. Cheers. Jim
GU Re-enter for LONGS. GU Re-enter for LONGS. AFter being stopped in BE Im entering again to this Long trade ideia. I believe we still bullish at this pair. Lets see. Please if ypu take it, put brake even after 1-1RR.
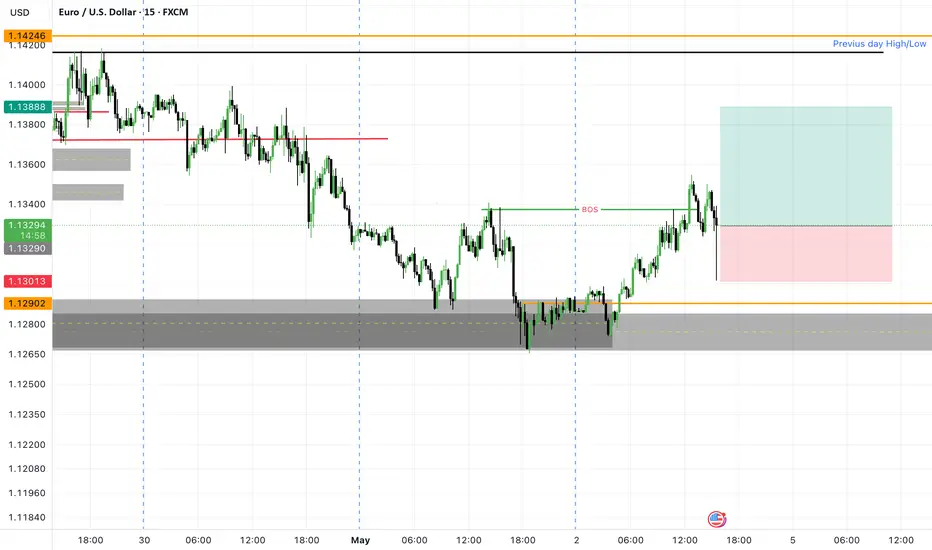
EURUSD LONG TRADE IDEIAEURUSD LONG - trade ideia. 1-3RR small pull back trade ideia. Expecting more move in this direction next week.
NAS100 BUY Trade ideiaNAS100 Long move trade ideia. Expecting to see trade reach this target.
Please move SL to BE once it hits 1-1RR.