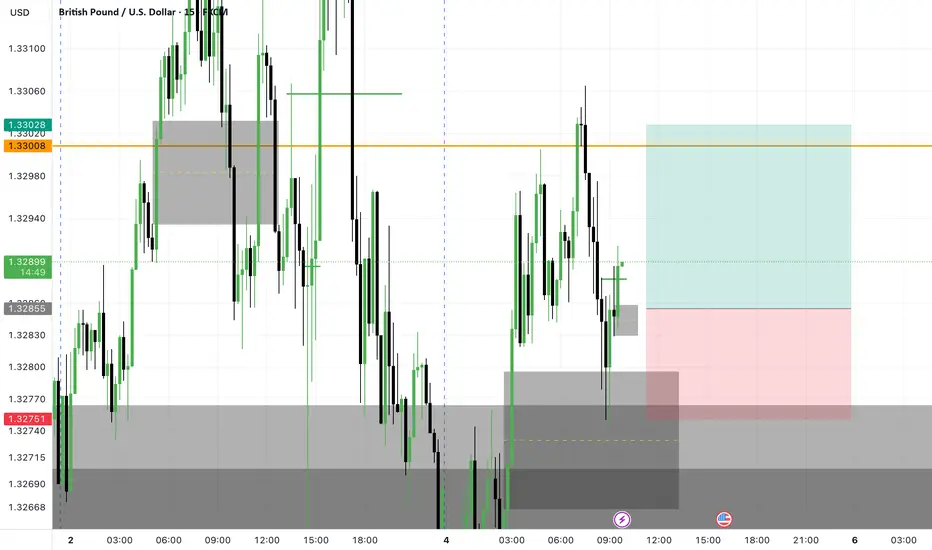
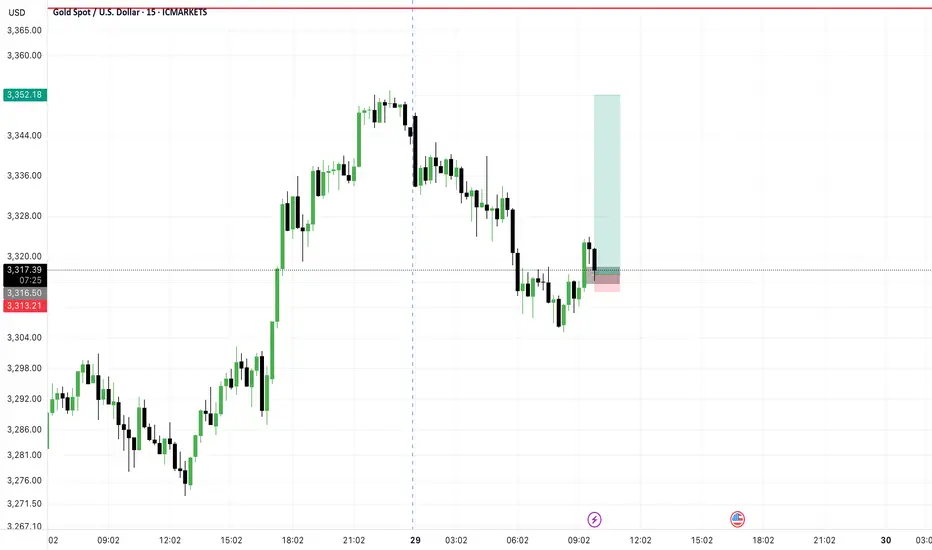
GU SCAPL LONG Trade ideiaGU SCAPL LONG Trade ideia. just a starter 1-1RR. Its a small one I even expect more move bullish but as its monday lets go slowly..
Techincalanalysis
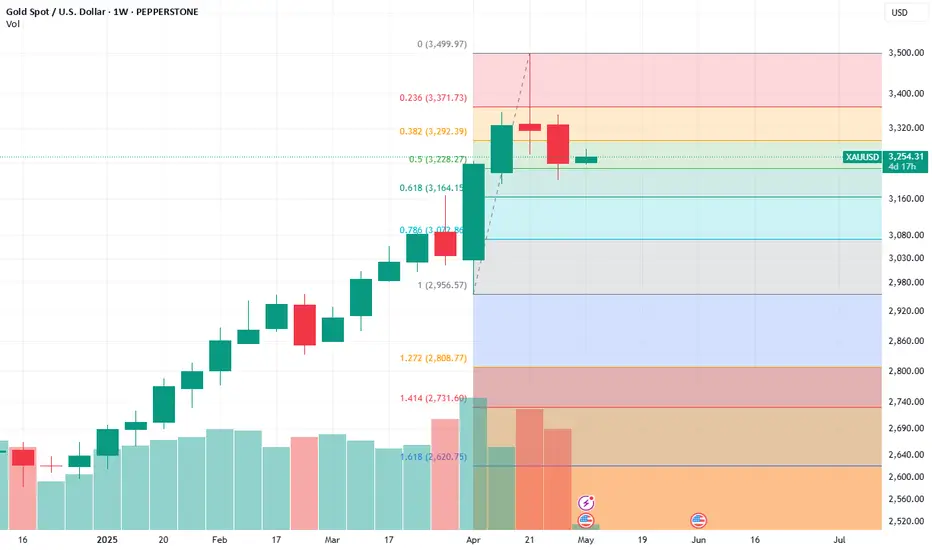
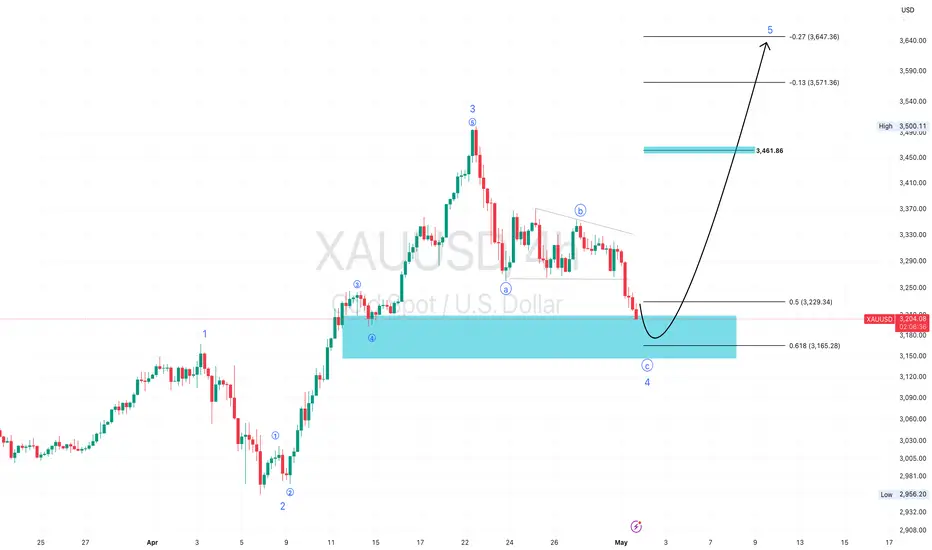
XAUUSD is still in an Up TrendDespite being an Up Trend, XAUUSD still has a possibility to drop down to the 62% retracement line.
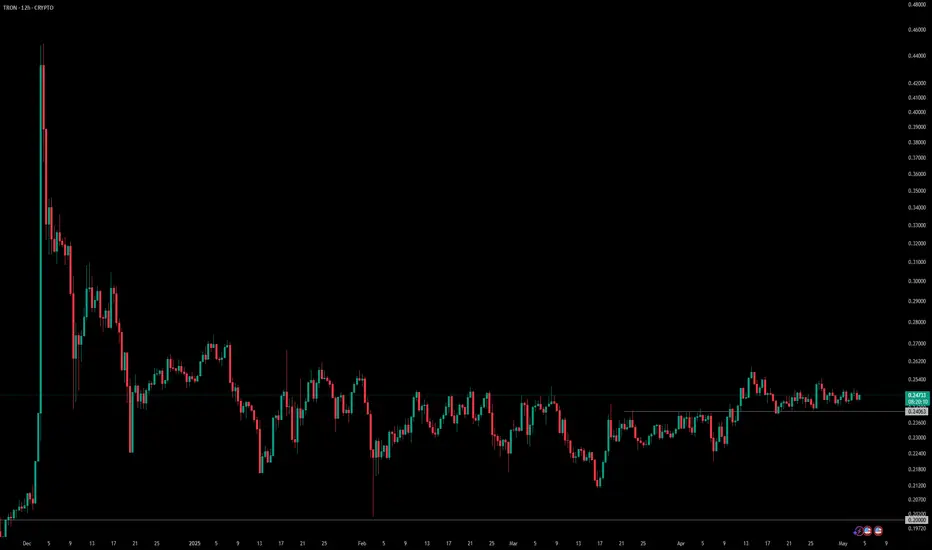
TRX Poised for Breakout After Weeks of CompressionTRX has been consolidating in a tight range between 0.24 and 0.26 for several weeks, showing signs of strength in a weak market. Price action has been orderly, with higher lows tightening into flat resistance — a textbook buildup.
This kind of compression often leads to sharp directional movement, especially when paired with low volatility and reduced attention. Volume remains muted, but any breakout with conviction above 0.26 could spark a strong trend continuation
Invalidation: Breakdown of support or rejection with high sell volume near 0.26.
Watching closely. No need to predict — just react.
#TRX #Crypto #BreakoutSetup #Altcoins #TradingViewIdeas
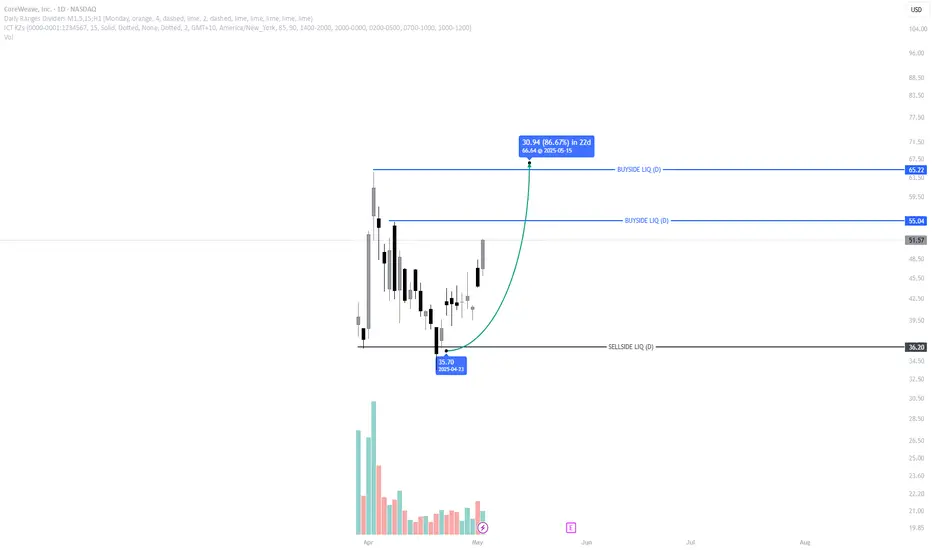
This AI-Backed IPO Is Just Warming Up — Next Stop: 86% Gains?CoreWeave is showing classic IPO 'honeymoon phase' price action, with early liquidity swept and bullish structure forming.
🔍 Price swept the daily sell-side liquidity at $35.70
📈 Now pushing higher — next major buyside targets at $55.04 and $65.22
🤖 Backed by NVIDIA, adding serious momentum and credibility
🧠 Expecting strong continuation as institutions begin to build exposure
If price maintains structure, this could be one of the strongest IPO moves of 2025.
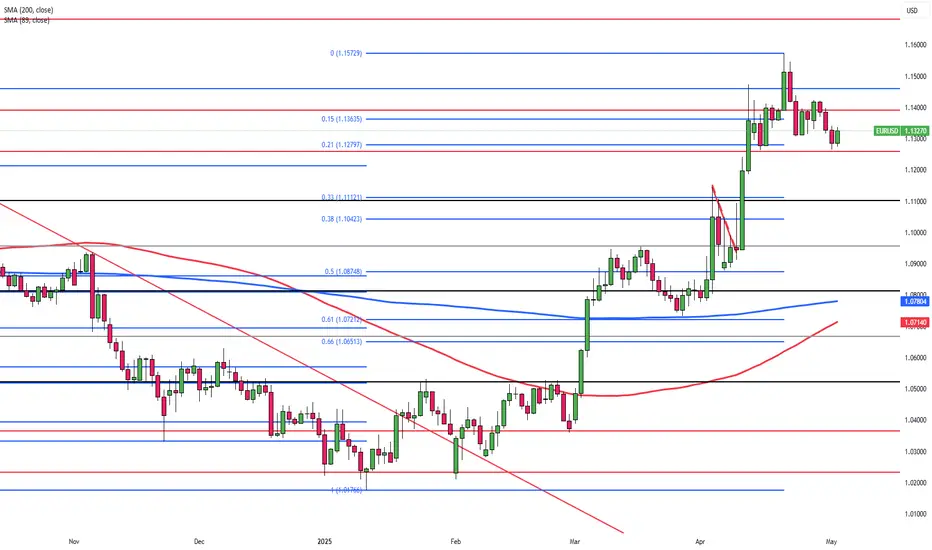
Euro Slips to $1.13 After Strong AprilThe euro dipped toward $1.13 on May 1 after a 5% April gain, as the dollar found support in Trump’s optimism about trade deals with India, Japan, South Korea, and China. Markets awaited Friday’s U.S. jobs data for Fed policy clues. The U.S. economy shrank 0.3% in Q1, partly due to import spikes ahead of expected tariffs. Meanwhile, the Eurozone grew 0.4%, driven by strong domestic demand. German inflation eased to 2.1%, though core rose slightly, while France’s annual rate held at 0.8%.
Resistance levels are seen at 1.1460, then 1.1580 and 1.1680, while support rests at 1.1260, followed by 1.1200 and 1.1150.
HDFC Life Insurance – Bullish Breakout on Monthly ChartHDFCLIFE is forming a strong ascending triangle on the monthly chart, signaling long-term bullish potential. A breakout above ₹750 with volume can trigger a fresh rally toward ₹880–₹920 in the coming months. RSI is trending up with strong momentum, which confirms buying interest. In the short term, ₹715 acts as support. Long-term investors can accumulate on dips.
Short-Term View: Buy on dips above ₹715 | Target ₹780
Long-Term View: Breakout above ₹750 | Target ₹900+
For educational purposes only

GOLD 05/01/2025Scenario GOLD TF H4
- Stick to your stop loss to protect your trades
- Manage your positions patiently until you hit the target
- Profit always in risk, take the risk or lose the chance
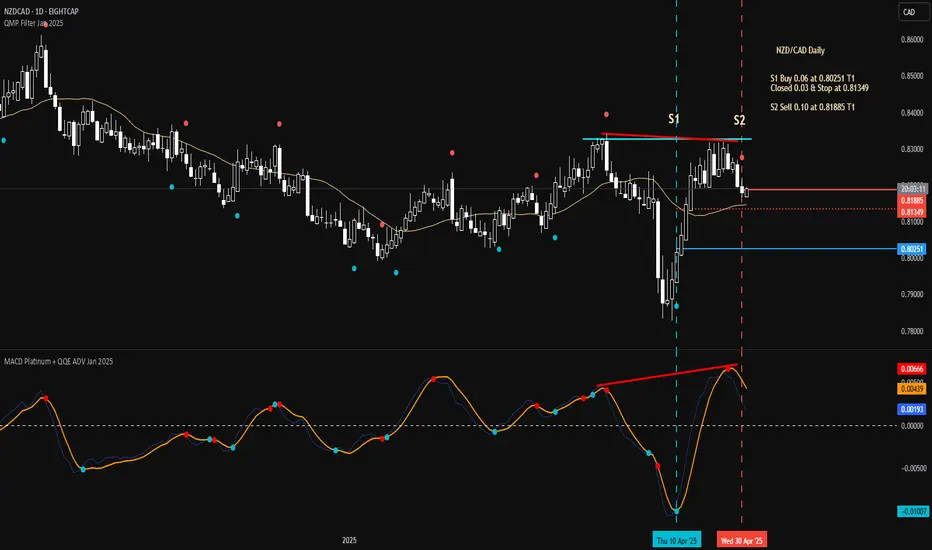
Thu 1st May 2025 NZD/CAD Daily Forex Chart Sell SetupGood morning fellow traders. On my Daily Forex charts using the High Probability & Divergence trading methods from my books, I have identified a new trade setup this morning. As usual, you can read my notes on the chart for my thoughts on this setup. The trade being a NZD/CAD Sell. Enjoy the day all. Cheers. Jim
XAUSUD LONG 1-10RRXAUSUD LONG 1-10RR. Look a this beautiful trade Im expecting for Gold. Lets see if we get those 10 . Have a great trading day.
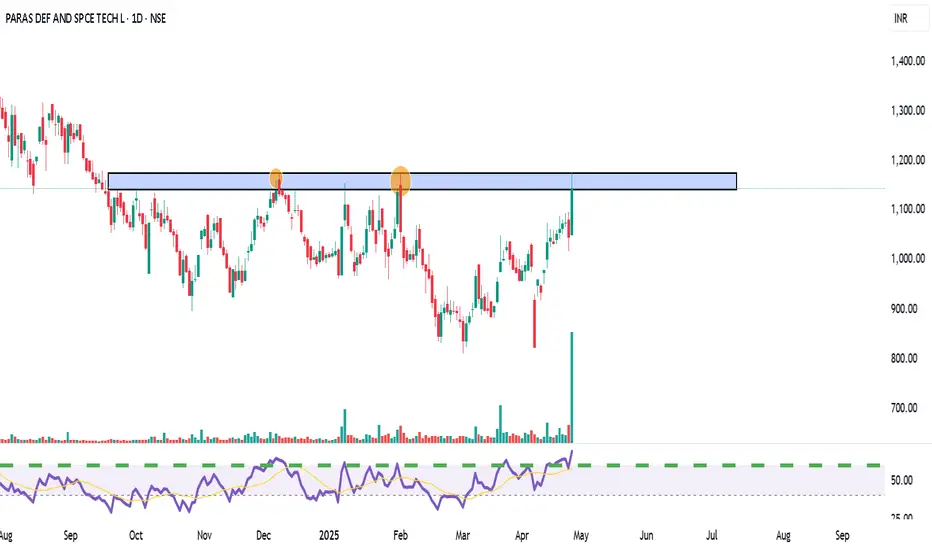
Equity Research Update – Paras Defence and Space Technologies CMP: ₹1,143 | Upside Potential: High
Paras Defence has broken out of a strong resistance zone (~₹1,120–₹1,160), confirmed by significant volume and bullish momentum. The RSI shows strength above 70, indicating buyer dominance. Historical resistance, marked by previous rejections, may now act as strong support. If sustained, this breakout could lead to a fresh uptrend. Investors may consider accumulating on dips with a medium-term target of ₹1,300–₹1,350, keeping a stop-loss below ₹1,080.
Recommendation: BUY on Breakout Confirmation
For Education Purpose only
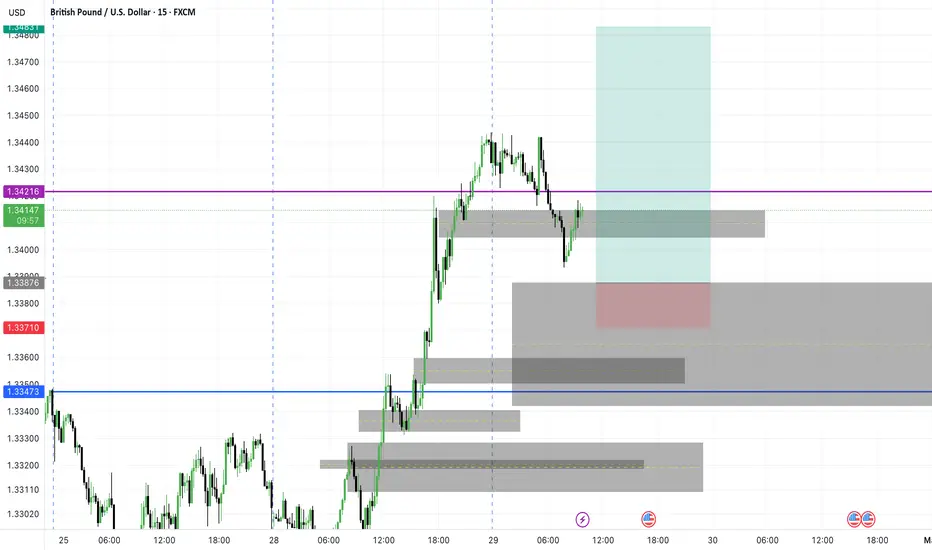
GU LONG TRADE Ideia. GBPUSD LONG Trade ideia. Im quiet confused about where to spot my entry. Will be monitoring but Ill be expecting longs these days. 1-6RR
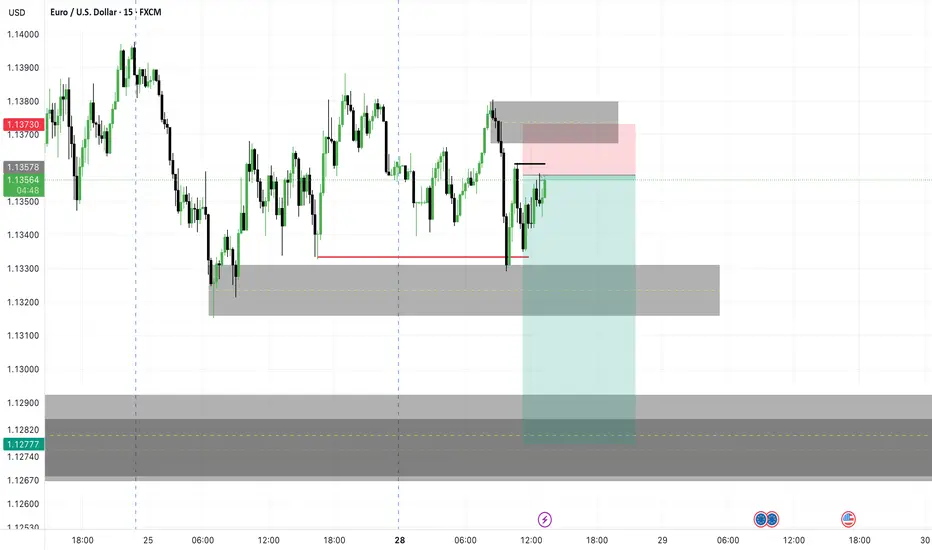
EU LONG TRADE IDEIA. Expecting a bullish week. Lets seeEU LONG TRADE IDEIA. Expecting a bullish week. Lets see. 1-6RR

USOIL 2025/04/29Scenario USOIL TF H4
- Stick to your stop loss to protect your trades
- Manage your positions patiently until you hit the target
- Profit always in risk, take the risk or lose the chance

KFin Technologies LtdCompany Snapshot:
Sector: Financial Services (Mutual Fund Services, RTA)
Market Cap: ₹21,000 Cr
Current Price: ₹1,239.20
Debt-to-Equity: 0.06 (very low)
ROE: 39% | ROCE: 49%
Financial Highlights:
Revenue Growth (3Y CAGR): ~22%
Profit Growth (3Y CAGR): ~32%
EBITDA Margin: ~48%
P/E Ratio: ~35x (TTM)
Industry Avg P/E: ~30-32x
Recent Price Action:
Stock broke out sharply in April 2025.
Support: ₹1,180 | Resistance: ₹1,300
RSI near 70 (mildly overbought, but momentum strong).
Key Strengths:
Dominant RTA player with 70%+ MF asset share.
Consistent cash flows and expanding international footprint.
High operating leverage driving margin expansion.
Key Risks:
Regulatory changes (SEBI reforms) could pressure fees.
High client concentration risk with top AMCs.
Valuation & Recommendation:
DCF Estimated Fair Value: ₹1,280–₹1,350
Recommendation: BUY on Dips / Accumulate
12-month Target Price: ₹1,320
Investment Horizon: 1–2 years
📈 Verdict: Strong business fundamentals, steady growth, and low debt make KFin Technologies attractive for long-term investors. Minor corrections can offer better entry points.
For Education Purposes only

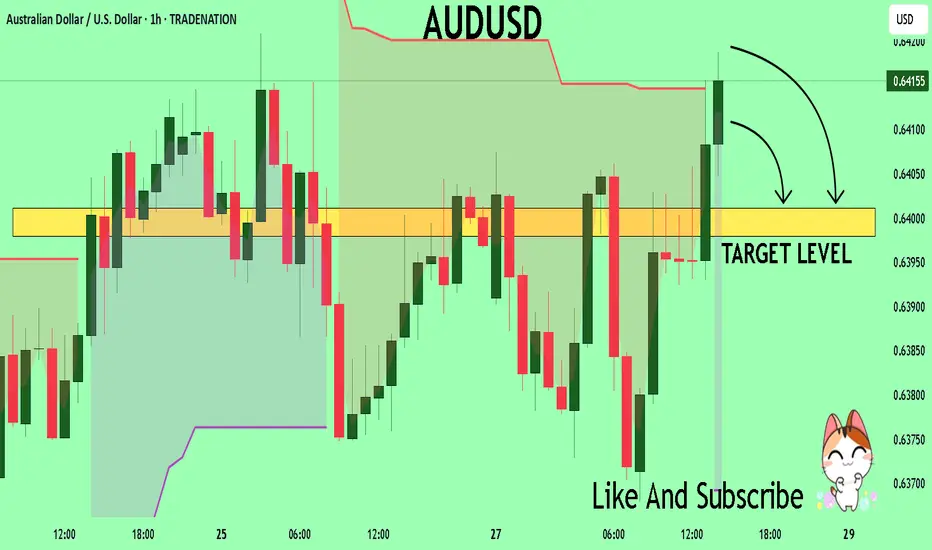
AUDUSD A Fall Expected! SELL!
My dear subscribers,
My technical analysis for AUDUSD is below:
The price is coiling around a solid key level - 0.6418
Bias - Bearish
Technical Indicators: Pivot Points High anticipates a potential price reversal.
Super trend shows a clear sell, giving a perfect indicators' convergence.
Goal - 0.6412
About Used Indicators:
By the very nature of the supertrend indicator, it offers firm support and resistance levels for traders to enter and exit trades. Additionally, it also provides signals for setting stop losses
Disclosure: I am part of Trade Nation's Influencer program and receive a monthly fee for using their TradingView charts in my analysis.
———————————
WISH YOU ALL LUCK
EURUSD SHORT- SMALL Trade ideia. 1-5RREURUSD SHORT- SMALL Trade ideia - Iam taking this small sell with 1-5 RR. Starting with half risk because it might still go high and if that happens I will take a second entry and rise a little bit the stop loss. Lets see.
Wish u a very good week ahead.
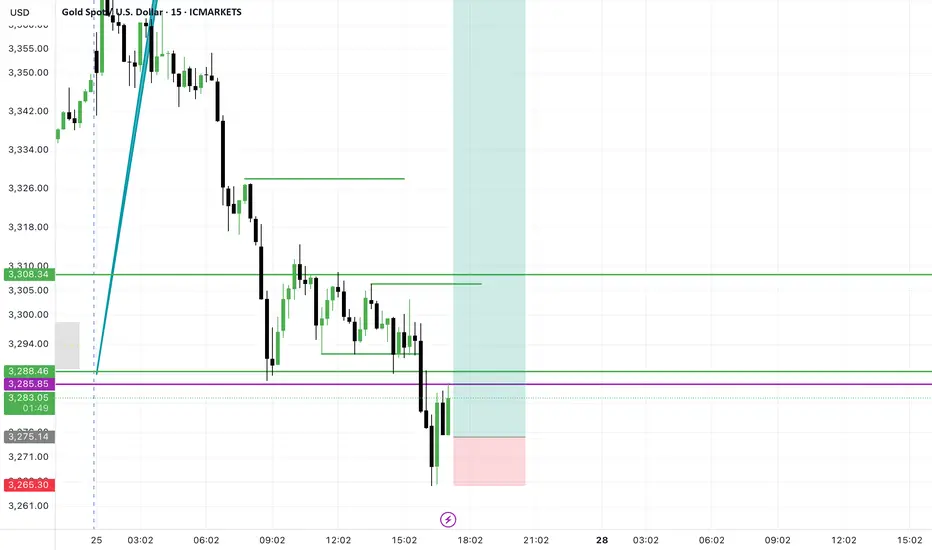
XAUUSD LONGIm trying again this long trade ideia. Stopped out once but Im still confident about this one. 1-10RR. Lets see. Proper risk management always.
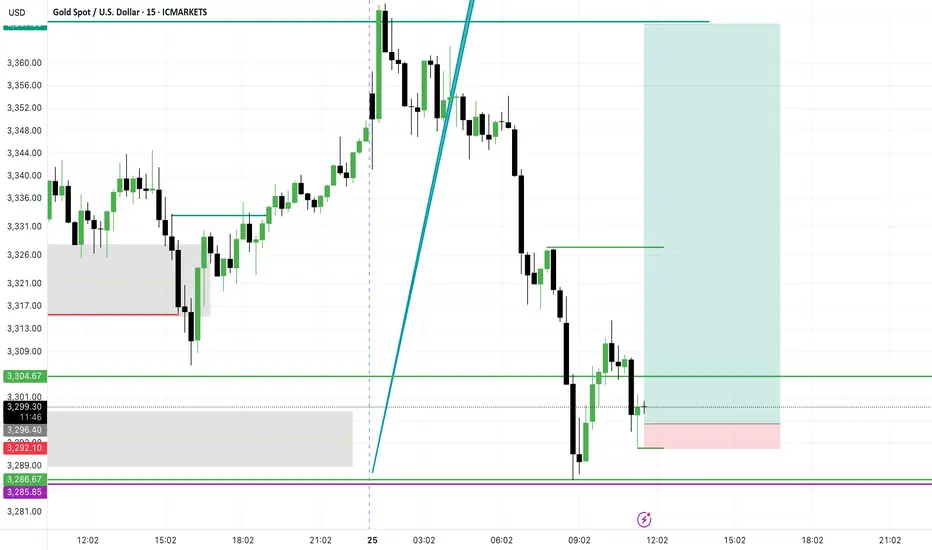
XAUUSD - LONG 1-16RR TRADE IDEIA XAUUSD - LONG 1-16RR TRADE IDEIA - Risky trade. better use small risk if u wanna take it. might be very well profitable.
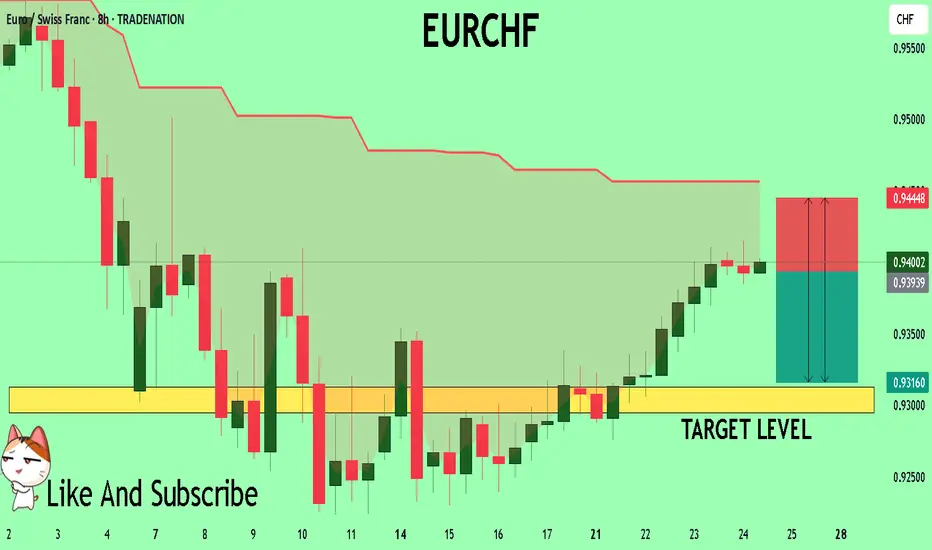
EURCHF A Fall Expected! SELL!
My dear followers,
I analysed this chart on EURCHF and concluded the following:
The market is trading on 0.9396 pivot level.
Bias - Bearish
Technical Indicators: Both Super Trend & Pivot HL indicate a highly probable Bearish continuation.
Target - 0.9312
Safe Stop Loss - 0.9444
About Used Indicators:
A super-trend indicator is plotted on either above or below the closing price to signal a buy or sell. The indicator changes color, based on whether or not you should be buying. If the super-trend indicator moves below the closing price, the indicator turns green, and it signals an entry point or points to buy.
Disclosure: I am part of Trade Nation's Influencer program and receive a monthly fee for using their TradingView charts in my analysis.
———————————
WISH YOU ALL LUCK
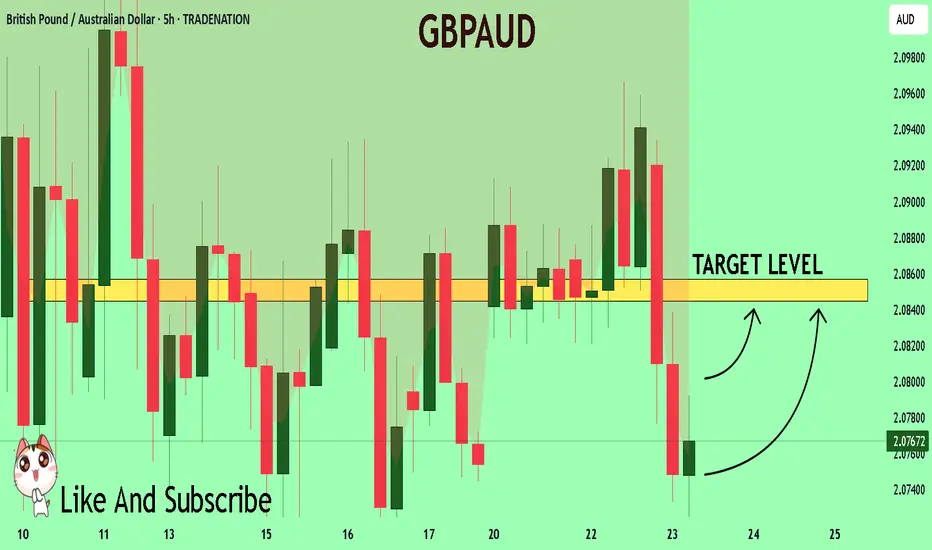
GBPAUD Will Explode! BUY!
My dear friends,
Please, find my technical outlook for GBPAUD below:
The instrument tests an important psychological level 2.0776
Bias - Bullish
Technical Indicators: Supper Trend gives a precise Bullish signal, while Pivot Point HL predicts price changes and potential reversals in the market.
Target - 2.0844
About Used Indicators:
Super-trend indicator is more useful in trending markets where there are clear uptrends and downtrends in price.
Disclosure: I am part of Trade Nation's Influencer program and receive a monthly fee for using their TradingView charts in my analysis.
———————————
WISH YOU ALL LUCK
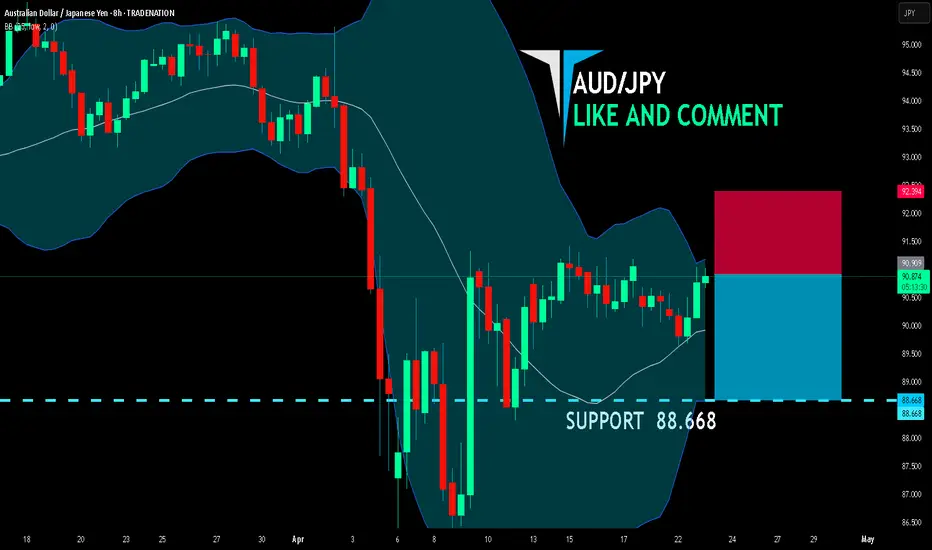
AUD/JPY BEARS ARE GAINING STRENGTH|SHORT
AUD/JPY SIGNAL
Trade Direction: short
Entry Level: 90.909
Target Level: 88.668
Stop Loss: 92.394
RISK PROFILE
Risk level: medium
Suggested risk: 1%
Timeframe: 8h
Disclosure: I am part of Trade Nation's Influencer program and receive a monthly fee for using their TradingView charts in my analysis.
✅LIKE AND COMMENT MY IDEAS✅
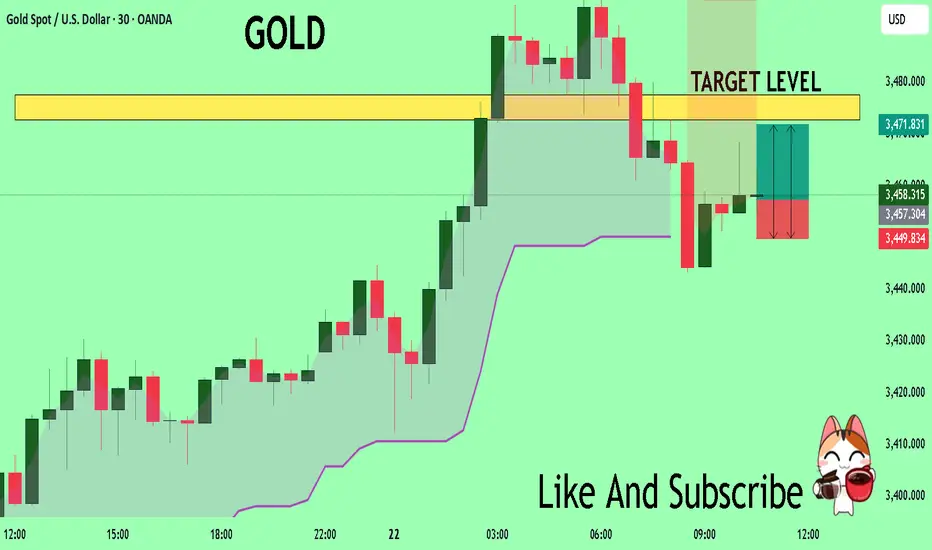
GOLD Technical Analysis! BUY!
My dear subscribers,
GOLD looks like it will make a good move, and here are the details:
The market is trading on 3457.8 pivot level.
Bias - Bullish
My Stop Loss - 3449.8
Technical Indicators: Both Super Trend & Pivot HL indicate a highly probable Bullish continuation.
Target - 3472.7
About Used Indicators:
The average true range (ATR) plays an important role in 'Supertrend' as the indicator uses ATR to calculate its value. The ATR indicator signals the degree of price volatility.
Disclosure: I am part of Trade Nation's Influencer program and receive a monthly fee for using their TradingView charts in my analysis.
———————————
WISH YOU ALL LUCK
FET/USDT - Trendline Breakout (22.04.2025)The FET/USDT Pair on the M30 timeframe presents a Potential Selling Opportunity due to a recent Formation of a Breakout Pattern. This suggests a shift in momentum towards the downside in the coming hours.
Possible Short Trade:
Entry: Consider Entering A Short Position around Trendline Of The Pattern.
Target Levels:
1st Support – 0.553
2nd Support – 0.516
🎁 Please hit the like button and
🎁 Leave a comment to support for My Post !
Your likes and comments are incredibly motivating and will encourage me to share more analysis with you.
Best Regards, KABHI_TA_TRADING
Thank you.
