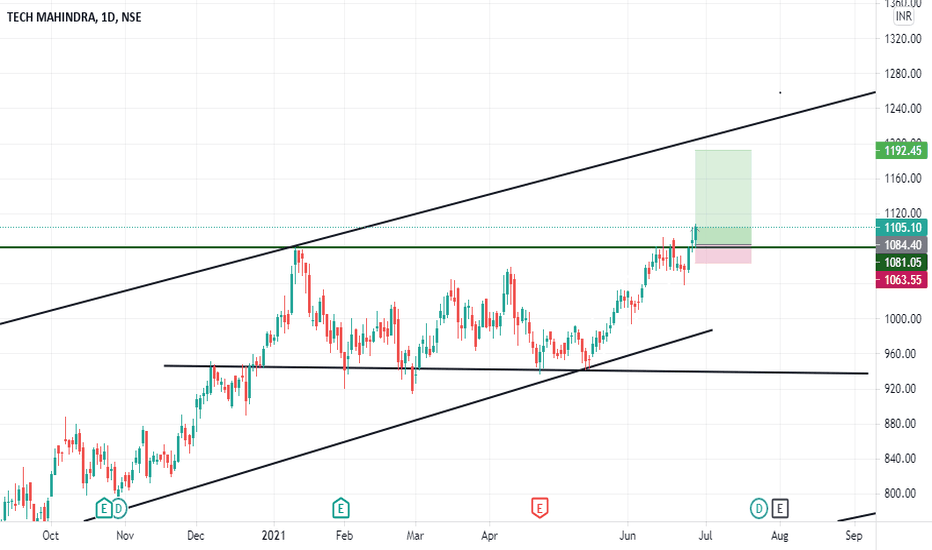
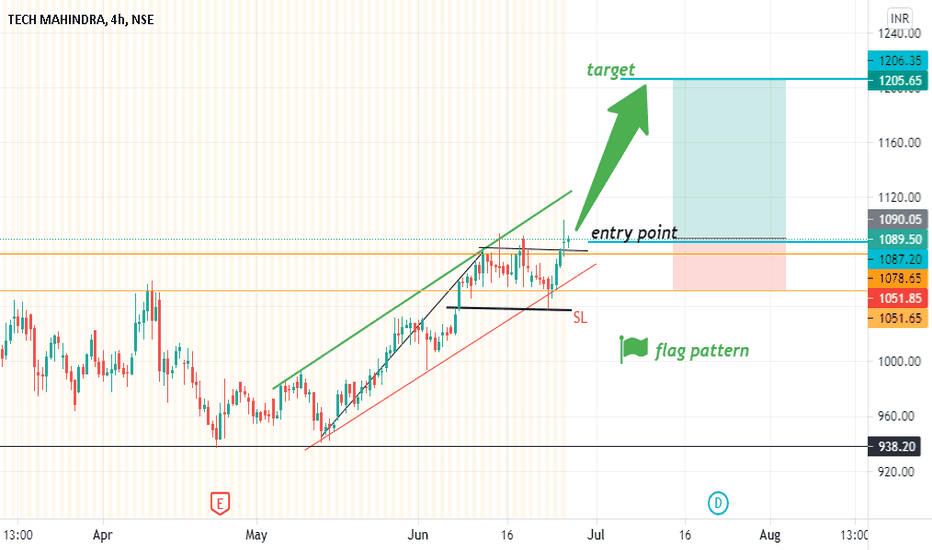
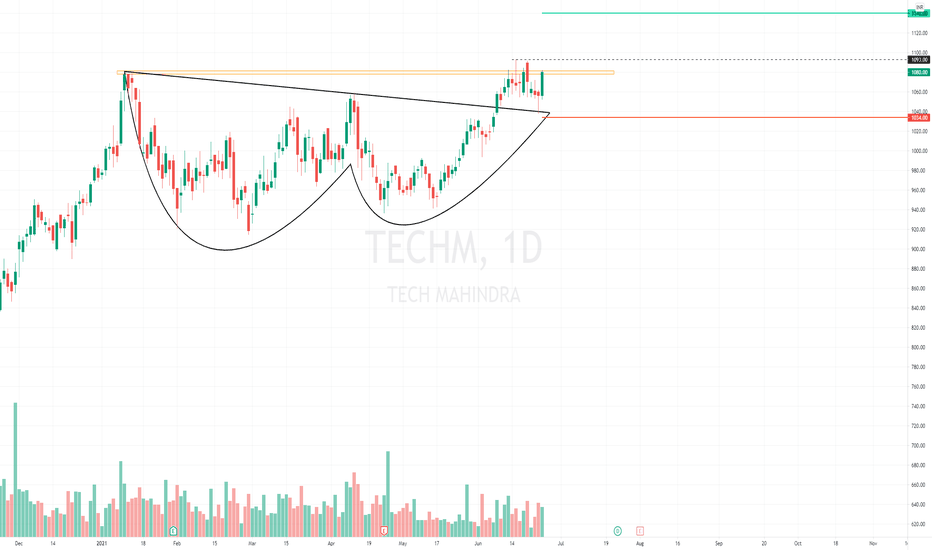
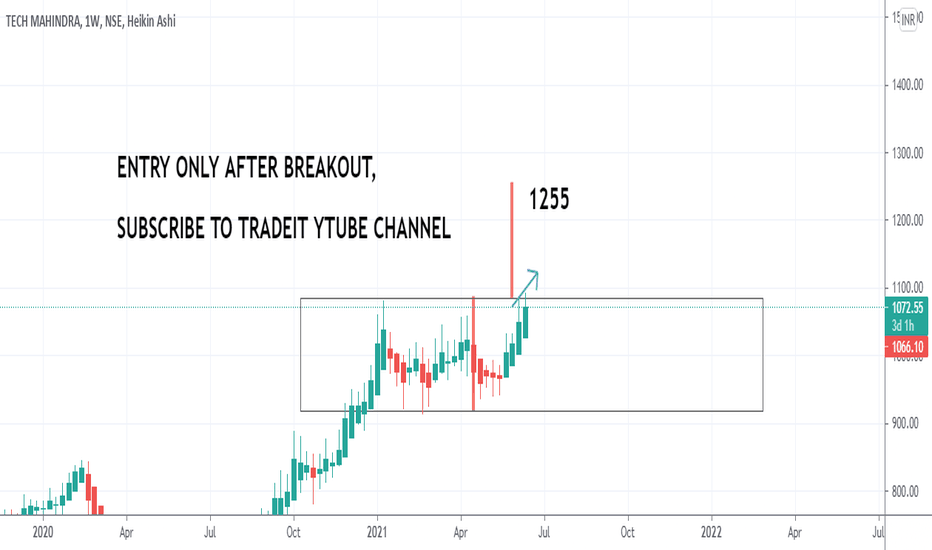
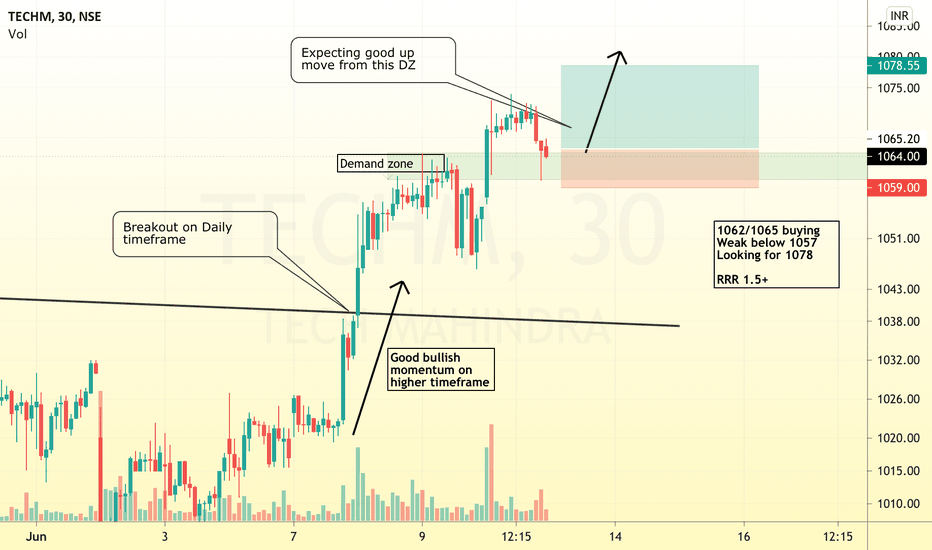
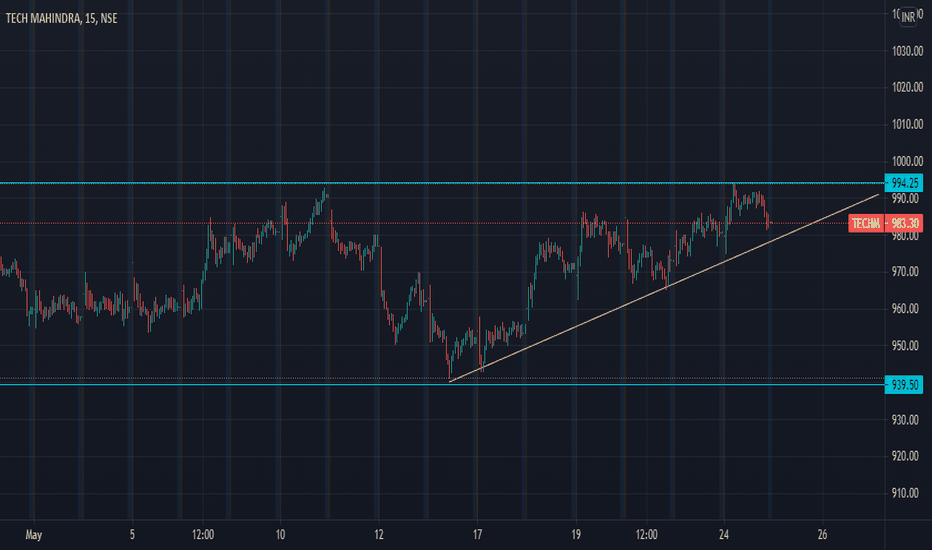
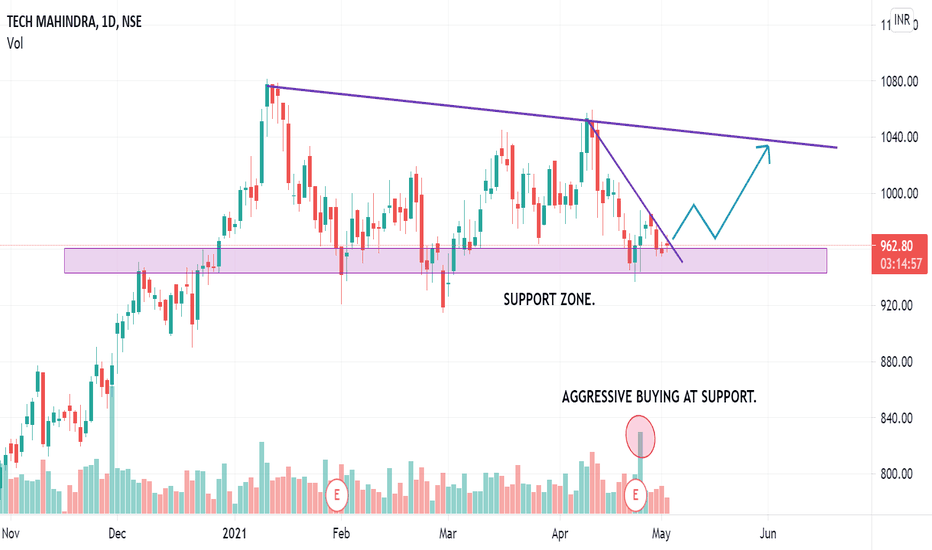
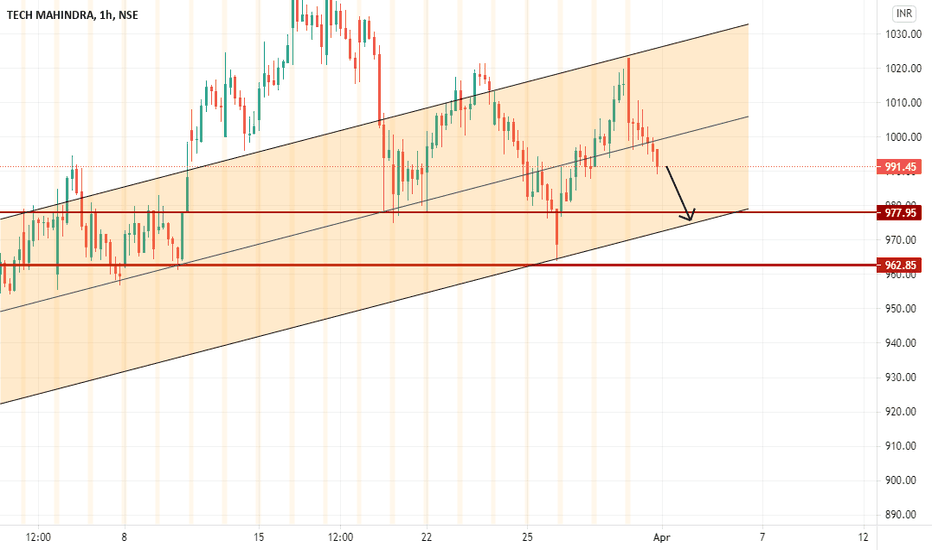
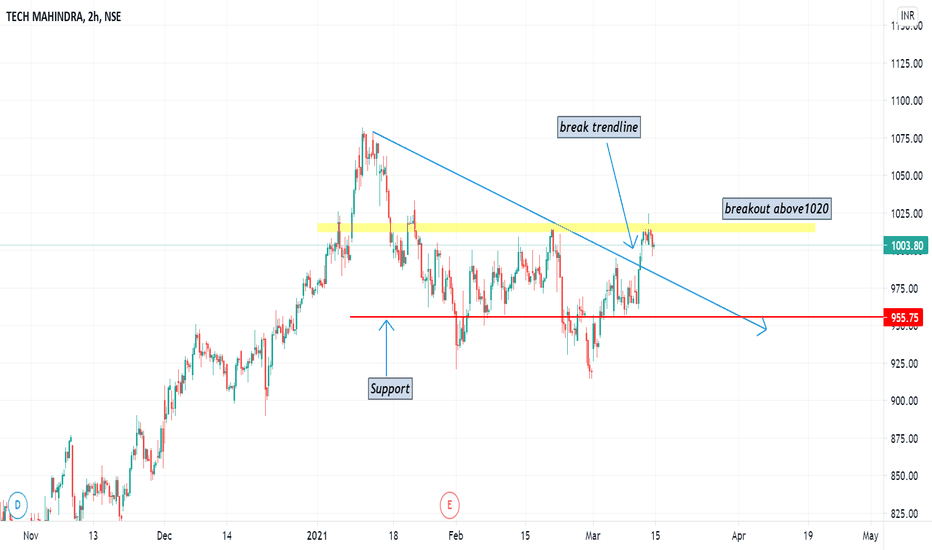
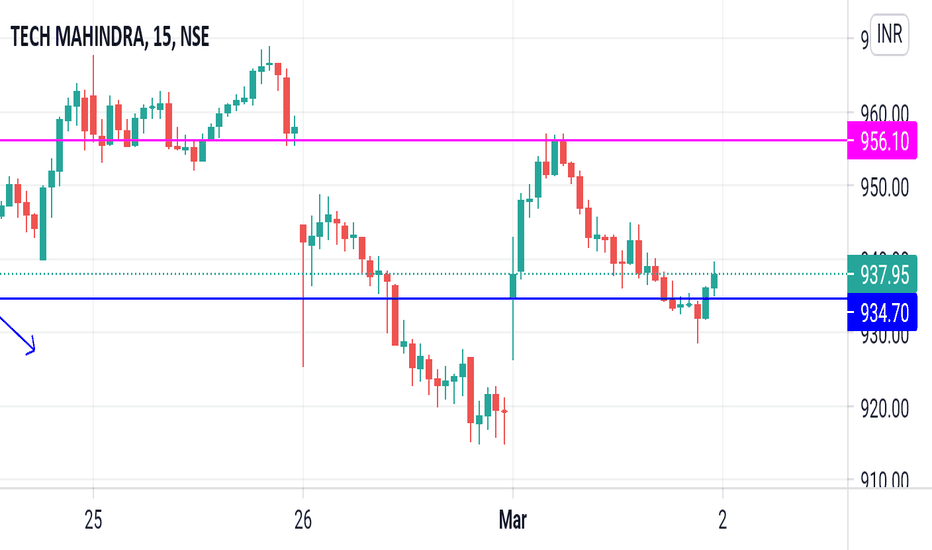
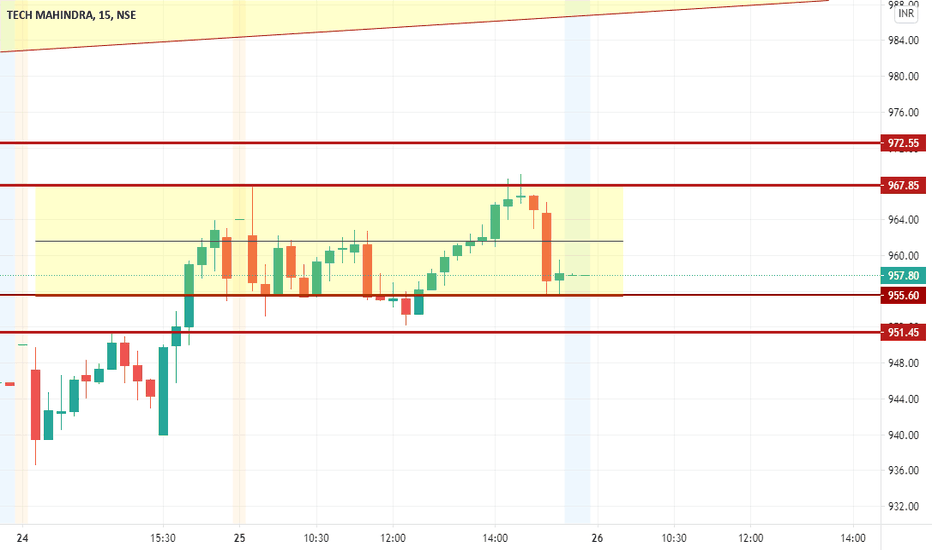
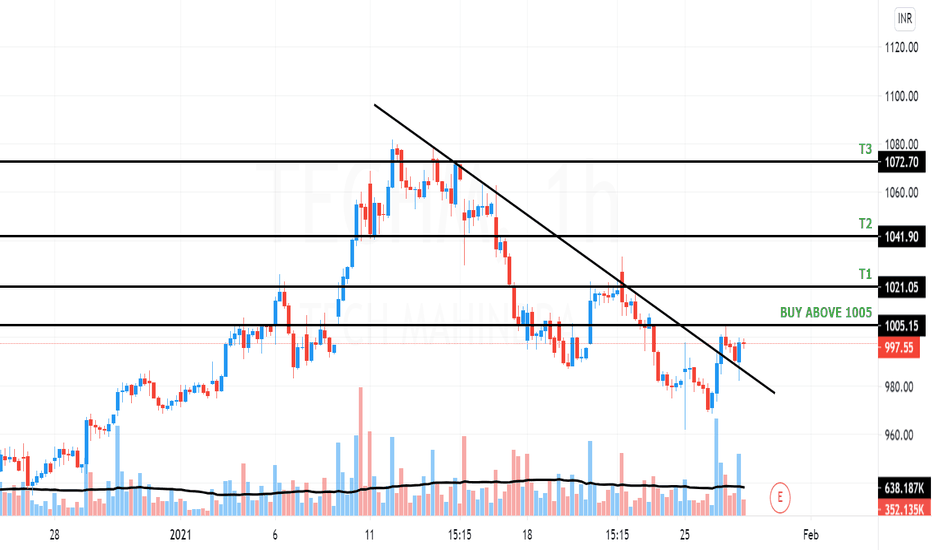
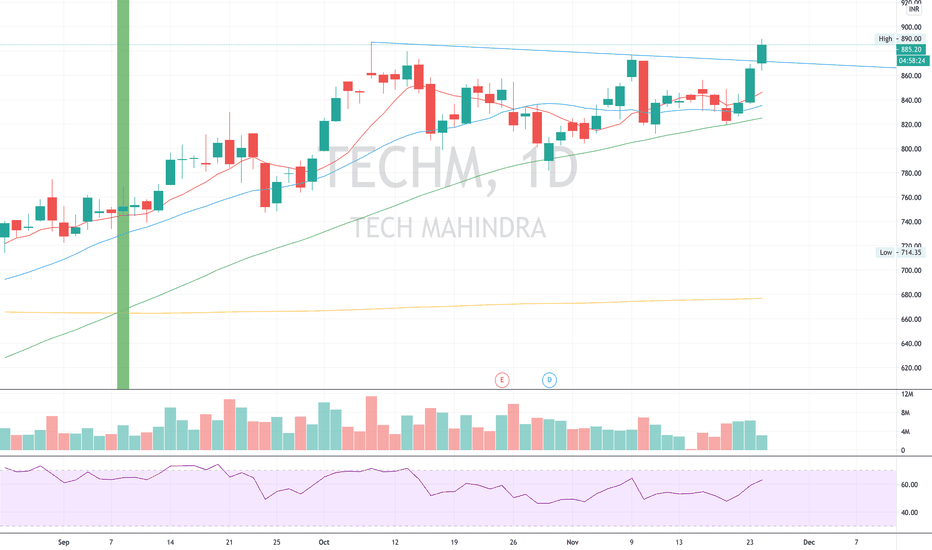
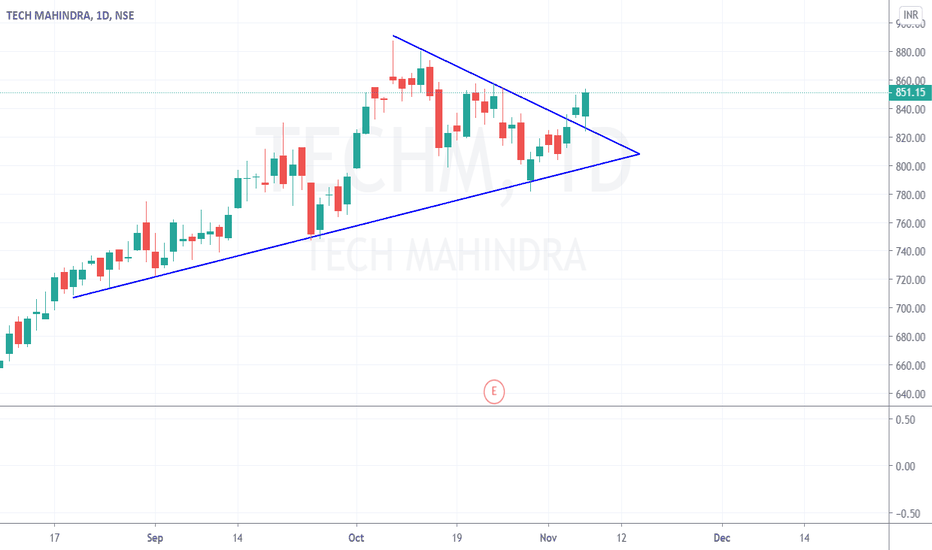
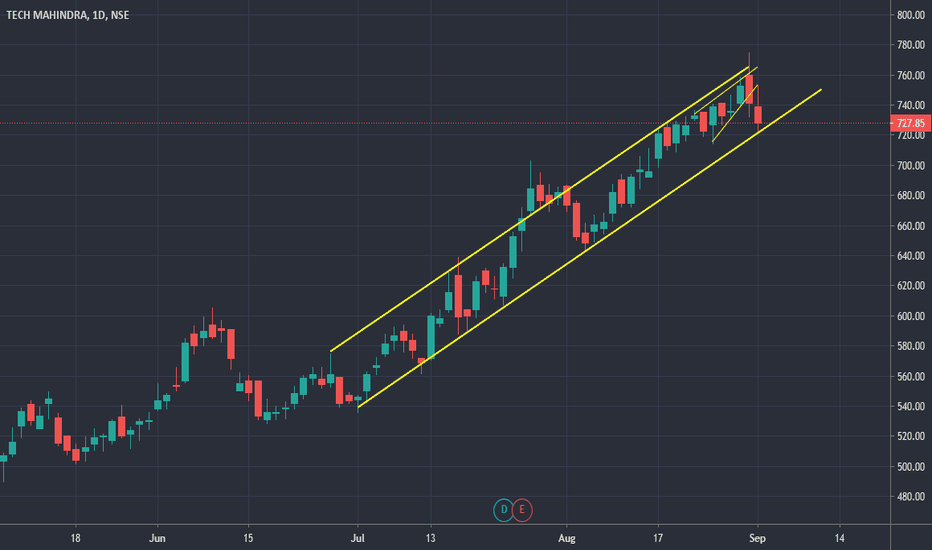
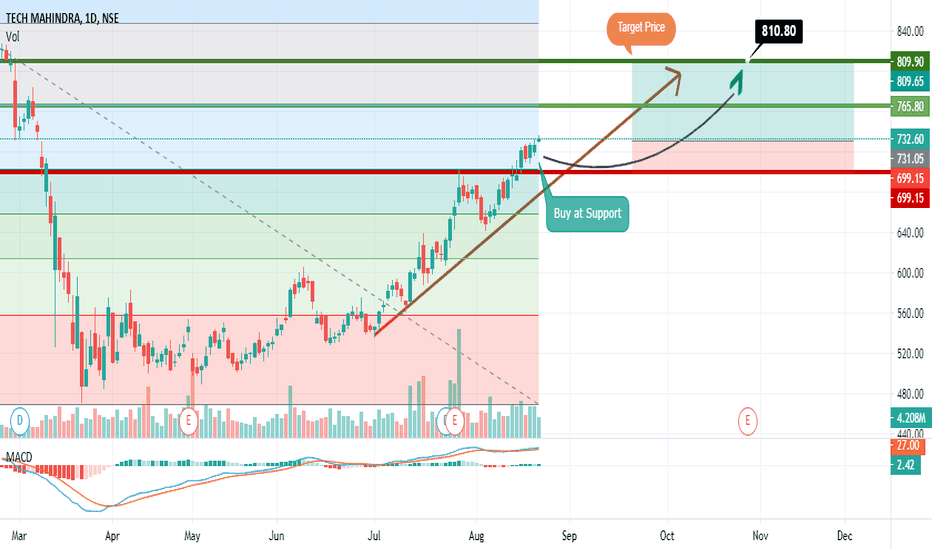
TECH MAHINDRA BULLISH SIGNALHello Trader I Found TECH MAHINDRA In Bullish signal as we can see it broke its Resistance Area and it is taking as a Support Area. Stop loss is only of 20pt and its Target Is around 100 Pt its my view please do your own analysis before taking any action. If you like my analysis Please follow and like my chart as well. Thank You
Techmahindra
TECH MAHINDRA BULLISH TARGETTECH MAHINDRA BULLISH TARGETTECH MAHINDRA BULLISH TARGETTECH MAHINDRA BULLISH TARGETTECH MAHINDRA BULLISH TARGETTECH MAHINDRA BULLISH TARGETTECH MAHINDRA BULLISH TARGETTECH MAHINDRA BULLISH TARGETTECH MAHINDRA BULLISH TARGETTECH MAHINDRA BULLISH TARGETTECH MAHINDRA BULLISH TARGETTECH MAHINDRA BULLISH TARGETTECH MAHINDRA BULLISH TARGETTECH MAHINDRA BULLISH TARGETTECH MAHINDRA BULLISH TARGETTECH MAHINDRA BULLISH TARGETTECH MAHINDRA BULLISH TARGETTECH MAHINDRA BULLISH TARGETTECH MAHINDRA BULLISH TARGETTECH MAHINDRA BULLISH TARGETTECH MAHINDRA BULLISH TARGETTECH MAHINDRA BULLISH TARGETTECH MAHINDRA BULLISH TARGETTECH MAHINDRA BULLISH TARGETTECH MAHINDRA BULLISH TARGETTECH MAHINDRA BULLISH TARGETTECH MAHINDRA BULLISH TARGETTECH MAHINDRA BULLISH TARGETTECH MAHINDRA BULLISH TARGETTECH MAHINDRA BULLISH TARGETTECH MAHINDRA BULLISH TARGETTECH MAHINDRA BULLISH TARGETTECH MAHINDRA BULLISH TARGETTECH MAHINDRA BULLISH TARGETTECH MAHINDRA BULLISH TARGET
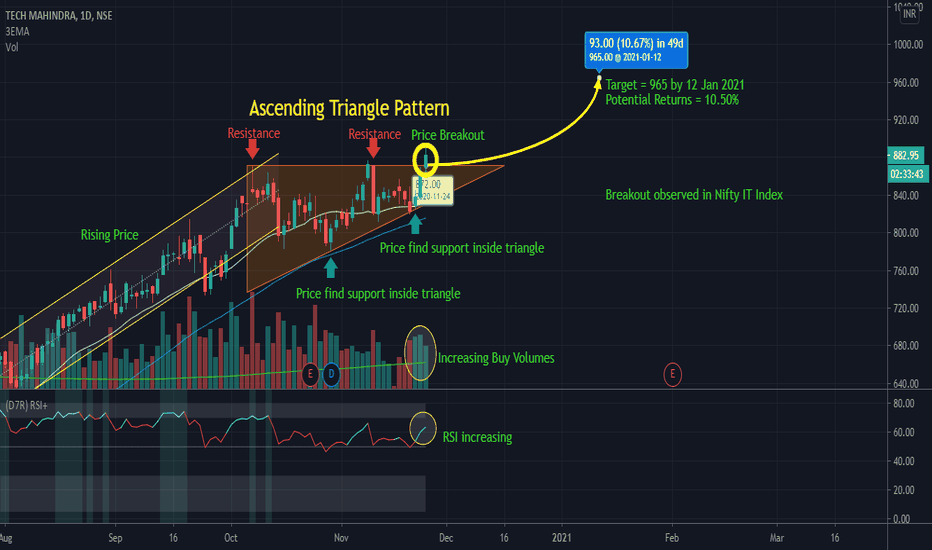
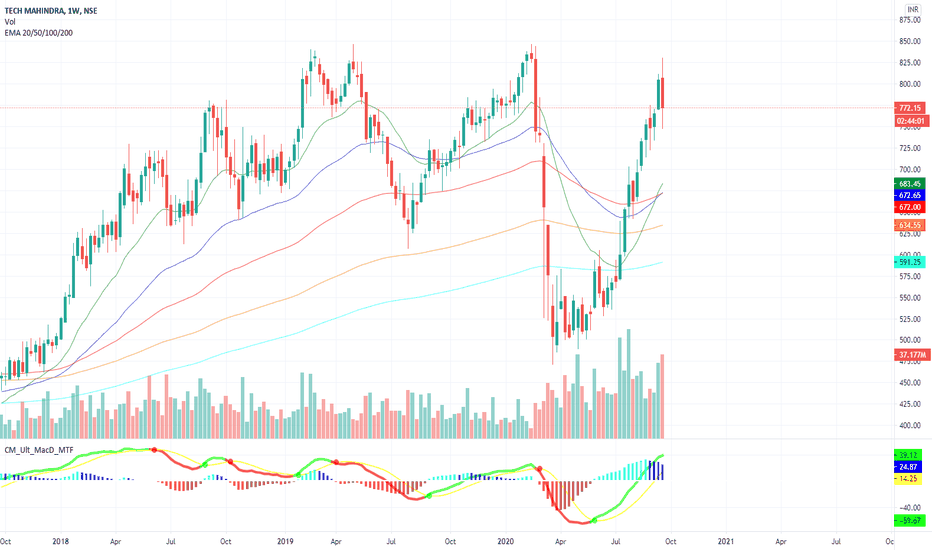
TechM_Long Call_10.50% profit in 2 monthsDate: 24 Nov 2020
TechM (CMP:882)
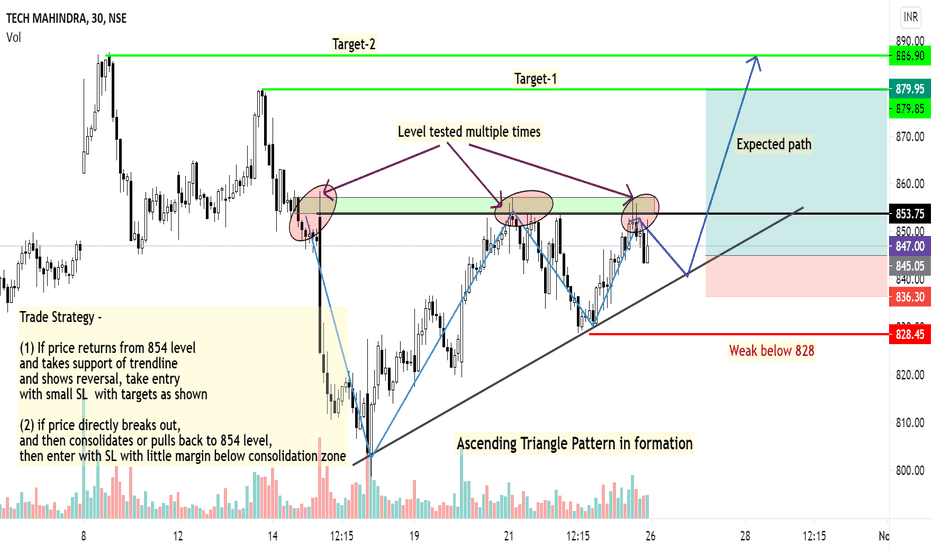
After a good price rise in the recent past stock was seen consolidating for a short period. During the consolidation the chart formed an Ascending Triangle Pattern. The volume can be seen increasing towards the buy side and RSI is at 62 levels. This is a good sign for buy in short - medium term.
Price Target: 965
Target date: 12 Jan 2021
T1 - 903, T2 - 934, T3 - 965; SL: 850
Profit Potential: 10% ~ 10.50%
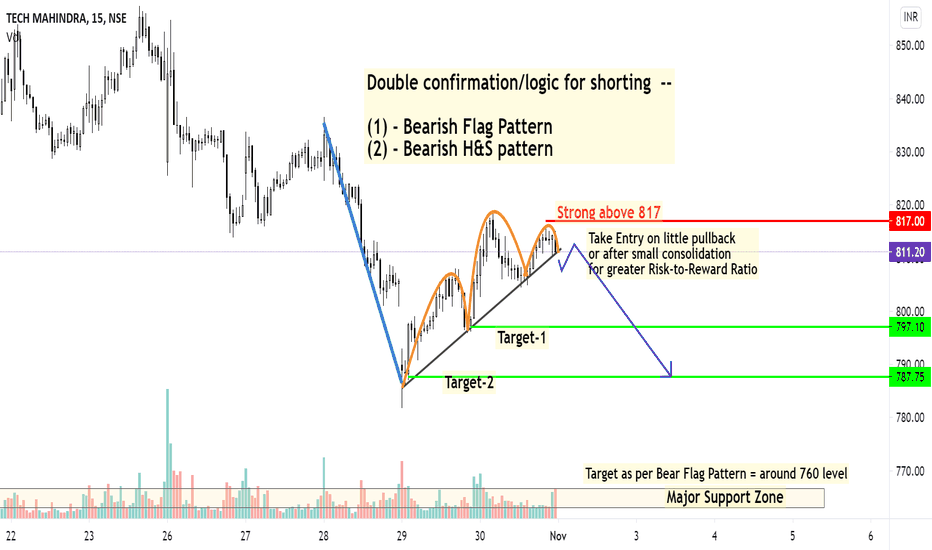
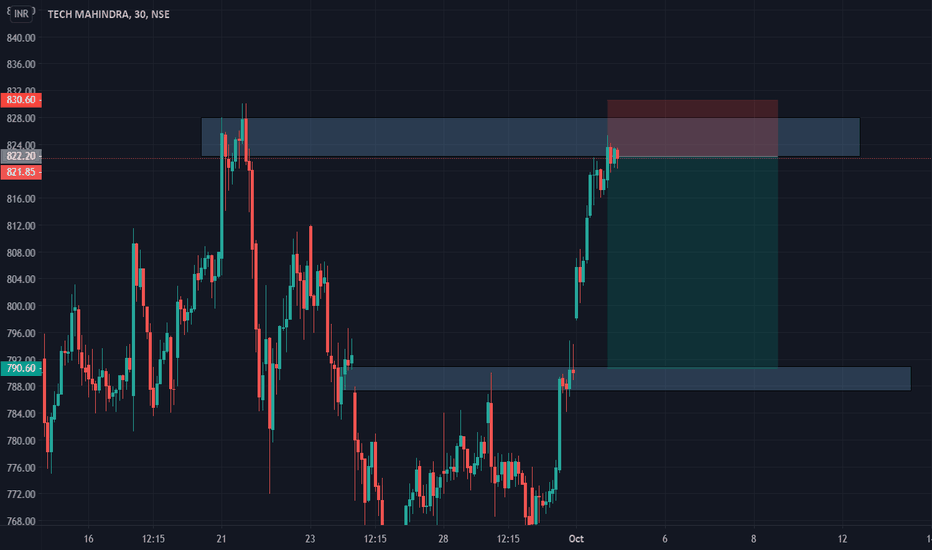
TECHM (Bearish H&S and Bear Flag)- Intraday/Short Term SwingThis analysis is purely based on price action and chart patterns.
The analysis is on 15min TF hence target can be achieved in intraday trade or in couple of days
Trade strategy is explained in image itself. Don't run after the price.
Always plan your trade & trade your plan
Keep trailing SL accordingly once entered into the trade. (IT sector is expected to be very volatile due to US-Elections)
Trade at your own risk and money management
Feel free to comment for any queries & suggestion
TECHM - Ascending Triangle - Short Term TradeThis analysis is purely based on price action
The analysis is on 30min TF hence target can be achieved in couple of days
Trade strategy is explained in image itself. Always plan your trade & trade your plan
Keep trailing SL accordingly once in trade
Trade at your own risk and money management
Feel free to comment for any queries & suggestion
