XAUUSD strong bullish analysis opportunity 1. Support May Not Hold – The chart assumes price will respect the support zone and reverse upwards. However, given the strong bearish momentum leading into this level, a breakdown is possible. A break below the support could trigger further declines instead of the expected rebound.
2. Resistance Might Not Be Reached – The analysis predicts a move towards the resistance zone around 2,940, but if selling pressure remains strong, price could stall at the intermediate resistance (around 2,910-2,920) before reversing downward again.
3. Trend Continuation Instead of Reversal – The market is currently in a downtrend, making a continuation of lower lows and lower highs more probable than an immediate bullish reversal. Any short-term bounce might be a liquidity grab before further decline
Technical-trade-ideas

XAUUSD strong down opportunity to big falling 1. Resistance Zone Validity – The marked resistance zone appears strong due to multiple rejections. However, if the price breaks above this zone with strong bullish momentum, a further rally may occur instead of the expected drop.
2. Support Strength – The lower support around 2,890 is a key level. However, if buyers aggressively step in before reaching it, the price could consolidate or reverse prematurely, invalidating the expected bearish move.
3. Market Context – Fundamental factors like economic data, interest rates, or geopolitical events could impact gold prices, overriding this technical setup.
4. False Breakdown Risk – Price could briefly dip below intermediate support and then reverse sharply, trapping sellers in a bear trap

Us30 strong bullish opportunity 1. Overly Bullish Bias
The analysis assumes a clean breakout above support and a strong push to resistance.
However, Dow Jones is known for fakeouts—meaning:
A false breakout above resistance could trap buyers before reversing.
A liquidity grab below support might happen before the real move.
2. Weak Confirmation for the Uptrend
There's no clear volume confirmation—breakouts need high volume to be valid.
Price is consolidating near key Fibonacci levels, meaning a reversal is just as likely as a breakout.
A better approach would be waiting for a strong retest and breakout confirmation.
3. Ignoring Key Fibonacci Levels
The chart includes multiple Fibonacci levels but does not integrate them into the projection.
The 2.618 (43,535) and 3.618 (43,446) levels suggest possible retracements before an upward move
Instead of an instant push-up, a dip to test Fibonacci support is likely.
4. Resistance Might Hold Strong
The resistance area is broad, meaning:
A rejection at resistance could lead to a short-term bearish pullback.
The market might range between the two levels instead of moving in a straight line.
Alternative Scenario:
Instead of assuming an instant bullish move:
1. Bearish Trap First: A false breakout above resistance to trap buyers, followed by a drop.
2. Deeper Retest: Price could revisit support or a Fibonacci level before a true breakout.
3. Wait for Volume Confirmation: If resistance breaks with strong momentum, then an entry makes sense

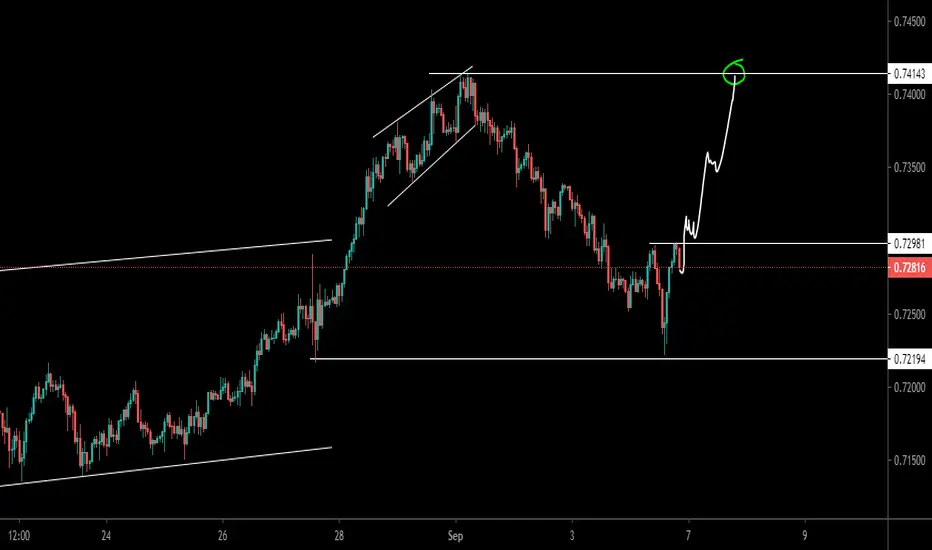
Nzdusd head to go resistance with high accuracy read the captionThe NZD/USD declined towards 0.5871 on Tuesday reflecting a loss of 0.46%, despite. The pair's movements are largely influenced by the market’s adjustments of their expectations and the delay of a rate cut by the Federal Reserve (Fed) by year-end. Rising Treasury yields are also applying downward pressure on the pair.
On the data front, in March, Building Permits experienced a decline of 4.3%, dropping to 1.457 million, below both projected and February's figures. Housing starts also saw a significant drop of 14.7%, falling short of expectations at 1.321 million. However, industrial production for the same month rose by 0.4%, meeting expectations

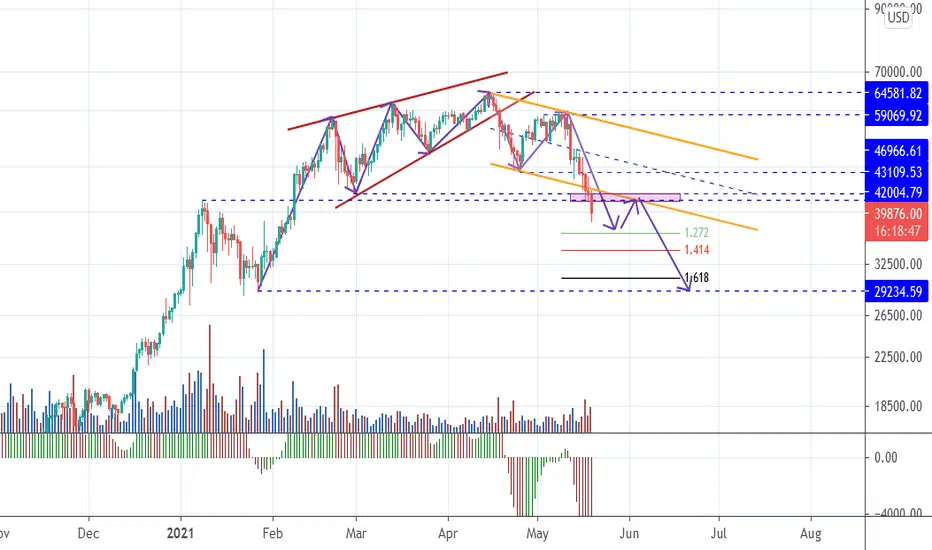
Btc confirm analysis read the caption Btc The technical picture now is more bearish as the decline from the 20-month high reached two weeks ago has continued, with the price trading above the big round number at $40,000 and breaking above some resistance levels which have now likely flipped to become resistance.
Despite this bearishness, over the past couple of days the price has firmed up and established a couple of higher lows and support levels. However, the price chart below shows that the price is well within a bearish price channel, although the lack of symmetry in the channel suggests that it may not be very reliable. Nevertheless, there is a confluence of the upper trend line of this channel with a zone of resistance stretching from $40,423 to $40,667. This looks likely to be a great place to enter a short trade if we get a bearish reversal rejecting that area.

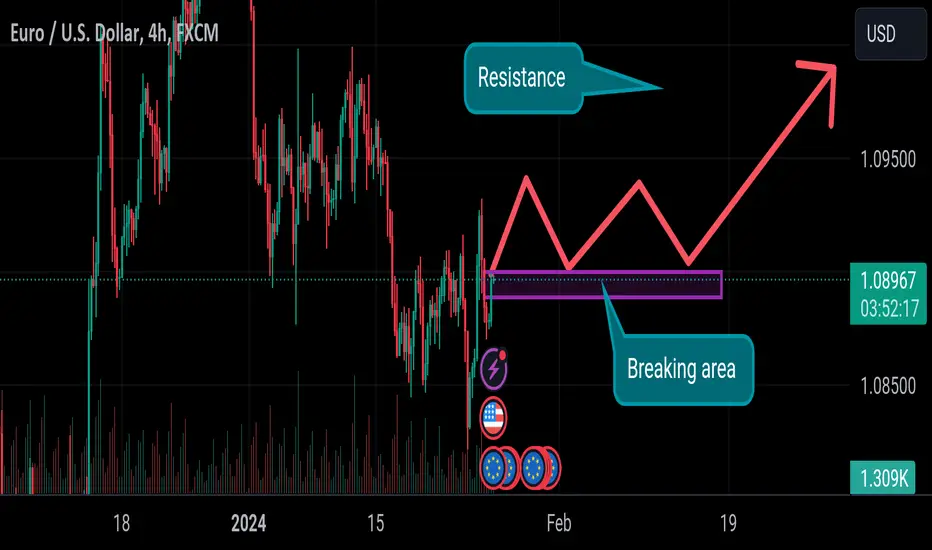
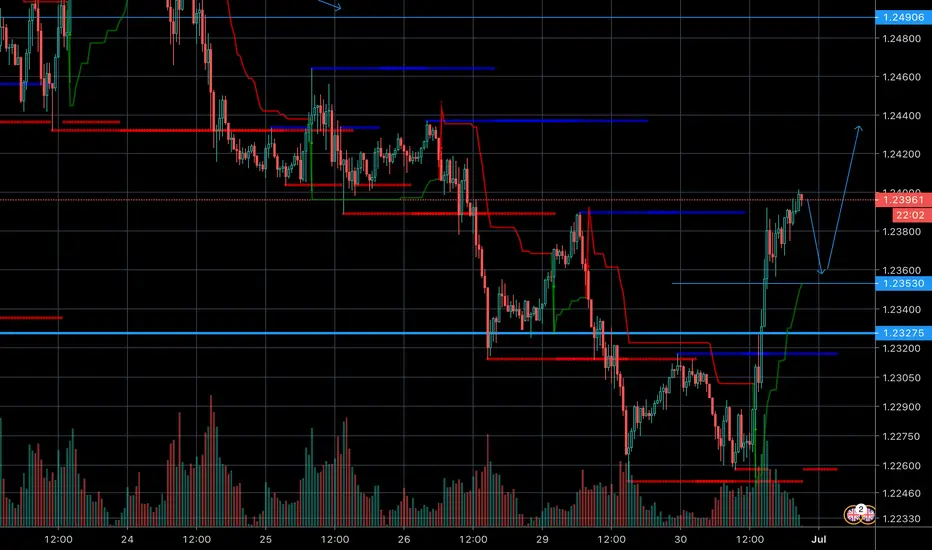
Eurusd expected move read the caption Eurusd relatively volatile after the latest flash manufacturing and services PMI numbers from the US and Europe. It initially jumped to a high of 1.08980 and then pulled back as traders wait for the upcoming ECB decision and US economic data.
The latest numbers by S&P Global showed that European manufacturing sector continued to contract in January as companies complained about inflation and supply chain issues. In Europe, the manufacturing PMI rose to 46.5, better than the expected 44.7. Despite the improvement, it remained below 51, meaning that the contraction phase continued.
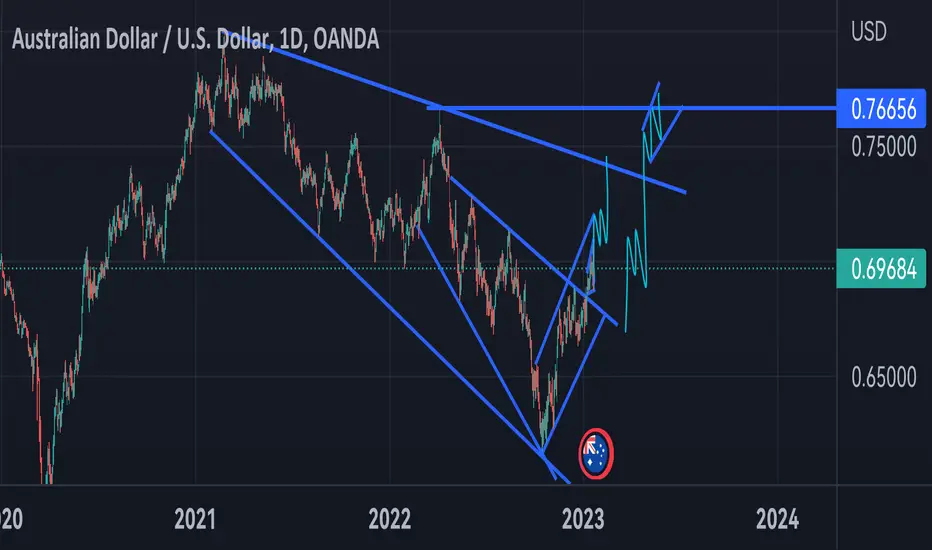
AUDUSDHii everyone its Lesedi here, hope everyone is going to have a great upcoming week, and we will,make money
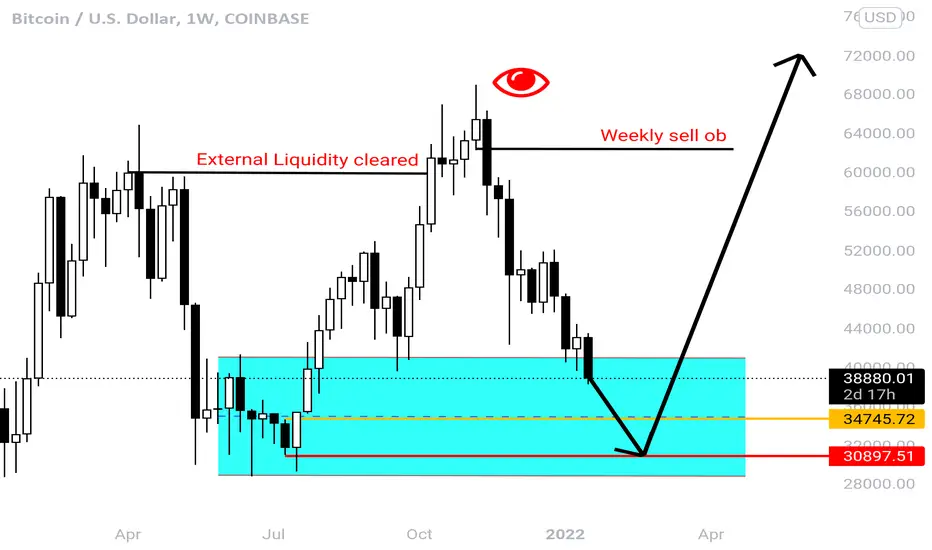
Bitcoin sell to 30000 and then buy upLook at bitcoin dropping towards a strong support level around 30000 once it hits there history buys from there !!!!!!!
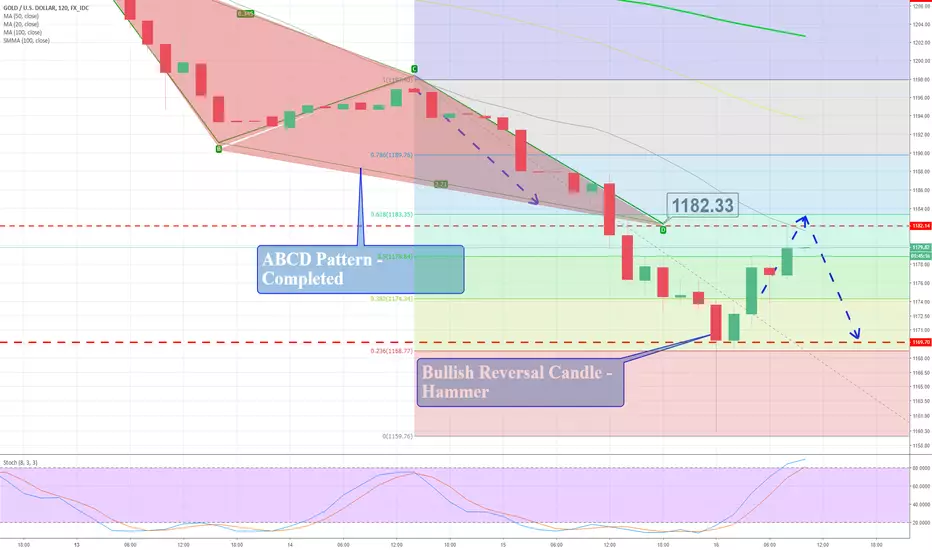
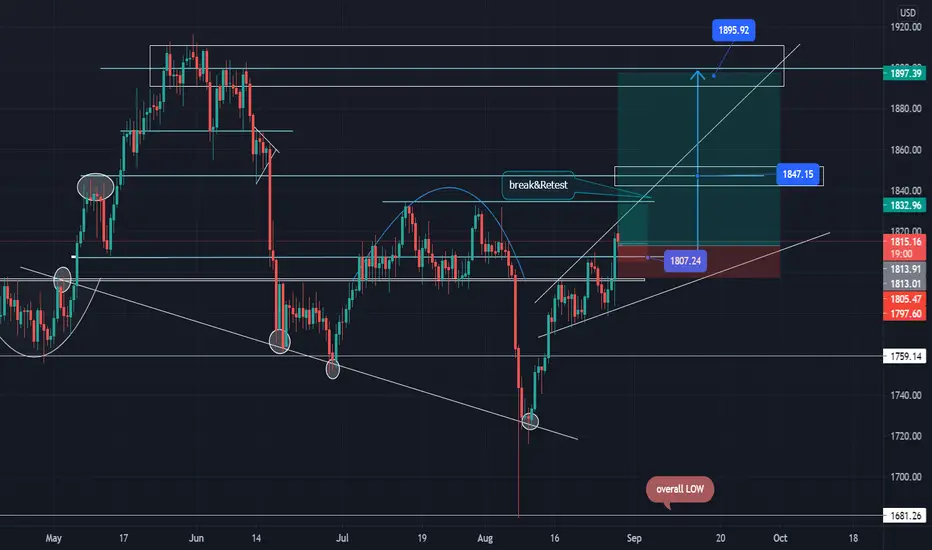
XAAUSD / GOLD * Gold overall trend is Bullish .
NB-Possible retracement for Good buy position is around 1807 area with a target of up to 1831 which is the next highs.
_intraday or swing FX:USDOLLAR
Gold has to break zone 1833 to form a break out and retest .
If a break out is formed at the stated area , further Long (buys) to 1897 area even beyond.
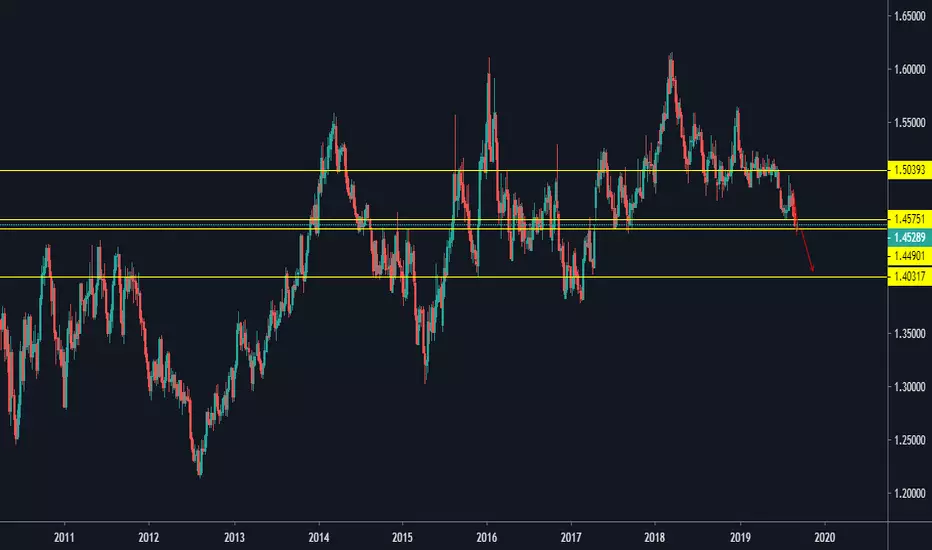
GBP ANALYsisGBPUSD as broken out of support soon to became resistance expecting a pullback to 1.234 level
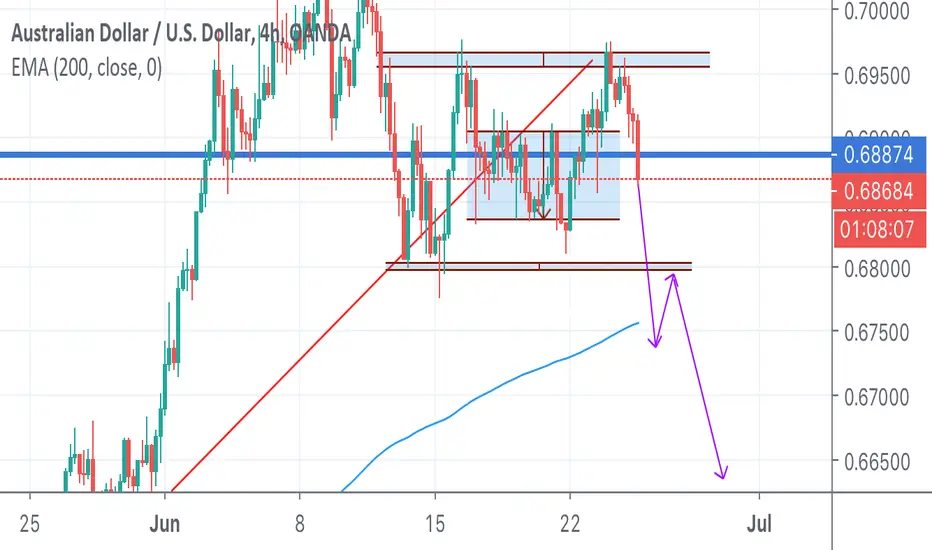
Break and retest Since the US Dollar Index is gaining upward momentum then I expect this pair to break and retest 0.68000 to Entr for the Short trade to 0.665000
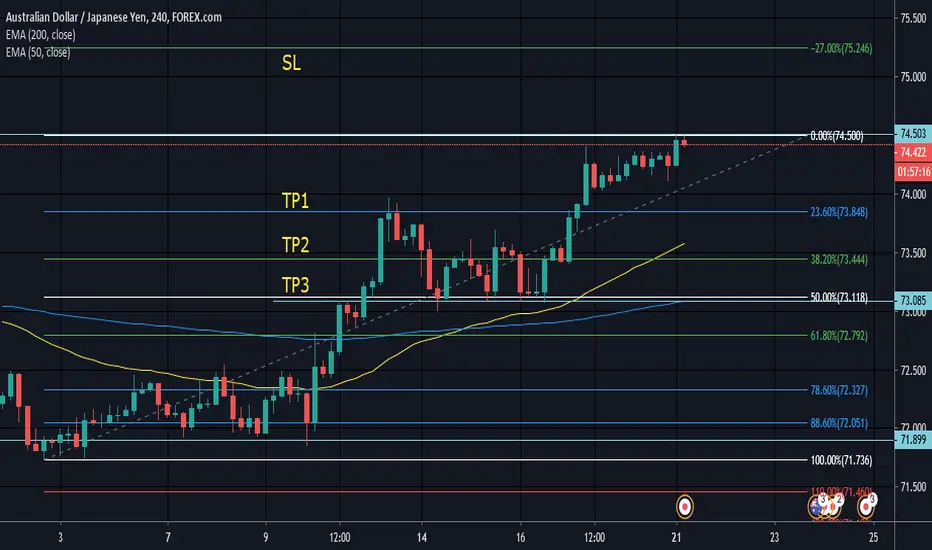
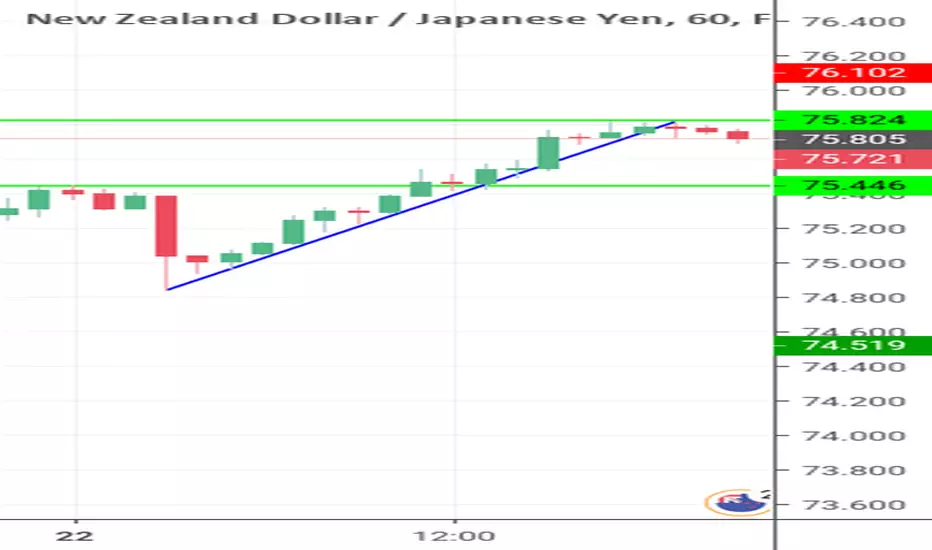
Short AUD/JPYSELL AUD/JPY @ 74.438
SL @ 75.250
TP1 @ 73.880 near 23.6%
TP2 @ 73.500 near 38.2%
TP3 @ 73.200 near 50%
-Price action shows a bullish trend but double topped at whats looks to be a strong daily resistance respected many times as far back as Sep. 16, 2019.
-TP3 sits well at the 50% level which has also been tested multiple times mid October.
-Economic indicators show a lower unemployment rate, inflation rate and and interest rate in Japan's market than in the Australian market but to play it safe I am using minimal risk with a very small lot position.
-Technical Analysis is the main reasoning behind this prediction seeing how COT reports do not show a grand amount of long orders for the yen. *Let's hope for the best and prepare with minimal risk.
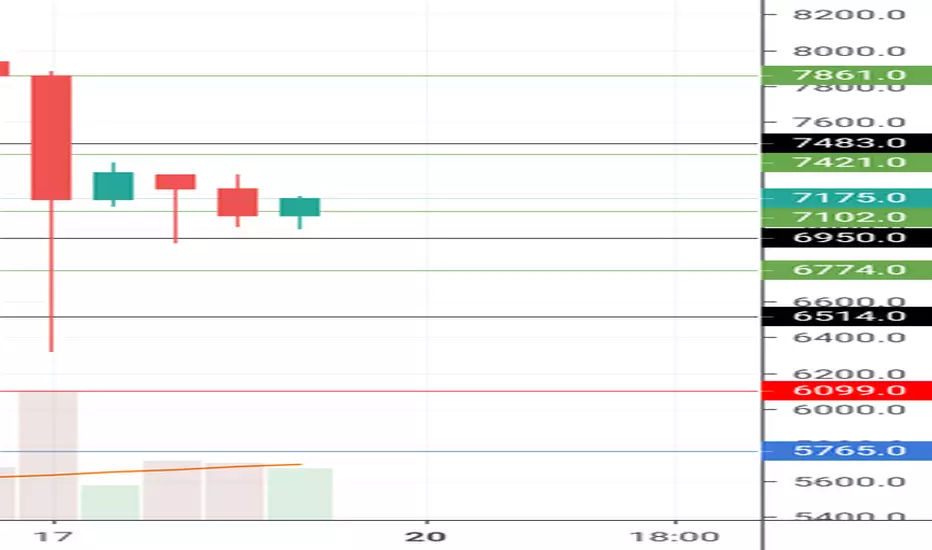
Structuretradingview on BTC05/19/2019.
Bitcoin has been on the rise for the past few months and expecting it to appreciate more from the look of the market, Buyer are in control...
Technical Analysis:
Using a combination of our tools from our trading toolbox (Fibonacci, Support and Resistance Level) At Fib's 50% (7094.0) price level showing a bullish engulfing pattern. From the previous trade session, we can see that at same Fib's 50% price level, acted as a support then went on to hit the Fib's 100% price level and did a reversal down back to Fib's 50% price level.
Waiting to break resistance price level at Fib's 61.8% at 7483.0 price.
Area valued to enter for this trade would be above the resistance price level at 7520.0 and set my first target price at 7861.0, take my first profit out of the market, wait to take my second order to aim target price at Fib's 100% price level at 8448.0 price...
MKSI: Longer bottom completed and moving with momentumMKSI worked on a longer-term bottom formation that is completed and moving up with momentum at this time. The consolidations of the past two 1-day runs are very precise and horizontal. These candlestick patterns offered excellent low-risk entries. The stock has an all-time high around $128, so ample room to move up further. It has also completed a near perfect V Trough formation on the long-term cycle indicator chart. Currently price is controlled by professional technical traders.

Gold jumps to hit our take profit – Are you ready for next tradeInvestors will also be looking for the U.S. economic events like building permits, housing stats, and Philly Fed manufacturing index to determine further movements in gold. In case you don’t know, the dollar shares a strong negative correlation with gold. Therefore, the positive data may drive bears in the bullion market today. Refer to Fxleaders Aug 16 – Economic Events Outlook for more understanding of trading these events.