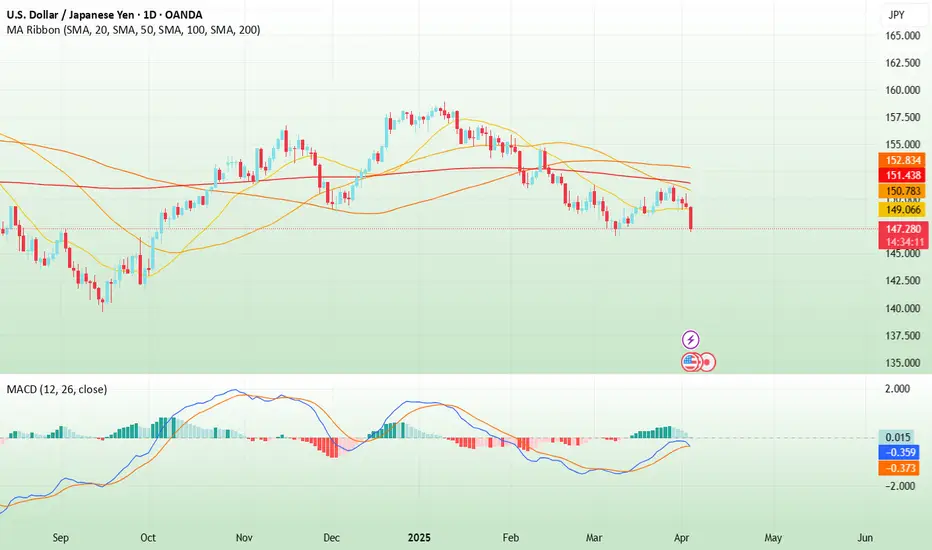
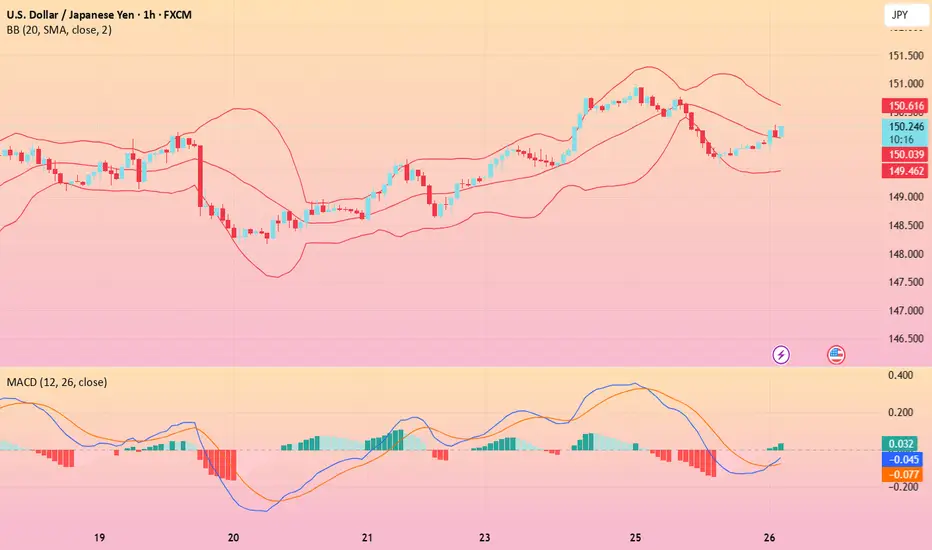
USD/JPY(20250403)Today's AnalysisMarket news:
US trade policy-① Trump signed an executive order to establish a 10% "minimum base tariff" for all countries, and will impose reciprocal tariffs, including 20% for the EU, 24% for Japan, 46% for Vietnam, and 25% for South Korea. The tariff exemption for goods that meet the USMCA will continue, and the tariff for those that do not meet the requirements will remain at 25%; ② The US Treasury Secretary called on countries not to retaliate; ③ The base tariff will take effect on April 5, and the reciprocal tariff will take effect on the 9th. In addition, the 25% automobile tariff will take effect on the 3rd, and the automobile parts tariff will take effect on May 3rd; ④ Gold bars, copper, pharmaceuticals, semiconductors and wood products are also not subject to "reciprocal tariffs".
Today's buying and selling boundaries:
149.61
Support and resistance levels
150.97
150.46
150.13
149.08
148.75
148.24
Trading strategy:
If the price breaks through 148.75, consider buying, the first target price is 149.08
If the price breaks through 148.24, consider selling, the first target price is 148.00
Technical
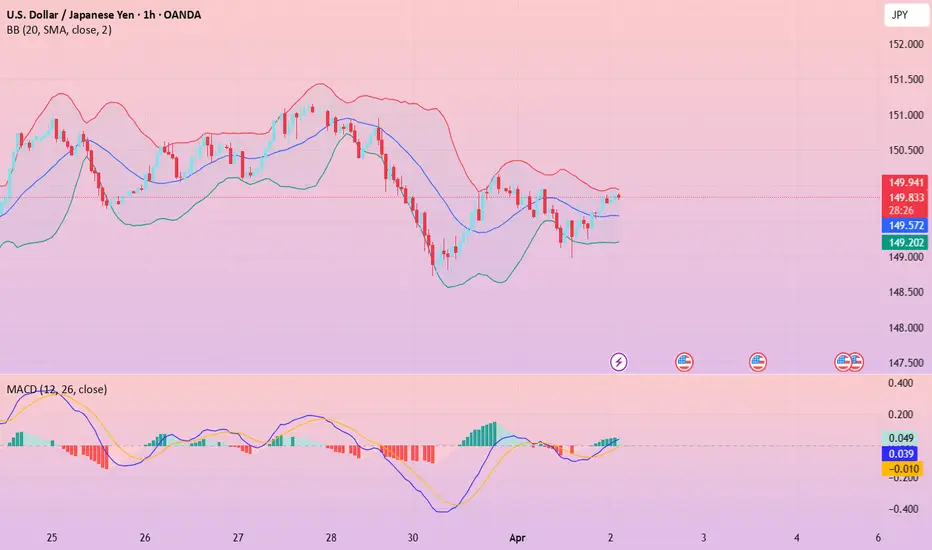
USD/JPY(20250402)Today's AnalysisToday's buying and selling boundaries:
149.55
Support and resistance levels
150.70
150.27
149.99
149.11
148.83
148.40
Trading strategy:
If the price breaks through 149.99, consider buying, the first target price is 150.27
If the price breaks through 149.55, consider selling, the first target price is 149.11
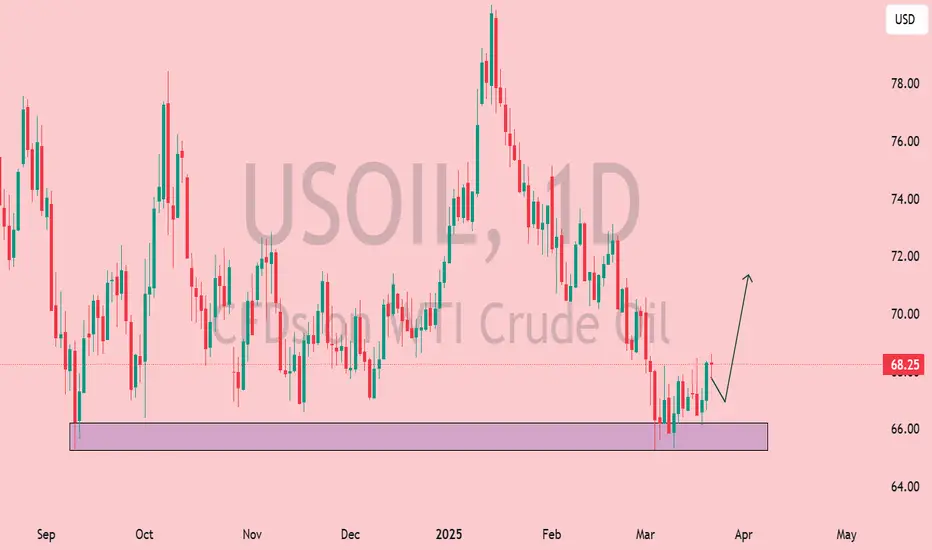
USOIL Daily Analysis: Bullish Reversal from Key Support USOIL (WTI Crude Oil) daily chart showing price action analysis.
Key Observations:
Support Zone:
A strong demand zone is marked around $65-$66, which has acted as a reversal area in the past.
The price has recently bounced off this zone, indicating potential buyer interest.
Current Price Action:
Price is currently trading at $68.25.
A bullish move started from the support region, with a higher low formation suggesting potential upside momentum.
Potential Scenario:
The chart suggests a pullback before continuation to the upside.
If the support holds, $70-$72 could be the next target.
If price fails to hold above $66, further downside towards $64 may be possible.
Outlook:
Bullish Bias 📈 as long as the price remains above the demand zone.
Watch for a higher low confirmation before entering a long trade.
Breakout above $70 could signal a stronger rally.
Agape ATP Corporation (ATPC) Technical Analysis | 31 March 2025Agape ATP Corporation (ATPC) has demonstrated a significant breakout above a key resistance level, with the current price trading at $1.18, reflecting an increase of +0.85% on the day. The bullish move is backed by an increase in trading volume from the previous trading day, which signals renewed investor interest and growing confidence in the stock’s upward trajectory.
This breakout marks a shift in sentiment, indicating the potential for a sustained rally as the price decisively cleared its previous consolidation range.
The price action has remained consistently above the Exponential Moving Average (EMA) slope cross indicator, with the dynamic support now situated between $1.12 and $1.17. The bullish crossover of the EMA signals confirms a strengthening uptrend, as the widening of the EMA cloud suggests that buying pressure is increasing. Historically, such a pattern indicates that the breakout is not merely a short-term spike but a shift toward higher price levels, paving the way for sustained gains.
The EMA zone is expected to act as a buffer against any minor retracement, maintaining bullish momentum.
Adding to the bullish outlook is the Relative Strength Index (RSI) Divergence Indicator (14, close), which currently stands at 81.14, suggesting that the stock has entered overbought territory. While an overbought condition often raises concerns of a potential pullback, in the context of a strong breakout, it typically serves as a confirmation of the stock’s strength.
Stocks that experience such momentum tend to remain in overbought territory for extended periods before any meaningful consolidation occurs. The RSI divergence, which previously indicated bearish pressure, has been invalidated by the recent surge, giving further credence to the current bullish momentum.
The breakout above $1.18 is significant as it marks the upper limit of a prolonged consolidation phase where buyers have consistently absorbed selling pressure. Throughout this consolidation, the emergence of multiple “Long” buy signals, combined with a noticeable reduction in “Short” signals, indicated that accumulation was underway. The recent breakout confirms that buyers have taken control, and the subsiding of selling pressure further strengthens the bullish case. The consistency of these buy signals, coupled with increased volume, suggests that the breakout is not merely speculative but supported by strong underlying demand.
Overall, the technical setup suggests that ATPC is well-positioned for further upside. The combination of a decisive breakout, increasing volume, and sustained bullish signals points to the likelihood of continued gains. With momentum firmly in favour of the bulls and the stock showing resilience above key levels, the outlook remains positive. Investors should monitor the price action closely for confirmation of continued strength, with a focus on maintaining support above $1.12 while aiming for potential targets of $1.25 to $1.30 in the near term. If momentum persists, a further extension toward $1.40 could be possible, supported by the bullish market sentiment surrounding the stock.

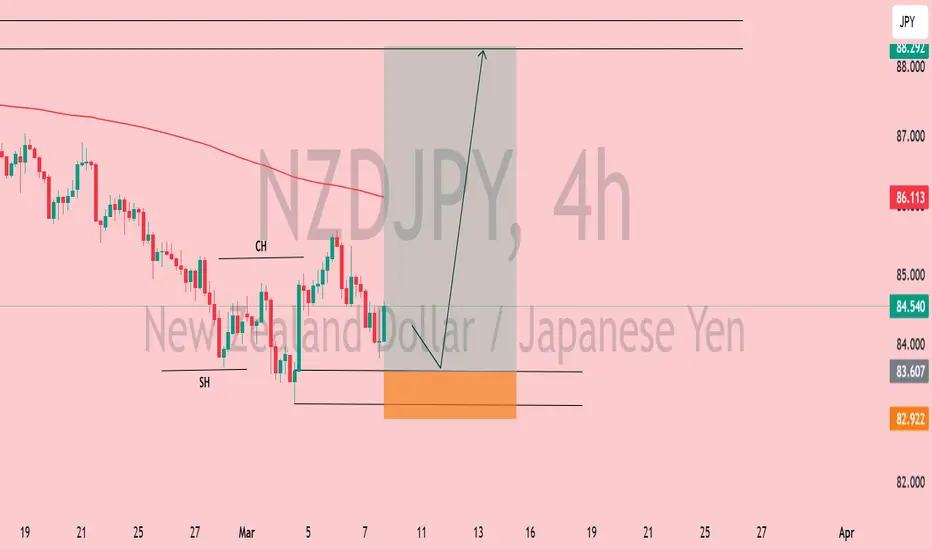
NZD/JPY 4H - Bullish Reversal Setup NZD/JPY 4H Chart Analysis 📊🔥
Key Observations:
Market Structure:
The market has been in a downtrend but appears to be forming a potential reversal pattern.
A swing low (SH) has formed, indicating possible liquidity grab or accumulation.
Change of Character (CH) suggests a potential shift from bearish to bullish momentum.
Support & Demand Zone:
A demand zone (orange area) is highlighted around 82.92, which may act as a strong support level.
Price is expected to tap into this area before a potential bullish rally.
Upside Target 🎯:
If price respects the demand zone, we could see a bullish push towards the 88.29 resistance level.
The 200 EMA (red line) could act as a dynamic resistance along the way.
Trade Idea 💡:
Bullish Bias: Looking for long entries near 82.92 with targets around 88.00+.
Risk: If price breaks below the demand zone, further downside could be expected.
Conclusion:
📌 Watch for price reaction in the demand zone! If buyers step in, we could see a strong bullish move towards 88.00+. 🚀📈
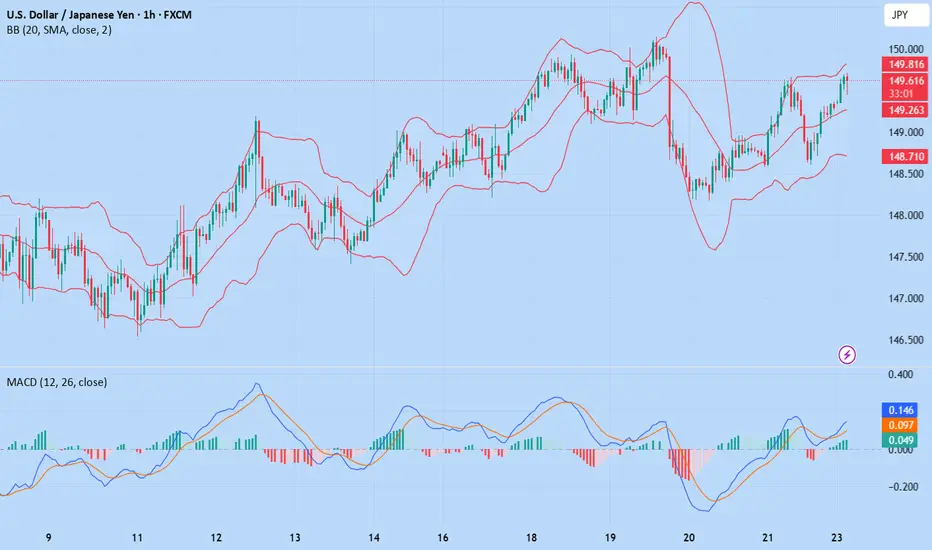
USD/JPY(20250326)Today's AnalysisToday's buying and selling boundaries:
150.12
Support and resistance levels:
151.50
150.98
150.65
149.59
149.25
148.73
Trading strategy:
If the price breaks through 150.12, consider buying, the first target price is 150.65
If the price breaks through 149.59, consider selling, the first target price is 149.25
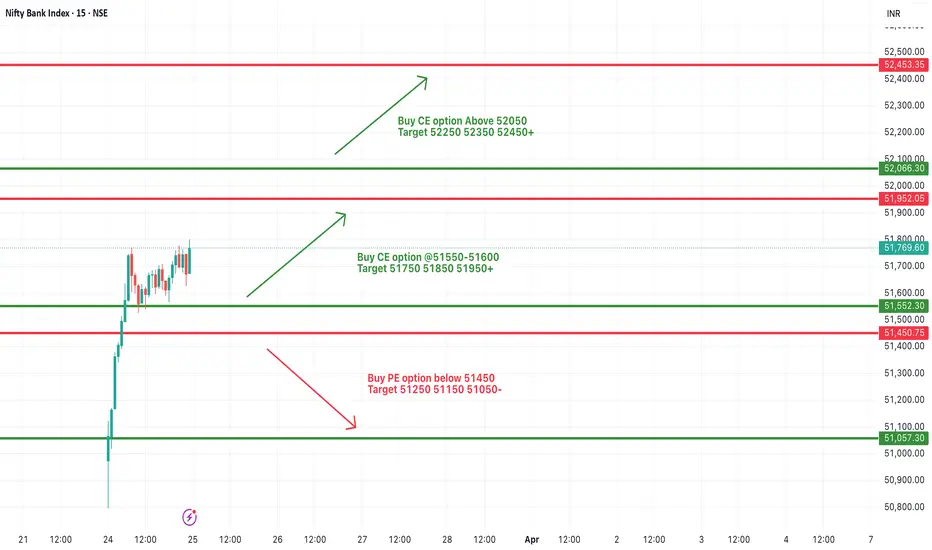
[INTRADAY] #BANKNIFTY PE & CE Levels(25/03/2025)Gap up opening expected in today's session. Expected opening above 52000 level. After opening if banknifty sustain above 52050 then expected strong upside rally upto 52450+ level in opening session. Downside 51550 level will act as a strong support for today's session. Any major downside only expected below 51450 level.
USD/JPY(20250325)Today's AnalysisToday's buying and selling boundaries:
150.25
Support and resistance levels:
151.62
151.11
150.78
149.73
149.40
148.89
Trading strategy:
If the price breaks through 150.78, consider buying, the first target price is 151.11
If the price breaks through 150.25, consider selling, the first target price is 149.73

USD/JPY(20250324)Today's AnalysisToday's buying and selling boundaries:
149.18
Support and resistance levels:
150.25
149.85
148.59
148.77
148.51
148.11
Trading strategy:
If the price breaks through 148.59, consider buying, the first target price is 149.85
If the price breaks through 149.18, consider selling, the first target price is 148.77
HBAR ANALYSIS📊 #HBAR Analysis
✅There is a formation of Descending triangle pattern on weekly chart. Also #HBAR is trading around its low level. If the price sustains here and give a bullish move then we could expect a bullish move otherwise we would see more dip.
👀Current Price: $0.18230
⚡️What to do ?
👀Keep an eye on #HBAR price action and volume. We can trade according to the chart and make some profits⚡️⚡️
#HBAR #Cryptocurrency #TechnicalAnalysis #DYOR

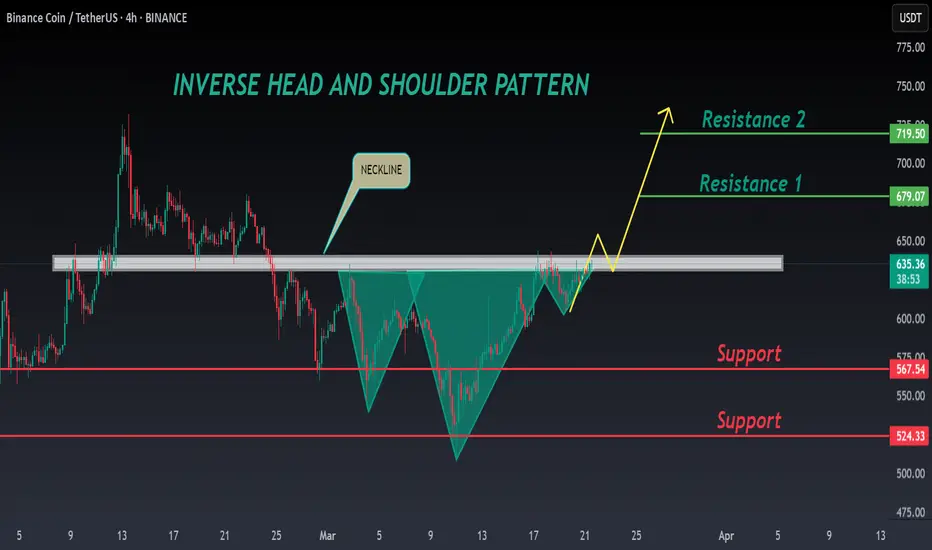
BNB ANALYSIS🚀#BNB Analysis : Pattern Formation
🔮As we can see in the chart of #BNB that there is a formation Inverse Head And Shoulder Pattern and it's a bullish pattern. If the candle closes above the neckline then a bullish move could be confirmed✅️
🔰Current Price: $635
⚡️What to do ?
👀Keep an eye on #BNB price action. We can trade according to the chart and make some profits⚡️⚡️
#BNB #Cryptocurrency #TechnicalAnalysis #DYOR
USD/JPY(20250321)Today's AnalysisToday's buying and selling boundaries:
148.63
Support and resistance levels:
149.40
149.11
148.92
148.33
148.14
147.85
Trading strategy:
If the price breaks through 148.92, consider buying, the first target price is 149.11
If the price breaks through 148.63, consider selling, the first target price is 148.33
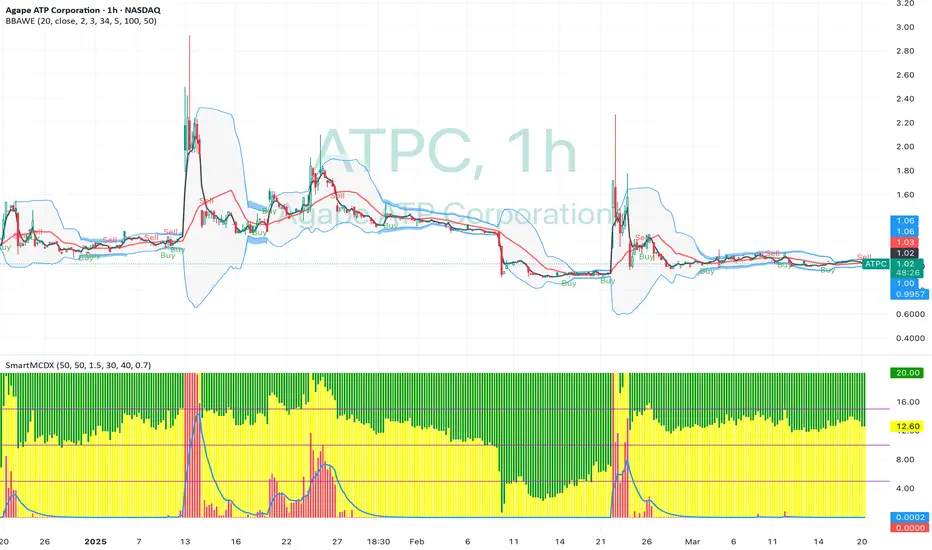
Quick Technical Take on Agape ATP Corporation (ATPC)Let’s break down the 1-hour chart for Agape ATP Corporation (ATPC) as of March 20, 2025. The stock’s sitting at $1.02, down about 1%, and it’s been a wild ride lately.
The price spiked to $3.00 in late January before crashing hard. Since then, it’s been hanging around the $1.00 mark, which has been a solid support; buyers keep stepping in here, like clockwork, especially in early March.
The Bollinger Bands show the price dipping below the lower band in mid-February, hinting at an oversold bounce, and now it’s consolidating near that $1.00 level. We’ve got a recent "Sell" signal at $1.06, so there’s some short-term bearish pressure.
The SmartMCDX indicator below the chart is flashing mixed signals: green for bullish, red for bearish. Lately, it’s leaning red, suggesting the bears might have the upper hand for now. Volume’s pretty quiet, which means no big players are jumping in yet, so we might just keep drifting near $1.00.
What to Watch : If the price holds above $1.00, we could see a push toward $1.06 or even $1.20. But if it breaks below $1.00, things could get ugly, maybe dropping to $0.90. For now, I’d sit tight and see which way the wind blows; $1.00 is the key.
A possible short-term bullish set-up on EURCAD?Well, it seems that FX_IDC:EURCAD could be forming either a bullish pennant, or a falling wedge pattern in the near-term. Both patterns tend to result in a bullish breakout. However, we still require a confirmation. Without it, there is still a chance to see a move lower.
MARKETSCOM:EURCAD
Let us know what you think in the comments below.
Thank you.
74.2% of retail investor accounts lose money when trading CFDs with this provider. You should consider whether you understand how CFDs work and whether you can afford to take the high risk of losing your money. Past performance is not necessarily indicative of future results. The value of investments may fall as well as rise and the investor may not get back the amount initially invested. This content is not intended for nor applicable to residents of the UK. Cryptocurrency CFDs and spread bets are restricted in the UK for all retail clients.

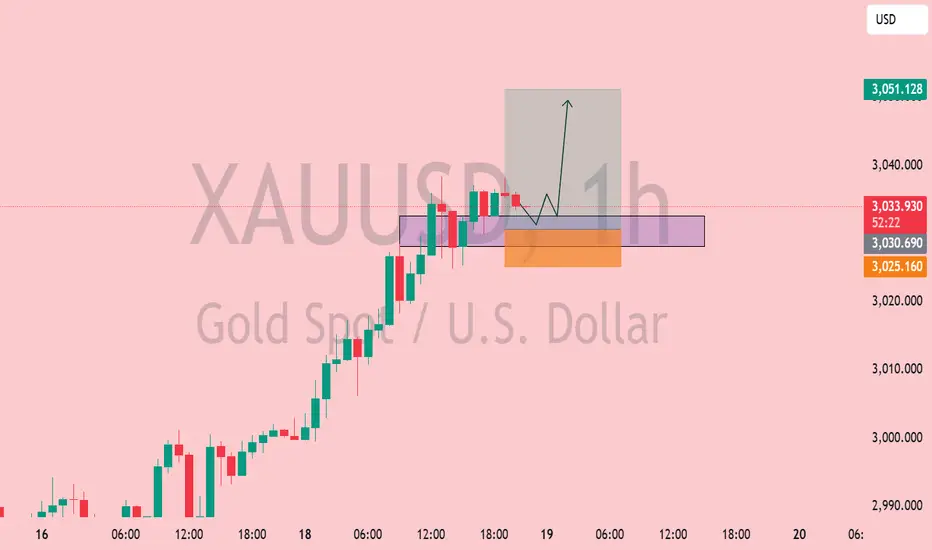
XAU/USD 1H – Bullish Continuation from Demand Zone?📊 XAU/USD (Gold) 1H Analysis – Bullish Continuation Setup
🔹 Market Structure: Gold has been in a strong uptrend, with price currently consolidating near a key demand zone.
🔹 Key Levels:
🔴 Resistance: $3,050 - $3,060 (Potential target)
🟣 Demand Zone: $3,030 - $3,035 (Support area)
🟠 Deeper Support: $3,025 (Break below weakens bullish bias)
📈 Potential Trade Setup:
1️⃣ A possible pullback into the demand zone could attract buyers.
2️⃣ Price may wick below liquidity before reversing.
3️⃣ If support holds, we anticipate a move toward $3,050+.
✅ Entry Zone: $3,030 - $3,035
🎯 Target: $3,050 - $3,060
🚨 Stop Loss: Below $3,025
⚠️ Watch for price action confirmation before entering. A strong bullish candle from support could signal entry. Let the market show its hand! 🚀✨
NZDJPY 4h chart analysis: Key levels Trends SetupThe NZDJPY pair is showing slight bullish momentum but the key level to watch is 86.000 A breakout above this level could signal further upside. while rejection could lead to retest of lower support levels, Stay alert and trade with cautions.

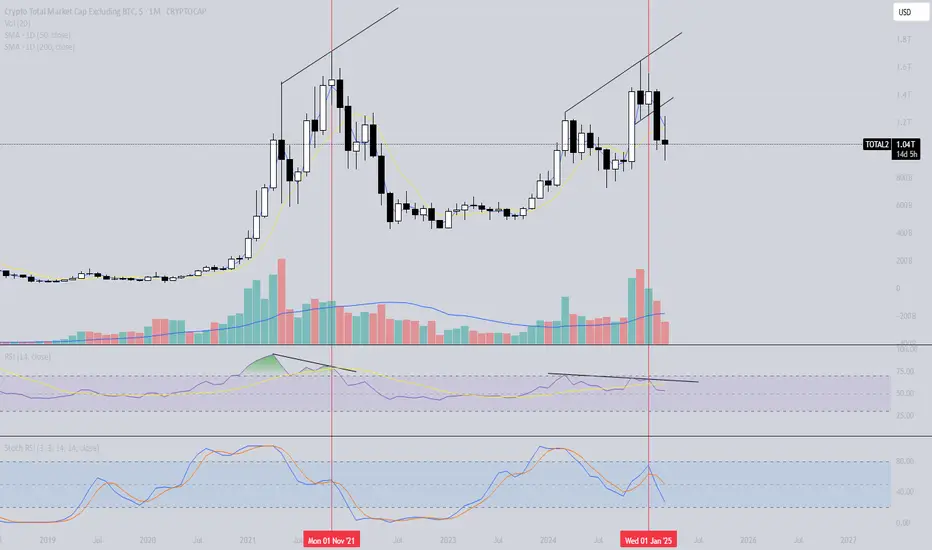
Total 2 Marketcap - Is this cycle repeating the last two cycles?In this analysis, we are discussing the possible repetition of the last two cycles by the total 2 (Crypto Total Market Cap Excluding BTC) on the monthly timeframe. By comparing this cycle in conjunction with the RSI and the Stochastic RSI with the previous two cycles we could make a statement that the market might follow the same bearish signals.
What did we see in the previous two cycles with regard to the price action and RSI
In both bullmarket cycles we saw the total 2 making highers highs and higher lows. In both instances the RSI made a lower high while the price action made a higher how consulting in a bearish divergence on the monthly timeframe.
What did we see in the previous two cycles with regard to the price action and Stochastic RSI
In the last two bullmarkets we saw the Stochastic RSI (momentum indicator) rising to levels above 80 on the indicator, overbought territory. This means that the momentum to the upside in the Crypto market is immense. However, in both instances the Stochastic RSI was in overbought territory during the first top. After the first top the momentum weakened and thus resulting in bearish momentum below level 80.
However, the momentum weakening, both cycles made a new higher high. By making a new higher high the Stochastic RSI made a bullish cross around the 40/50 level. Nevertheless, after making a new higher high and a new Stochastic RSI cross up the price fell, resulting in another bearish Stochastic RSI cross down.
What we can conclude is that in both previous cycles the Stochastic RSI made a cross down below the 80 level at the first top and made a second cross down around the 40/50 level during the final top.
How does the previous cycles relate to this current cycle
In this current bullmarket we see the Total 2 Marketcap rising and making higher highs and higher lows. However, this cycle looks alike the past two cycles in comparison with the price action, RSI and Stochastic RSI.
This Cycle the price action made higher highs and the RSI made a lower high. Thus, resulting in a bearish divergence.
Also, in this cycle the first peak occurred with the Stochastic RSI above the 80 level and breaking down at a later moment, resulting in bearish momentum. However, this cycle did the same as the previous two. With the bearish momentum the Total 2 Marketcap made a new high with a second Stochastic RSI cross down at the 40/50 level.
Conclusion
This cycle looks a lot like the past two cycles in comparison with the RSI and Stochastic and thus suggesting that there is a possibility that we go in to a new bearmarket and repeat the last two cycles. The current evidence shows that the market might follow the similar path again.
What is a bearish divergence
A bearish divergence signify potential downtrends when prices rally to a new high while the indicator (RSI) refuses to reach a new high and thus making a lower high.
Thanks for your support!
Drop a like and leave a comment to have a conversation about this topic. Make sure to follow me so you don’t miss out on the next analysis.
XAUUSD Analysis: Bearish Reversal with Potential for Liquidity📉 XAUUSD (Gold Spot vs USD) Analysis - 3H Chart
🌟 Shooting Star Pattern Detected: The market has formed a shooting star, a bearish reversal candlestick, signaling potential weakness at the top.
📍 Key Resistance Zone (Purple Box): Price action has been rejected from this area, showing strong selling pressure.
🔍 If Break Scenario: Should the price break below the 2,949 support zone (🔵), we can expect a bearish drop 📉 with potential liquidity grab before a pullback for a new all-time high (ATH) 🚀.
🧐 Market Sentiment: Bearish bias for now, but watch for a potential reversal after liquidity is swept.
✅ Trader's Tip: Wait for a clean break and retest before entering a short position. 🎯

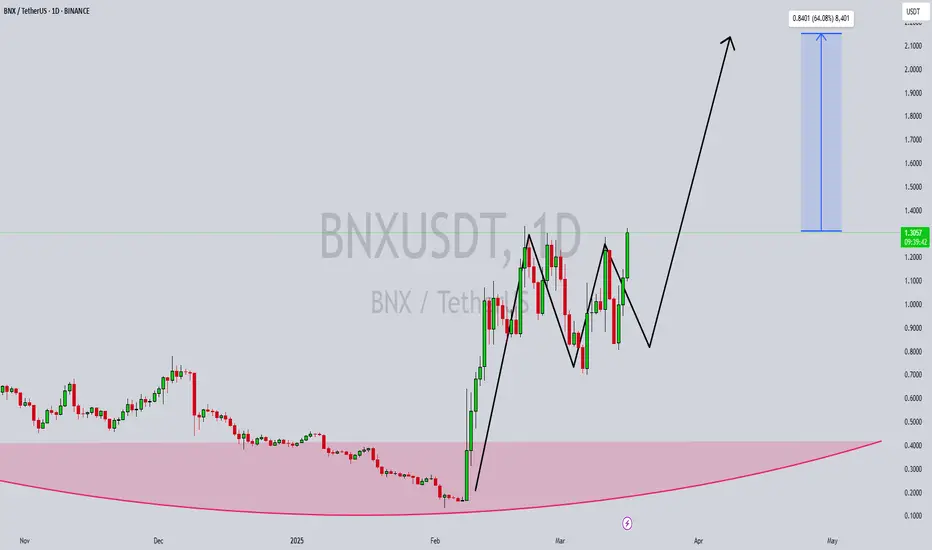
BNXUSDT Breakout Imminent: High Volume Signals Potential 50-60%BNXUSDT is currently forming a strong breakout pattern, showing signs of bullish momentum. The trading volume is increasing, indicating that investors are actively participating in this move. With a solid structure and a breakout looking imminent, BNXUSDT could be set for a significant rally. Traders are closely watching this level, anticipating a strong price surge once the resistance is broken.
Technical analysis suggests that the price is consolidating just below a key breakout point. A successful breakout could trigger a sharp upward movement, with potential gains ranging from 50% to 60%+. The combination of strong volume and market interest further supports this bullish scenario. As the buying pressure builds up, BNXUSDT could soon enter a high-momentum phase, attracting more investors looking for profitable opportunities.
With the crypto market showing increased volatility and potential, BNXUSDT remains a promising asset to watch. Traders and investors are advised to keep an eye on this pair as it moves closer to its breakout zone. A confirmed breakout with sustained volume could validate the anticipated bullish run, offering traders a lucrative upside potential.
✅ Show your support by hitting the like button and
✅ Leaving a comment below! (What is your opinion about this coin)
Your feedback and engagement keep me inspired to share more insightful market analysis with you!
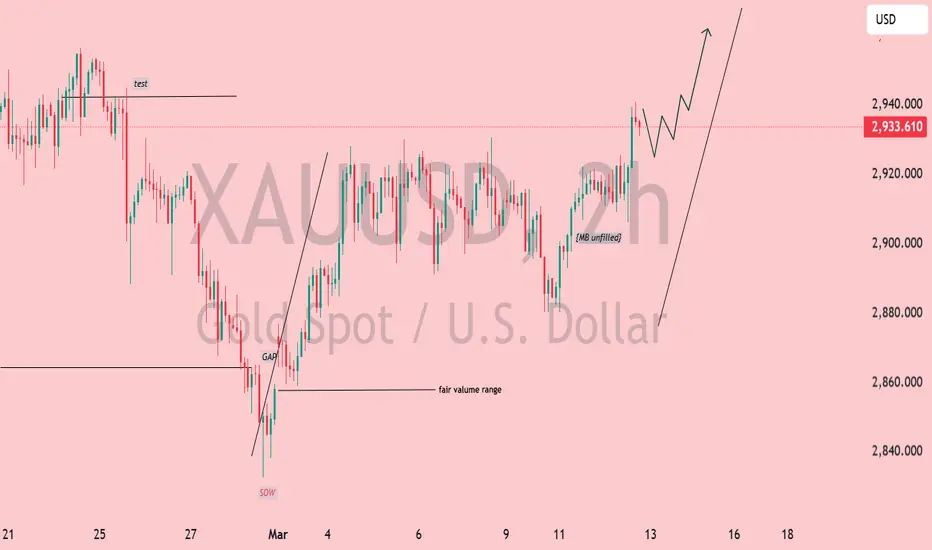
XAU/USD Bullish Outlook: Wyckoff Accumulation & Breakout PotentXAU/USD (Gold) - 2H Chart Analysis 🏆📈
🔹 Wyckoff Structure Insight
The chart shows signs of a Wyckoff Accumulation phase.
UTAD (Upthrust After Distribution) at the previous highs suggests a liquidity grab.
Test of the resistance level before a strong rejection downward.
SOW (Sign of Weakness) was observed, but buyers regained control.
🔹 Key Technical Levels
Fair Value Range marked below, showing a potential area of demand.
Unfilled Imbalance (EMB unfilled) signals an area where price might revisit before continuing upward.
Gap below indicates a previous liquidity sweep before the bullish reversal.
🔹 Trend & Price Action
The 200 EMA (red line) is holding as dynamic support.
Current price action is showing higher lows and bullish structure development.
Projected bullish move 📈 is expected to test the $2,940+ region.
🔹 Trading Bias: Bullish ✅
A retracement to the EMA or minor pullback could offer re-entry opportunities.
Invalidation level: Below $2,900, where momentum could shift bearish.
🚀 Gold remains strong; watch for breakouts above $2,940!
Booze Wars... How DAX could react?Now it's time for US and EU to have their public tariff battle. Given that wine, champagne and beer are a huge part of EU export into the US, there might be some pain felt among the MARKETSCOM:DE30 bulls. Let's dig in.
XETR:DAX
Let us know what you think in the comments below.
Thank you.
74.2% of retail investor accounts lose money when trading CFDs with this provider. You should consider whether you understand how CFDs work and whether you can afford to take the high risk of losing your money. Past performance is not necessarily indicative of future results. The value of investments may fall as well as rise and the investor may not get back the amount initially invested. This content is not intended for nor applicable to residents of the UK. Cryptocurrency CFDs and spread bets are restricted in the UK for all retail clients.

WHY GOLD IS BULLISH??? DETAILED TECHNICAL AND FUNDAMENTALSXAUUSD is currently trading at 2940 after successfully breaking out of a **bullish pennant** pattern, signaling a continuation of the upward trend. This breakout suggests a strong bullish wave is forming, with a target of 3000 in sight. The bullish pennant is a well-known pattern that occurs after a strong price surge, followed by consolidation before the next leg higher. With the breakout already confirmed, buyers could push gold toward new highs.
From a technical perspective, the breakout above the pennant’s resistance indicates growing bullish momentum. If xauusd sustains above 2930-2940, further upside movement is likely, with 2970 as the next key resistance before reaching 3000. Volume confirmation and a retest of the breakout zone could strengthen the bullish case. Traders should watch for price action signals, such as bullish candlestick formations, to confirm the continuation of the uptrend.
On the fundamental side, gold remains well-supported due to **global economic uncertainty, central bank gold purchases, and inflation concerns**. The Federal Reserve’s monetary policy decisions will also play a crucial role in xauusd’s next move. A weaker us dollar, lower bond yields, or increased risk-off sentiment could further drive demand for gold as a safe-haven asset, fueling the rally toward 3000 and beyond.
In summary, xauusd has completed a **bullish pennant breakout**, setting the stage for a strong push toward 3000. Traders should monitor key resistance levels and volume confirmations for potential buying opportunities. If the momentum sustains, gold could continue its bullish trajectory, offering a high-probability trade setup.

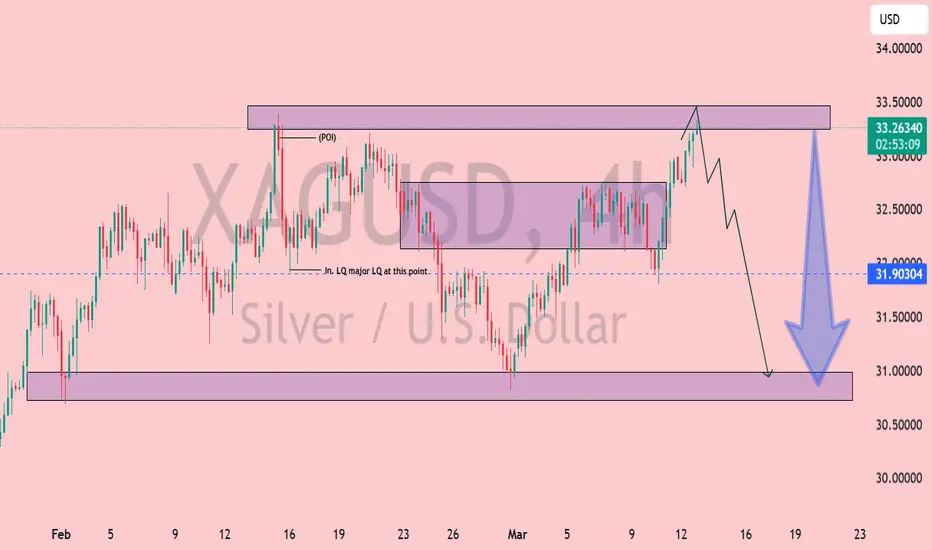
XAG/USD Bearish Reversal Incoming? | Silver 4H Analysis📉 XAG/USD (Silver) 4H Chart Analysis – Bearish Setup 🚨
🔍 Key Observations:
Supply Zone (POI - Point of Interest) 🟪: The price is approaching a strong resistance area around $33.23 - $33.50.
Liquidity Grab (LQ) & Rejection Expected ❌: The previous major liquidity zone (LQ) suggests a possible fake breakout or rejection.
Bearish Projection ⬇️: The chart outlines a potential reversal after reaching resistance, leading to a drop towards $31.00 - $30.50.
📌 Trading Plan:
Short Entry 🎯: Around $33.20 - $33.50 (if price rejects this area).
Target 🎯: Major demand zone at $31.00.
Stop Loss 🚨: Above $33.60 (to avoid fakeouts).
Confirmation Needed 📊: Look for bearish candlestick patterns (e.g., engulfing, wicks, or double top formations).
⚠️ Final Thoughts:
Bearish Bias ⚠️ unless price breaks and holds above $33.50.
Monitor market conditions 🧐—news and fundamentals could shift momentum.
🔥 Trade smart! What do you think?