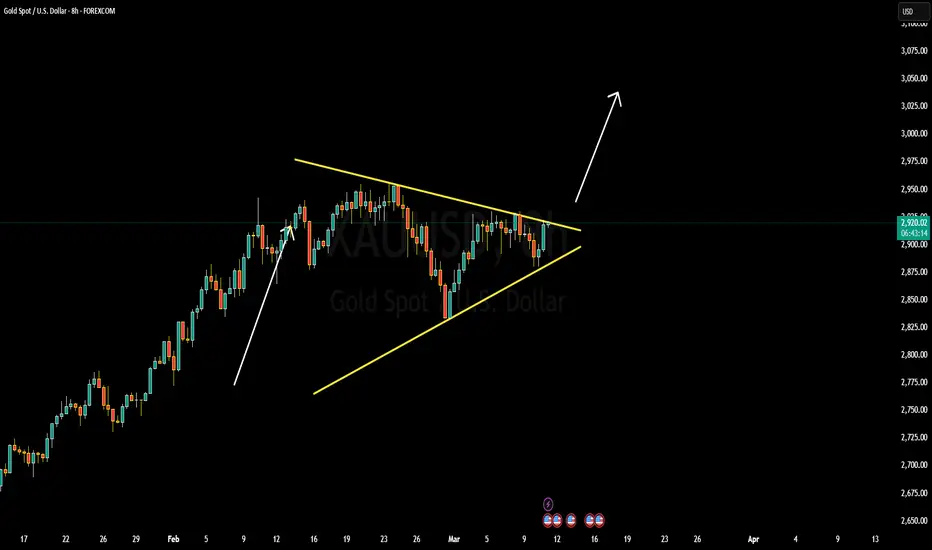
XAUUSD Bullish Pennant Breakout: Gold Aiming for 3020XAUUSD is currently consolidating around 2920, forming a **bullish pennant pattern**, a strong continuation signal indicating potential upside momentum. Gold has been in a steady uptrend, and this consolidation phase suggests that the market is gathering strength before the next move. A breakout above the pennant resistance could push prices toward the psychological level of **3000**, with an extended target of **3020**.
From a technical perspective, a **bullish pennant** is characterized by a brief consolidation after a strong rally, typically leading to another upward surge. If gold **breaks out with strong volume**, it could confirm further bullish momentum. **Key resistance levels** to watch are 2950 and 2970, while **strong support levels** are at 2900 and 2880. A successful breakout could attract more buyers, fueling a strong rally toward the **3020 level**.
On the **fundamental side**, gold remains well-supported by **geopolitical tensions, central bank gold purchases, and expectations of Federal Reserve rate adjustments**. If economic uncertainty increases or the Fed signals a more dovish stance, gold prices could gain further momentum. Additionally, a weaker **U.S. dollar and falling bond yields** could add fuel to the bullish case for XAUUSD.
In conclusion, XAUUSD is forming a **bullish pennant**, signaling a potential breakout toward 3020. **Traders should watch for volume confirmation and breakout signals above resistance levels** to enter positions strategically. If the breakout is confirmed, we can expect gold to gain further strength, presenting a great buying opportunity for traders.
Technical
Gold (XAU/USD) – Bearish Momentum Towards Key SupportGold (XAU/USD) Technical Analysis – 1H Chart 🏆📉
🔹 Overview:
The chart shows Gold (XAU/USD) in a downtrend after failing to break above resistance.
Key zones are marked: Resistance (~$2,920 - $2,960) and Support (~$2,840 - $2,860).
A potential bearish move is suggested towards the support area.
📌 Resistance Zone (~$2,920 - $2,960) 🚧
Price has struggled to break this level multiple times, leading to rejection.
Sellers are likely in control, pushing the price lower.
📌 Support Zone (~$2,840 - $2,860) 🛡️
This area has historically acted as a strong demand zone.
Possible price reaction here, with a bounce back up if buyers step in.
📉 Bearish Scenario:
A retest of minor resistance (~$2,900) before continuing downward.
If price reaches support, a reversal or further breakdown could occur.
📈 Bullish Recovery?
Only a strong breakout above $2,920 would shift momentum to bullish.
🔥 Conclusion:
Short-term bias: Bearish 📉
Key watch: Price action at support (~$2,840) for possible bounce 📊
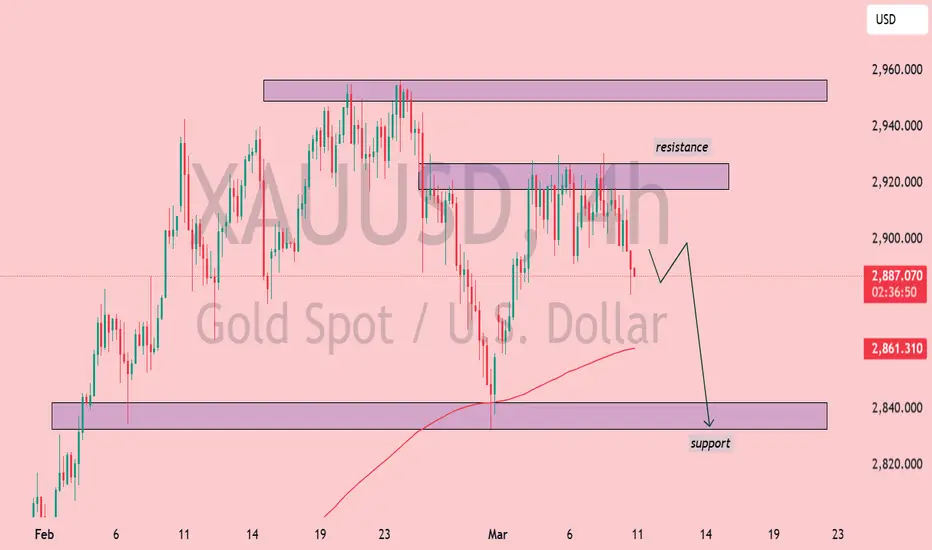
XAUUSD 4H Analysis: Rejection at Resistance – Drop to $2,850?📉 XAUUSD (Gold) 4H Analysis – March 5, 2025
Key Levels:
Resistance: Around $2,920 - $2,940 (price is testing this zone)
Support: Around $2,850 - $2,860 (marked as a demand zone)
Market Structure & Projection:
Gold is currently at a resistance level, which has previously acted as a strong supply zone.
The price is showing signs of rejection at resistance, indicating a potential bearish move.
The chart suggests a drop towards the $2,850 support level if price fails to break above resistance.
Indicators & Confluence:
200 EMA (Red Line): Located below the price, showing an overall bullish trend, but short-term correction is possible.
Bearish Structure: The recent push to resistance followed by rejection hints at a potential sell-off.
Liquidity Grab? If price briefly spikes above resistance and then reverses, a deeper drop could be confirmed.
Trading Bias & Strategy:
📉 Bearish Scenario: If rejection at resistance holds, price could head towards $2,850 support.
📈 Bullish Breakout?: If price breaks & closes above resistance with strong volume, upside continuation could be possible.
⚠ Watch for price action at resistance before taking trades. A breakout or rejection confirmation is key.
🔥 What’s Your Take? Bullish or Bearish? Let me know! 🚀📊

RAREUSDT Poised for Breakout from Falling Wedge – High Volume SuperRare (RARE) is currently forming a falling wedge pattern on the daily chart, a technical setup often indicative of a potential bullish reversal. This pattern is characterized by converging trendlines that slope downward, suggesting a decrease in selling pressure and the possibility of an impending breakout to the upside.
The trading volume for RARE has been robust, reinforcing the likelihood of a significant price movement upon breakout. Elevated volume during the formation of a falling wedge typically signifies growing investor interest and confidence in the asset's future appreciation.
Technical analysis further supports this optimistic outlook. Indicators such as the Moving Average Convergence Divergence (MACD) are showing bullish signals, while the Exponential Moving Averages (EMAs) and Relative Strength Index (RSI) are neutral, suggesting that RARE is poised for a potential upward surge
Given these factors, RARE is anticipated to achieve gains ranging from 180% to 200% or more upon a confirmed breakout. The combination of a well-defined falling wedge pattern, substantial trading volume, and supportive technical indicators suggests that RARE may experience a significant price increase in the near future.
✅ Show your support by hitting the like button and
✅ Leaving a comment below! (What is your opinion about this coin)
Your feedback and engagement keep me inspired to share more insightful market analysis with you!

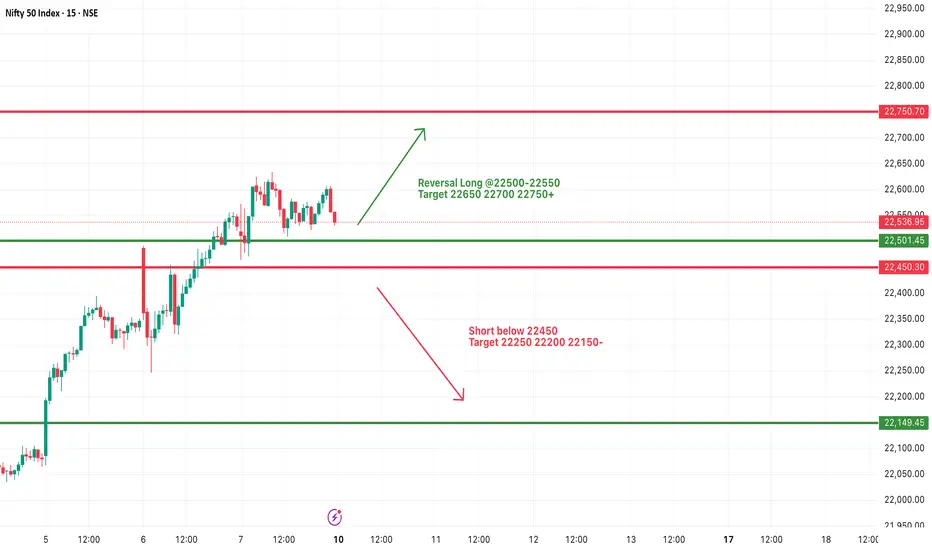
#NIFTY Intraday Support and Resistance Levels - 10/03/2025Flat opening expected in nifty near 22550 level. Any bullish side rally only expected if nifty sustain above 22500 level. If nifty gives upside movement then there will be nearest resistance at 22750 and expected reversal from this level. Strong downside expected if nifty starts trading below 22450 level.
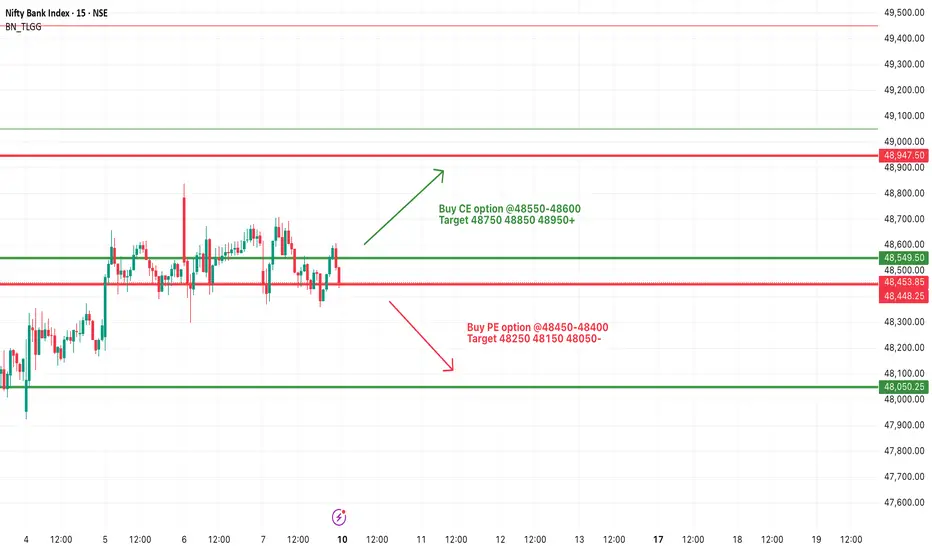
[INTRADAY] #BANKNIFTY PE & CE Levels(10/03/2025)Today will be flat opening expected in index. It will open near 48500 level. After opening any bullish side rally only expected if banknifty starts trading and sustain above 48550 level. Strong downside movement possible if banknifty gives breakdown of 48450 zone. Downside 48050 level expected after the breakdown.
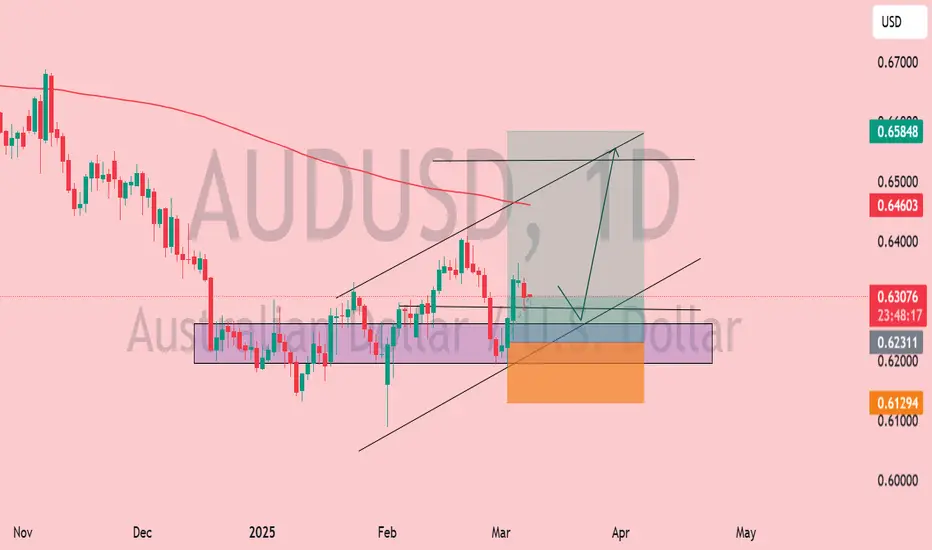
AUD/USD at Critical Support – Breakout or Breakdown? 🔍 AUD/USD Daily Chart Analysis – March 9, 2025
Key Observations:
Ascending Channel 📈
The price is moving within an upward channel, indicating a short-term bullish trend.
Support & Resistance Zones 🟦🟥
Support: Around 0.6231 - 0.6200 (blue zone). A breakdown below this could push the price lower toward 0.6129 (orange zone).
Resistance: The 0.6460 - 0.6584 level is the next major hurdle for bulls.
200-Day Moving Average (Red Line) 🔴
The price is currently below the 200-MA, indicating a long-term bearish sentiment. However, a breakout above this level could signal a trend reversal.
Potential Scenarios 📊
✅ Bullish Case: If the price sustains above 0.6231, we could see a bounce towards 0.6460 - 0.6584 in the coming weeks.
❌ Bearish Case: A break below 0.6231 could push the price toward the 0.6129 - 0.6100 region before finding support.
Trade Plan 🎯
Buy Zone: Around 0.6231 with a stop-loss below 0.6200.
Sell Zone: If price rejects 0.6460, a short position could be considered with a stop above 0.6584.
📊 Conclusion: AUD/USD is at a key decision point. Bulls need to hold support for further upside. A breakdown could trigger a bearish move.
XAU/USD Weekly Outlook: Potential Pullback or Breakout?XAU/USD Weekly Chart Analysis 🏆📉📈
1️⃣ Current Price: $2,919.35
2️⃣ Key Observations:
Distribution on H4: Potential sign of a short-term reversal. 📉
Divergence: Suggests weakening momentum at the highs, increasing the probability of a pullback. ⚠️
Multiple Unfilled Mitigation Blocks (MB): Areas of interest where price may retrace for liquidity grabs. 🧐
Fair Volume Ranges: Notable levels around $2,700 - $2,500, where price might stabilize if a correction occurs. 🔄 3️⃣ Potential Scenarios:
If price breaks down from the H4 distribution, expect a retracement toward the nearest MB unfilled levels (~$2,700).
If bulls hold momentum, breaking above current resistance (~$3,000) could push prices into price discovery. 🚀
💡 Conclusion: Watch for price action around the unfilled MBs and fair volume ranges. A correction seems likely unless buyers step in aggressively.
🔥 Trade Wisely & Manage Risk! 🔥

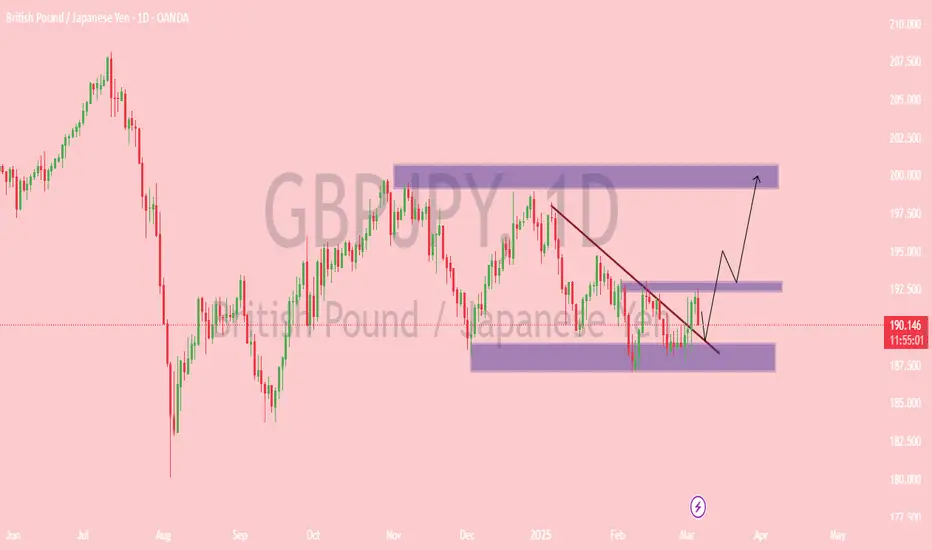
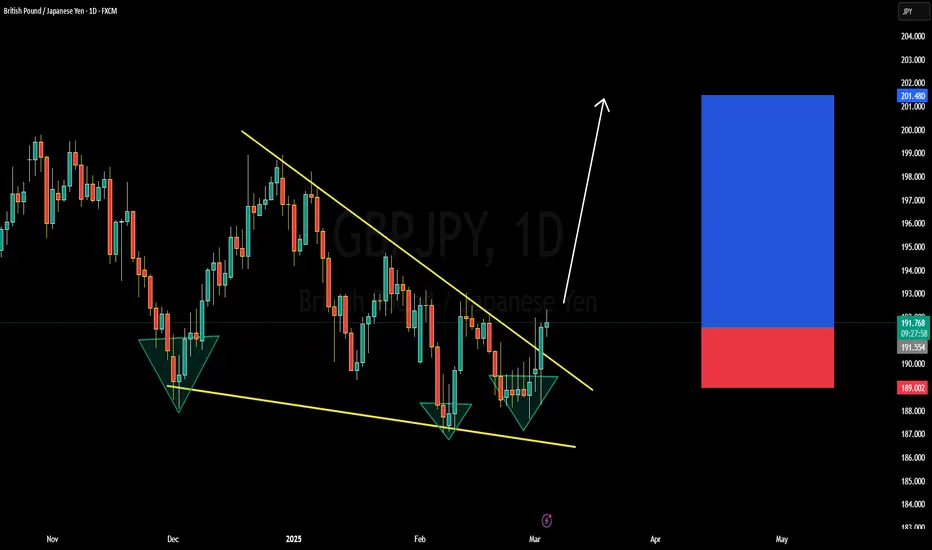
GBP/JPY Potential Bullish Breakout – Key Levels to Watch:
📉 Descending Trendline Breakout Setup
The price has been in a downtrend, following a descending trendline.
It is currently testing this trendline with signs of potential breakout.
📊 Key Support & Resistance Zones
Support Zone (~187.5 - 189.0): Price has bounced multiple times from this area.
Resistance Zones (~192.5 & ~200.0): First target is around 192.5, then 200.0 if momentum continues.
📈 Possible Bullish Scenario
If price breaks the trendline and holds above 192.5, we could see an upward push towards 200.0.
The expected move follows the drawn path: breakout → retest → continuation.
⚠️ Risk Factors
If the price fails to break above 192.5, it might return to the support zone.
A break below 187.5 would invalidate the bullish outlook.
Overall, this setup suggests watching for a breakout confirmation above resistance before entering long trades. 🚀
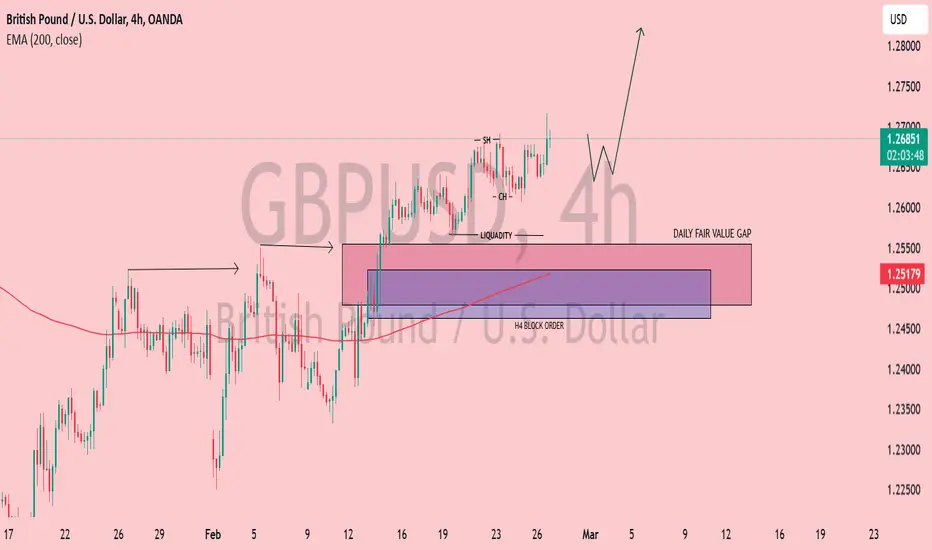
GBP/USD 4H Analysis – Bullish Momentum & Key Demand Zones📊 GBP/USD 4H Analysis – Smart Money Concepts (SMC) Perspective
Current Market Structure:
📈 Bullish Momentum: The price is currently trending upwards after breaking a short-term high (SH) and liquidity zone.
🔄 Change of Character (CH): Confirmed as the price broke previous resistance, signaling a possible trend continuation.
Key Zones & Levels:
🟣 H4 Block Order (Demand Zone): Marked in purple, this area aligns with a strong order block, indicating potential buying interest if the price retraces.
🟥 Daily Fair Value Gap (FVG): Above the demand zone, acting as a potential area for price rebalancing before resuming the uptrend.
🔴 200 EMA at 1.25179: Serving as dynamic support, aligning with the demand zone for potential buy setups.
Potential Scenarios:
📉 Retracement to Demand Zone (1.2500 - 1.2550)
Buyers may step in at the H4 Block Order & Fair Value Gap.
Price could form a higher low before continuation.
📈 Bullish Expansion to New Highs (1.2750 - 1.2800)
If demand holds, expect a strong push-up towards liquidity areas.
Breakout could trigger momentum buying.
Bias:
✅ Bullish (Higher Highs & Higher Lows Forming)
⚠️ Caution: If price breaks below 1.2500, sentiment may shift bearish.
Why GBPJPY is Bullish? Detailed Technicals and fundamentalsGBPJPY has successfully broken out of a falling wedge pattern, signaling a strong bullish momentum ahead. The breakout confirms a potential trend reversal, with buyers stepping in to push the price higher. Currently trading around 191.500, the pair is expected to gain over 500 pips, targeting the 198.500 level. A falling wedge breakout is typically a bullish continuation signal, and with increasing buying pressure, GBPJPY could see a steady upward move in the coming sessions.
From a technical standpoint, this breakout suggests that the pair has overcome a period of consolidation and is now positioned for an extended rally. Key resistance levels ahead will be 193.000 and 195.000 before reaching the 198.500 target. A strong bullish candlestick confirmation above these levels will add more confidence to this setup. Traders should also watch for retests of the breakout zone, as they often provide good entry opportunities before further upside movement.
On the fundamental side, GBPJPY is influenced by Bank of Japan’s (BoJ) ultra-loose monetary policy and the UK’s economic outlook. If the BoJ continues to maintain its dovish stance, the Japanese yen may weaken further, providing additional fuel for GBPJPY's bullish run. Additionally, any positive economic data from the UK, such as strong GDP growth or inflation control, could support further gains. Given the technical breakout and fundamental factors, GBPJPY looks well-positioned for a strong rally toward 198.500 in the near term.
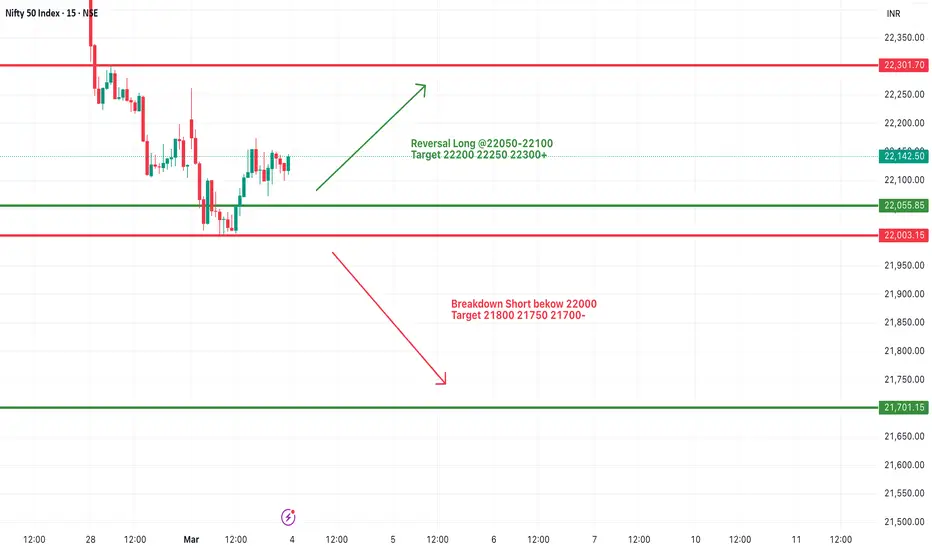
#NIFTY Intraday Support and Resistance Levels - 04/03/2025Gap down opening expected in nifty near the 22050 level. After opening if nifty sustain above 22050 level then only expected upside movement in index. Upside 22300 level will act as a strong resistance for today's session. Major downside fall expected in nifty in case it's starts trading below 22000 level. This downside can goes upto 21700 level.
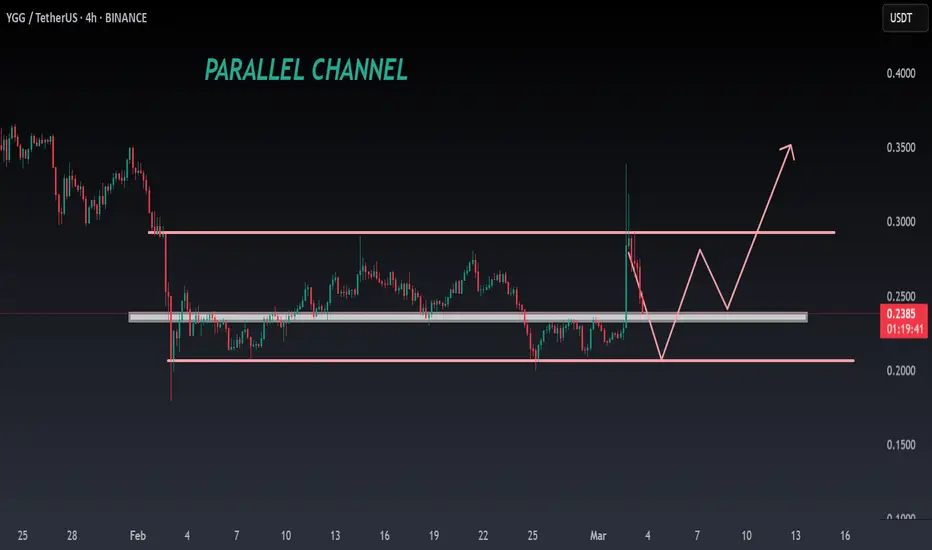
YGG ANALYSIS🚀#YGG Analysis :
🔮#YGG is consolidating in a parallel channel.... currently falling from its resistance zone. It is trading above its major support zone and there maybe a small retest towards lower supprt level and after that we will see a bullish move📈📈
🔰Current Price: $0.2400
🎯 Target Price: $0.2900
⚡️What to do ?
👀Keep an eye on #YGG price action. We can trade according to the chart and make some profits⚡️⚡️
#YGG #Cryptocurrency #TechnicalAnalysis #DYOR
Bitcoin Breakdown: Bearish Retest or Further Crash to $60K?Bitcoin (BTC/USD) Daily Chart Analysis 🧐📉
Key Observations:
Major Breakdown Below Support 🚨
BTC has broken below a key support zone around $85,000 (which also aligns with the 200 EMA at $85,602).
This signals further downside potential if price fails to reclaim this level.
Bearish Retest Expected 🔄
The price may attempt to retest the broken support (~$85,000–$90,000) before continuing downward.
If rejected, BTC could drop to lower demand zones.
Next Major Support: $70,000 & $60,000 Zones 📉
The chart suggests a downside move toward $70,000, with a final target around $59,932.
These levels have historical significance as support zones.
RSI Shows Oversold Conditions 📊
The RSI is at 24.86, which is deep into oversold territory.
This could mean a temporary relief bounce, but overall momentum remains bearish.
Possible Scenario 📍
If BTC fails to reclaim $85,000, expect a move down to $70,000–$60,000.
A reclaim of $90,000+ would invalidate the bearish structure, leading to another attempt at $100,000+.
Conclusion: Bears in Control! 🐻⚠️
The trend remains bearish unless BTC reclaims key resistance zones.
Short-term bounce possible, but lower targets remain valid unless $85,000–$90,000 is reclaimed.
🔥 Trade Smart! Use Risk Management! 🔥 Let me know if you need specific trade setups! 🚀

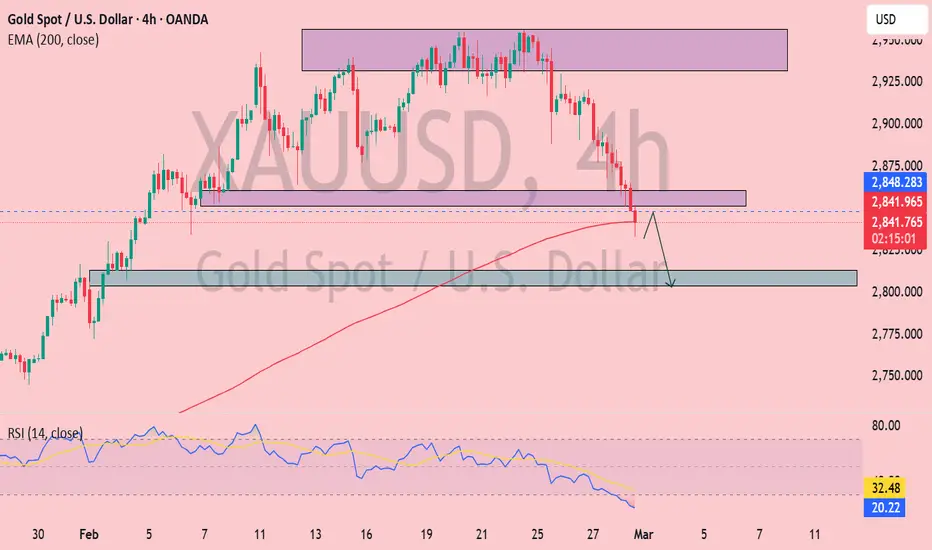
Gold (XAUUSD) 4H Analysis: Bearish Breakdown with Potential PullGold (XAUUSD) 4H Chart Analysis 📉✨
1️⃣ Price Action
Gold is in a downtrend, recently breaking below a key support zone (purple).
It is trading below the 200 EMA (2,841.953), confirming bearish sentiment.
A minor pullback to the broken support zone is expected before further downside.
2️⃣ Support & Resistance
Resistance Zone: Around 2,875 - 2,900 (previous supply area).
Immediate Support: 2,800 - 2,810 (highlighted demand zone).
3️⃣ RSI (Relative Strength Index) 📊
Oversold at 19.98 ⚠️ → This suggests a potential short-term bounce, but trend remains weak.
32.46 level is a key resistance on RSI; breaking above could signal a recovery.
4️⃣ Bearish Bias 📉
If price retests the broken support and rejects, we could see a drop towards 2,800.
RSI suggests possible relief before further downside.
Trading Outlook 🔥
✅ Bearish Scenario: Sell on a rejection of the broken support, targeting 2,800.
🚨 Bullish Case: If Gold reclaims 2,850+, it might retest the 200 EMA and higher levels.
Would you like an updated analysis if the price action changes? 🚀📊
EUR/USD Rejection at Key Resistance – Bearish Drop Incoming?EUR/USD 4H Chart Analysis 📉🔥
Key Observations:
Resistance Zone (Supply Area) 🚨
Price has tested a strong resistance level (marked by the shaded box) near 1.0500.
Multiple rejections in this area suggest selling pressure is strong.
Potential Reversal Setup 🔄
The price has wicked into resistance and started showing weakness.
A lower high structure could be forming, indicating a possible trend shift.
Bearish Outlook 🐻📉
A break below recent support would confirm a sell-off targeting the lower price range.
The chart suggests a potential move towards 1.0350 - 1.0300 levels.
The 200 EMA (1.0425) is acting as dynamic support, but a break below it will accelerate the drop.
Liquidity Grab & Stop Hunt 🎯
Price action could have trapped buyers before reversing.
A potential stop-loss hunt above the previous highs before a drop.
Trading Plan 💡
✅ Sell Bias: Look for confirmations like bearish engulfing candles or break below 1.0450.
❌ Invalidation: A clean breakout above 1.0510 cancels the bearish setup.
🎯 Target Levels: 1.0350, 1.0300.
🔥 Final Verdict: Bearish setup forming. Watch for breakdown confirmation! 🚀

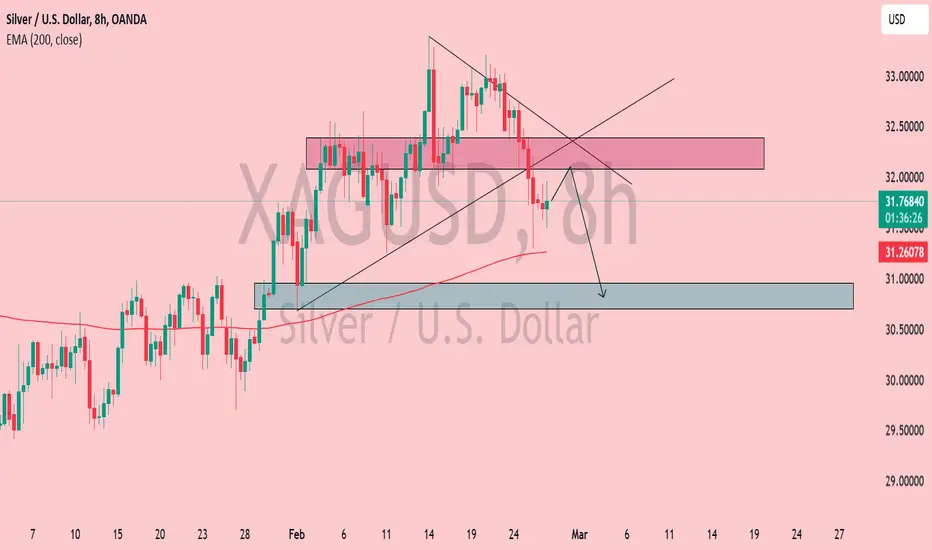
Silver (XAG/USD) Bearish Retest – Drop to $31 Incoming?Silver (XAG/USD) - 8H Chart Analysis
📉 Bearish Setup in Play
Breakout & Retest: Price broke down from a wedge pattern and is currently retesting the supply zone (highlighted in red).
EMA (200) Support: The 200 EMA (31.26) is acting as dynamic support. If price holds below, further downside is expected.
Bearish Target: A move towards the demand zone (30.80 - 31.00) (blue area) is anticipated.
Key Resistance: The rejected zone around 32.00 remains crucial for trend direction.
💡 Trade Idea:
If rejection is confirmed at the supply zone, short positions targeting 31.00 look promising.
A break above 32.00 could invalidate the bearish outlook.
🔥 Watch for confirmation! 🚀
US PCE could be the catalyst for USDJPY to make a stronger moveMARKETSCOM:USDJPY is currently flirting with the area around the 149.00 hurdle. In order to shift our attention to some lower areas, a drop below the lowest point of December 2024 is needed. But what about the US PCEs? Let's dig in...
FX_IDC:USDJPY
What are your thoughts on this?
74.2% of retail investor accounts lose money when trading CFDs with this provider. You should consider whether you understand how CFDs work and whether you can afford to take the high risk of losing your money. Past performance is not necessarily indicative of future results. The value of investments may fall as well as rise and the investor may not get back the amount initially invested. This content is not intended for nor applicable to residents of the UK. Cryptocurrency CFDs and spread bets are restricted in the UK for all retail clients.

Will DAX go for another all-time high?It seems that geopolitics are the key driving force of the MARKETSCOM:DE30 bulls. The current news on a possible end of the war in Ukraine is helping boost trader morale. Let's dig in!
XETR:DAX
What are your thoughts on this?
74.2% of retail investor accounts lose money when trading CFDs with this provider. You should consider whether you understand how CFDs work and whether you can afford to take the high risk of losing your money. Past performance is not necessarily indicative of future results. The value of investments may fall as well as rise and the investor may not get back the amount initially invested. This content is not intended for nor applicable to residents of the UK. Cryptocurrency CFDs and spread bets are restricted in the UK for all retail clients.

XAU/USD Pullback or Reversal? Key Support Zone in Focus!📊 Gold (XAU/USD) Daily Chart Analysis – Feb 16, 2025
🔹 Current Price: $2,882.48 (-1.57%)
🔻 Recent High: $2,939.98
🔻 Recent Low: $2,877.03
🔴 200 EMA: $2,562.04 (Long-term support)
🧐 Key Observations:
✅ Strong Uptrend: Price has been in a bullish trend since late 2024.
✅ Support Zone: A key demand zone around $2,850 - $2,870 (highlighted in blue).
✅ Trendline Retest: The price is testing the trendline, which could act as support.
📉 Possible Scenarios:
🔹 Bullish Case: If buyers step in at the support zone, we could see a bounce towards $2,950 - $3,000 🚀.
🔹 Bearish Case: A breakdown below $2,850 may trigger a deeper pullback to $2,800 - $2,750 ❄️.
🎯 Trading Plan:
📌 Buy Setup: Look for bullish confirmation (e.g., reversal candles) in the support zone before entering long.
📌 Sell Setup: If the price closes below $2,850, short positions could be considered with targets near $2,750.
🔥 Final Thoughts: Despite today’s pullback, gold remains bullish unless key support levels break. Watching price action around the blue zone will be crucial!
📢 Traders, what’s your take? Are we bouncing or breaking down? Let’s discuss! 👇💬 #Gold #XAUUSD

Federal Bank Close To Fib LevelsAs of 25th Feb 2025, The Federal bank, on a monthly timeframe is heading towards its 50% fibonacci levels on monthly timeframe.
However, on daily and weekly timeframe, the stock might look bullish but the major timeframe is contrarian to both daily and weekly timeframe.
Disclaimer: I am an NISM XV Certified research analyst, I am not SEBI registered. Hence, kindly consider this as learning about fibonacci and not a recommendation.
Please consult your investment advisor before investing.

EURUSD - the upcoming US PCE & the ECB rate decisionAt the moment, we are seeing that the bulls are fighting hard to keep MARKETSCOM:EURUSD elevated. But they are struggling to overcome some key resistance barriers. But the upside doesn't look very promising, due to the upcoming US PCE numbers and the ECB rate decision. Let's dig into the possible near-term outcome scenarios for the $FX_IDC:EURUSD.
What are your thoughts on this?
74.2% of retail investor accounts lose money when trading CFDs with this provider. You should consider whether you understand how CFDs work and whether you can afford to take the high risk of losing your money. Past performance is not necessarily indicative of future results. The value of investments may fall as well as rise and the investor may not get back the amount initially invested. This content is not intended for nor applicable to residents of the UK. Cryptocurrency CFDs and spread bets are restricted in the UK for all retail clients.

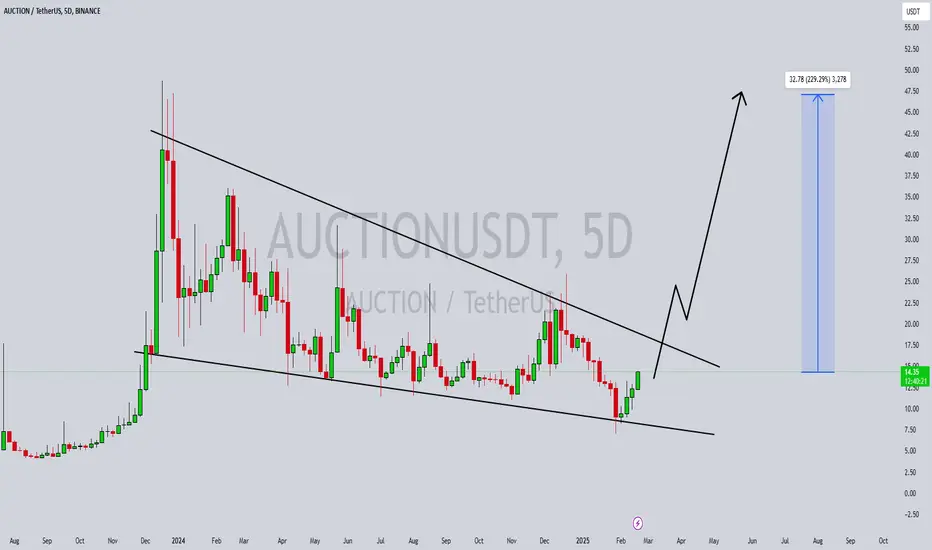
JAUCTIONUSDT Falling Wedge Pattern – 200%-220% Gains JAUCTIONUSDT is currently forming a Falling Wedge pattern, which suggests a potential breakout to the upside in the near future. A Falling Wedge pattern is typically considered a bullish reversal pattern, often occurring after a downtrend, where the price gradually narrows between two converging trendlines. This pattern indicates that the sellers' momentum is weakening, and buyers are starting to take control. Once the price breaks above the upper trendline, it could trigger a sharp upward move. With strong volume supporting this pattern, JAUCTIONUSDT could experience significant gains in the range of 200% to 220%+.
The good volume accompanying this Falling Wedge pattern is an important factor in confirming the validity of a potential breakout. Volume is crucial in ensuring that the price movement is supported by strong market participation. A breakout from a Falling Wedge typically attracts momentum traders, which can lead to a powerful rally. The growing investor interest in JAUCTIONUSDT further supports the likelihood of an upward price movement, and many traders are positioning themselves for the anticipated breakout.
As the price of JAUCTIONUSDT consolidates within the Falling Wedge, the chances of a breakout increase as the market reaches an inflection point. If the price breaks above the upper trendline with significant volume, the projected gains of 200% to 220%+ could be realized. The narrowing range within the pattern suggests that the market is ready for a decisive move, and if the breakout is sustained, the price could rise rapidly toward new highs. This makes JAUCTIONUSDT an exciting opportunity for those looking for high-reward setups.
Traders should keep a close eye on JAUCTIONUSDT as it nears the breakout point. A successful breakout from the Falling Wedge pattern could initiate a powerful price surge, offering substantial returns. With the current pattern, good volume, and increasing investor interest, JAUCTIONUSDT has the potential to deliver impressive gains in the near future.
✅ Show your support by hitting the like button and
✅ Leaving a comment below! (What is Your opinion about this Coin)
Your feedback and engagement keep me inspired to share more insightful market analysis with you!