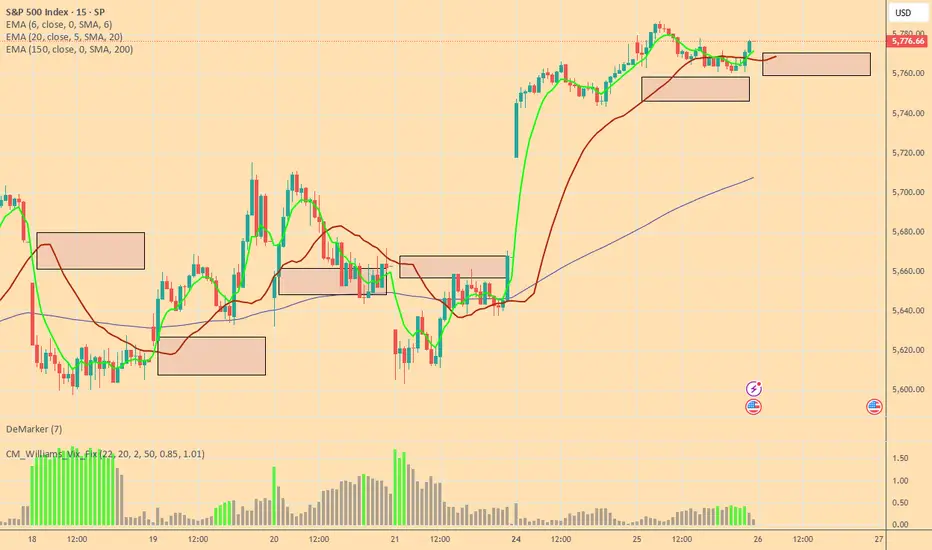
Bulls and Bears zone for 07-28-2025Last week 4 out of 5 sessions S&P 500 made new ATH. However they were all trading within a tight range.
Level to watch: 6434---6436
Technical_analysis
VZ: Verizon stock update after earningsVerizon jumped on positive results, which aligned with my bullish view on it.
Tomorrow will have its competitors T-Mobile & AT&T earnings result, this will update us on the industry as well. Most probably that I will go long on it in the next 24Hr.
Disclaimer: This content is NOT a financial advise, it is for educational purpose only.

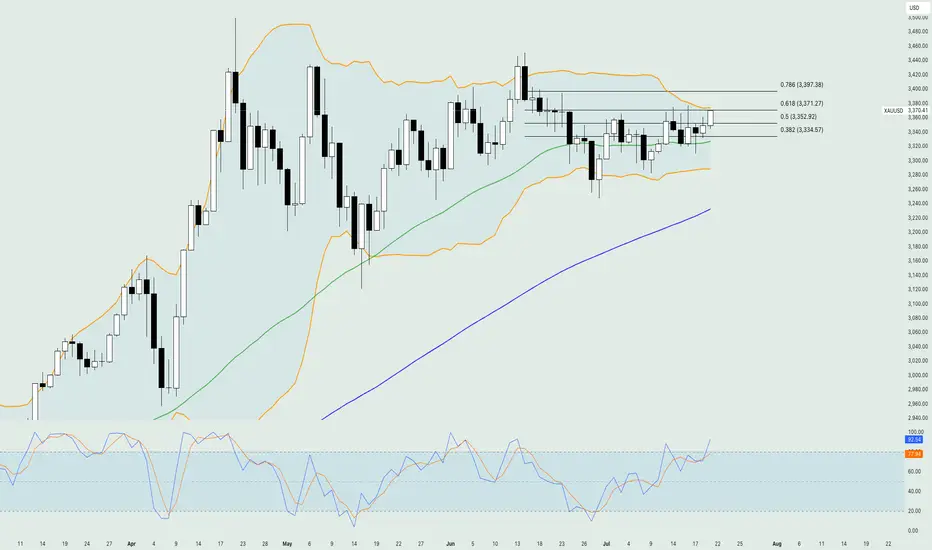
Gold - DAILY- 21.07.2025Gold held steady near $3,350 an ounce as markets opened Monday, with traders assessing mixed signals from Federal Reserve officials on the inflation impact of Trump’s tariff plans. Some Fed governors, like Waller and Bowman, signaled openness to rate cuts, while others remain cautious due to inflation risks. Trump continues pressuring the Fed to lower rates, with speculation about replacing Chair Jerome Powell. Meanwhile, EU officials are preparing for potential trade fallout as Trump’s Aug. 1 tariff deadline approaches. Gold is up over 25% this year, driven by geopolitical tensions and demand for safe-haven assets.
From a technical point of view, the price of gold found sufficient support on the 38.2% of the weekly Fibonacci retracement level and is currently testing the resistance on the 50% around $3,355. The moving averages are confirming the overall bullish trend in the market, while at the same time, the Stochastic oscillator is near the extreme overbought level, hinting at a potential bearish correction move in the upcoming sessions. The Bollinger bands are quite expanded, showing that volatility is there to support any short-term move to either side, while the level around $3,380 is the first major technical resistance area consisting of the upper band of the Bollinger bands and the 61.% of the weekly Fibonacci retracement level.
Disclaimer: The opinions in this article are personal to the writer and do not reflect those of Exness
Crude Oil -DAILY- 21.07.2025Oil prices were steady after their first weekly decline this month, as attention shifted to U.S. trade negotiations and the European Union’s push to tighten restrictions on Russian energy exports. The EU is preparing new sanctions, including a lower price cap on Russian crude, limits on fuel refined from Russian oil, banking restrictions, and bans targeting an Indian refinery and Chinese firms. Despite western sanctions, Russian oil continues flowing to China and India. Meanwhile, diesel margins in Europe remain strong, signaling tight supply.
On the technical side, the price of crude oil has failed to break below the major technical support area, which consists of the 50-day simple moving average and the 50% of the weekly Fibonacci retracement level. The Stochastic oscillator has been in the neutral level since last week hinting that there is potential for the price to move to either direction in the near short term. On the other hand, the Bollinger bands have contracted rather massively showing that volatility has dried up therefore, the recent sideways movement might extend in the upcoming sessions.
Disclaimer: The opinions in this article are personal to the writer and do not reflect those of Exness

VZ: Verizon Earnings tomorrowwith 6% dividend yield and stock price at support level on the lower channel band, this draw attention to the earnings report tomorrow pre-market hours. Focused on future outlook as well.
If all good, I will buy VZ.
Disclaimer: This content is NOT a financial advise, it is for educational purpose only.

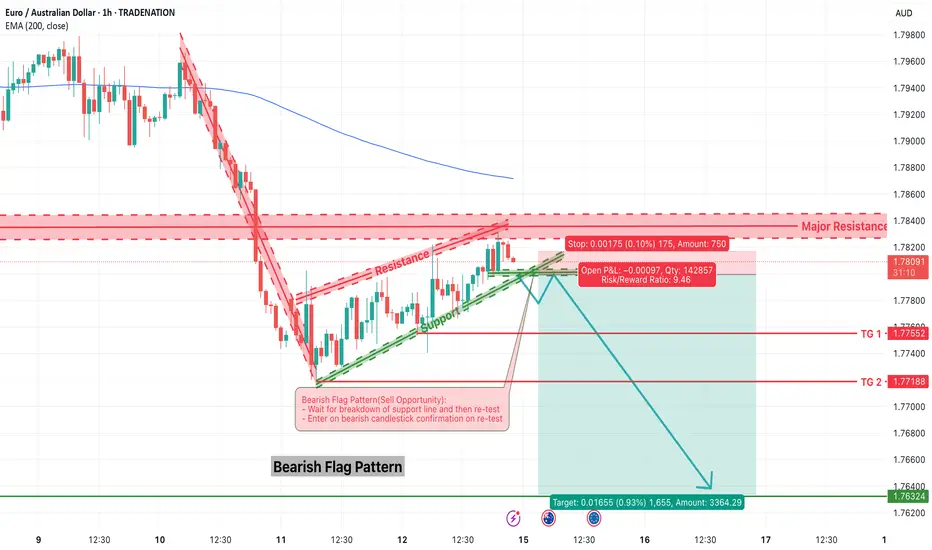
EURAUD – Bearish Flag Breakdown OpportunityThe EURAUD pair is showing signs of trend continuation via a classic bearish flag pattern formation. After a sharp decline, the market has entered into a tight consolidation channel, climbing steadily inside a sloped flag structure. Price is now testing a critical resistance area near 1.7830–1.7840 while hovering just below the 200 EMA.
This setup offers a high-probability sell opportunity — but only after confirmation.
1. Structure Overview
The initial sharp downtrend is followed by a consolidation channel — a textbook bearish flag.
Price is approaching major resistance (1.7830–1.7840) and 200 EMA, acting as a ceiling.
A breakdown from the rising support of the flag is expected to trigger a continuation toward the downside.
2. Trade Plan – Bearish Flag Breakdown
✅ Entry Plan:
Wait for a breakdown of the green support trendline (flag support).
Then, wait for a re-test of the broken support (now resistance).
Enter short only after a bearish candlestick confirmation (e.g., bearish engulfing or rejection wick) on the 15-min or 1-hour chart.
🛡️ Stop Loss:
Place the stop loss just above the major resistance zone, around 1.7835–1.7840.
🎯 Target Zones:
Target 1 (TG1): 1.7755
Target 2 (TG2): 1.7718
Final Target: 1.7632
Risk/Reward Ratio: 1:2, 1:4, 1:9.4+
3. Why This Trade Makes Sense
Bearish Flag is a reliable continuation pattern in strong downtrends.
Price is failing to break above key resistance and 200 EMA.
The flag offers a tight SL and large downside potential — ideal conditions for R:R setups.
Confluence of structure, pattern, and trend all align for short bias.
4. Trade Management Tips
Scale out partial profits at TG1 and TG2, and trail stop for final target.
If breakdown fails, avoid chasing price — re-evaluate bias if price breaks above 1.7840.
5. Final Thoughts
This EURAUD chart is a textbook case of pattern + price action + resistance confluence. The flag structure is well-defined, and the reward-to-risk ratio is significantly favorable if the breakdown confirms.
📌 Watch for:
Breakdown of rising support
Retest and bearish candle
Entry only on confirmation
High-probability setups don’t require prediction — they require preparation.
=================================================================
Disclosure: I am part of Trade Nation's Influencer program and receive a monthly fee for using their TradingView charts in my analysis.
=================================================================
HINDUSTAN OIL EXPLORATION at Best Support !!This is daily chart of HINDUSTAN OIL EXPLORATION .
HINDOILEXP having a good Support zone at 162-165 level.
HINDOILEXP has formed a Falling Wedge Pattern with Support near at 165 level.
If this level is sustain , then we may see higher prices in HINDOILEXP .
Thank You !!

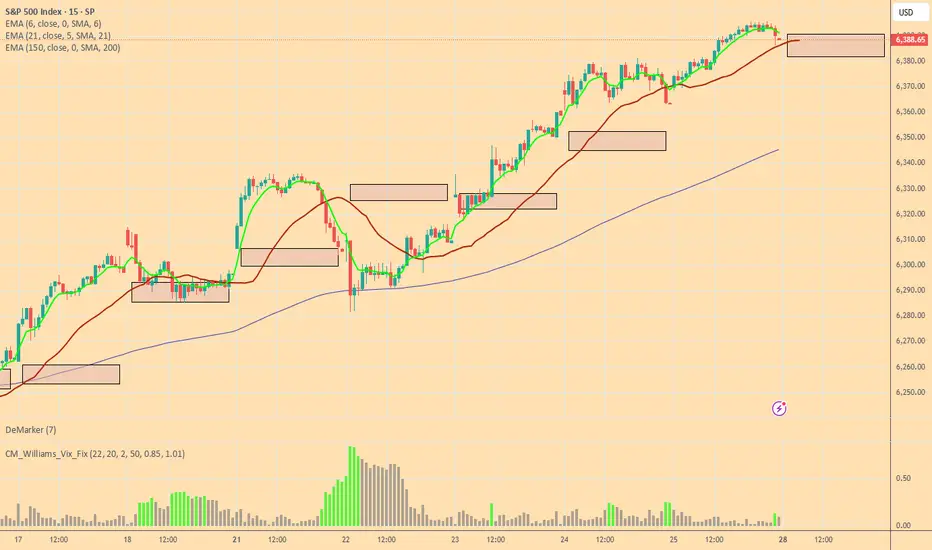
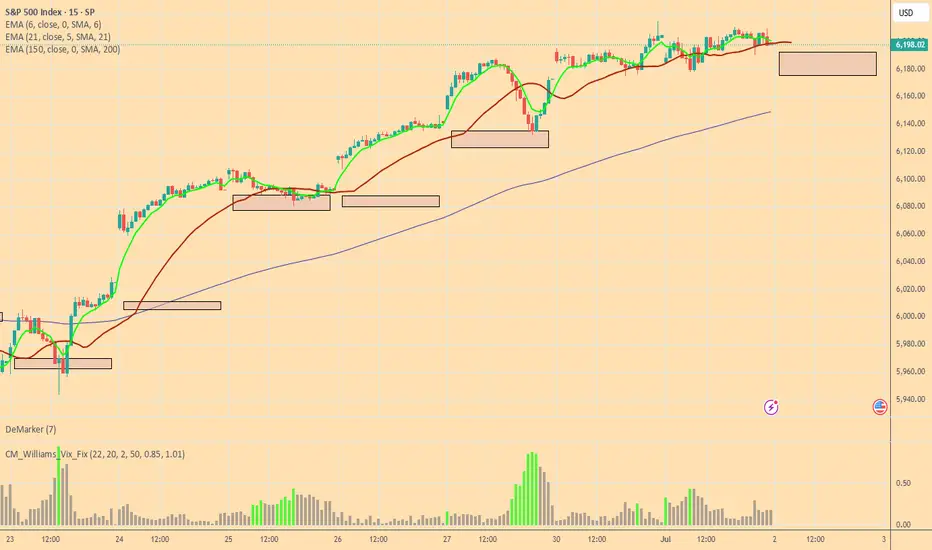
Bulls and Bears Zone for 07-02-2025S&P keeps going higher after new ATH high earlier this week. Markets could go higher for a while if we see any pullback.
Level to watch: 6232 ---6234
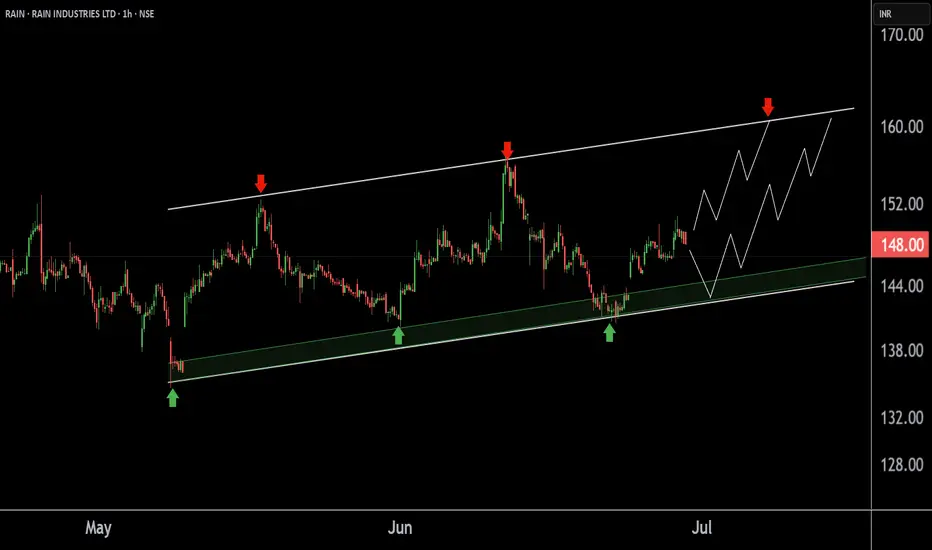
RAIN INDUSTRIES ' s Key Support Zone This is the one hour chart of RAIN INDUSTRIES.
Rain Industries is moving within an ascending parallel channel with support around 140 range and resistance around 160 range.
If this level is sustain , then we may see higher prices in the
Rain Industries
Thank You !!
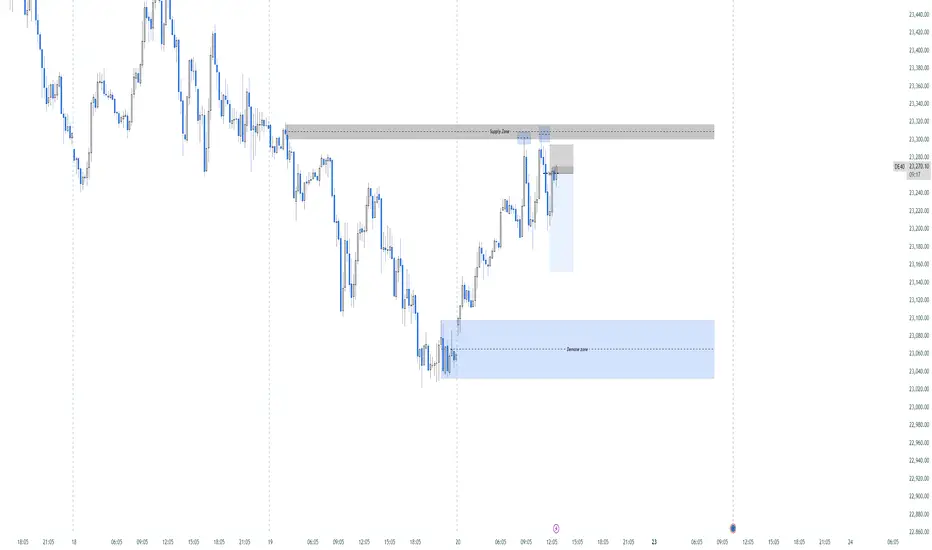
Possible Sell On Dax. Every thing taken into account, dax could shortly see a sell, given that a 1h Supply zone and 5 minute candles were rejected twice.
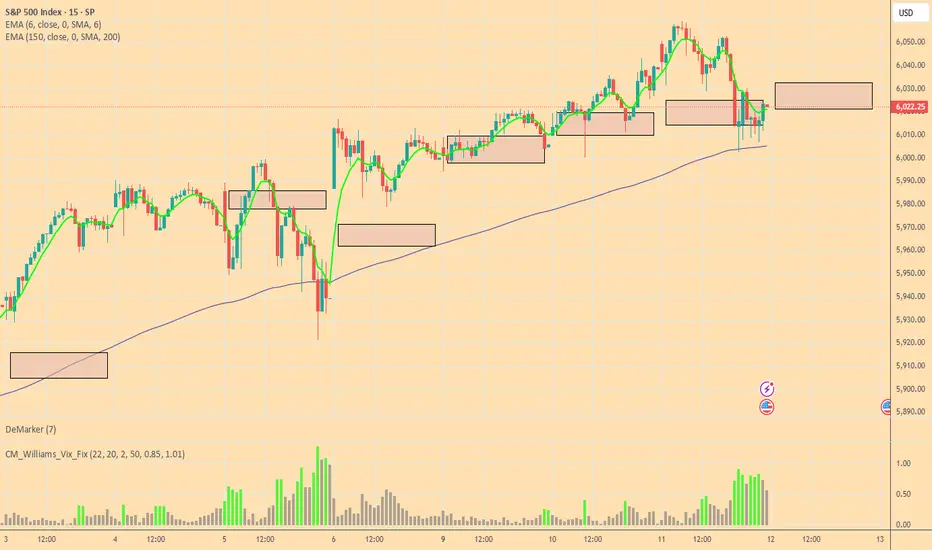
Bulls and Bears zone for 06-12-2025Overall market is continuing to rally in general.
However, market sold off during ETH session and it's trying to recover in the morning.
Level to watch : 6017----6019
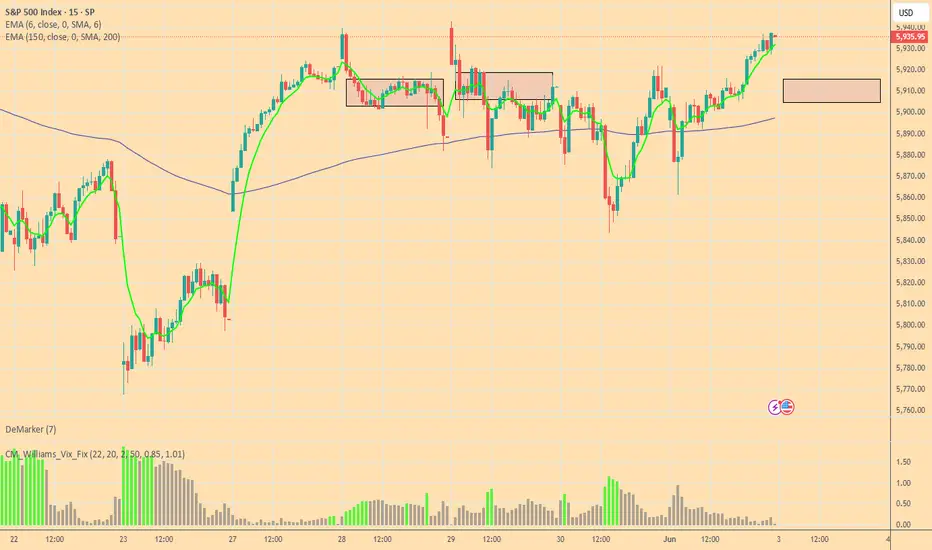
Bulls and Bears zone for 06-03-2025SPX has been trading in a range since mid May. Perhaps a pullback might be in the cards.
Level to watch: 5946 --- 5948
News to Watch:
US Factory Orders 10:00am
US JOLTS 10:00am
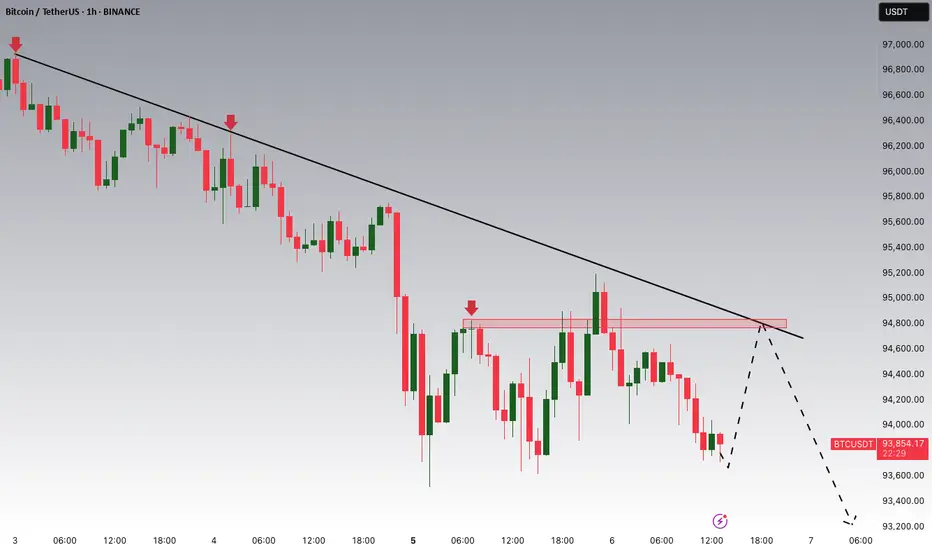
Bitcoin is Showing a New Trend!!!Hey Traders, in today's trading session we are monitoring BTC/USDT for a selling opportunity around 95k, Bitcoin is trading in a downtrend and currently is in a correction phase in which it is approaching the trend at 95k support and resistance area.
Trade safe, Joe.
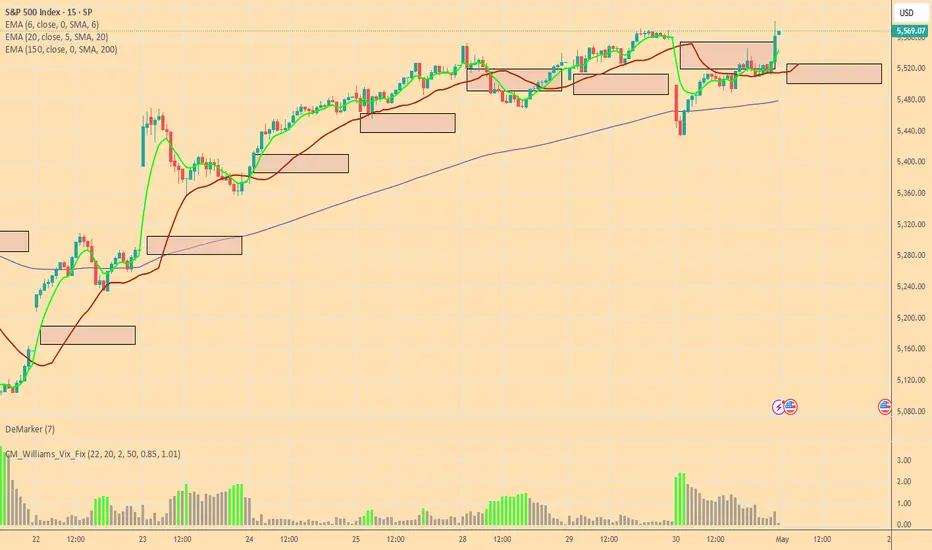
Bulls and Bears zone for 05-01-2025S&P 500 is going to have a gap up Open and finally closing gap from early last month.
Also traders could be taking profit after yesterday's big UP move.
Level to watch: 5643 ---5645
Reports to watch:
US : PMI Manufacturing Final 945am
US : ISM Manufacturing Index 1000am
US : Construction Spending 1000am
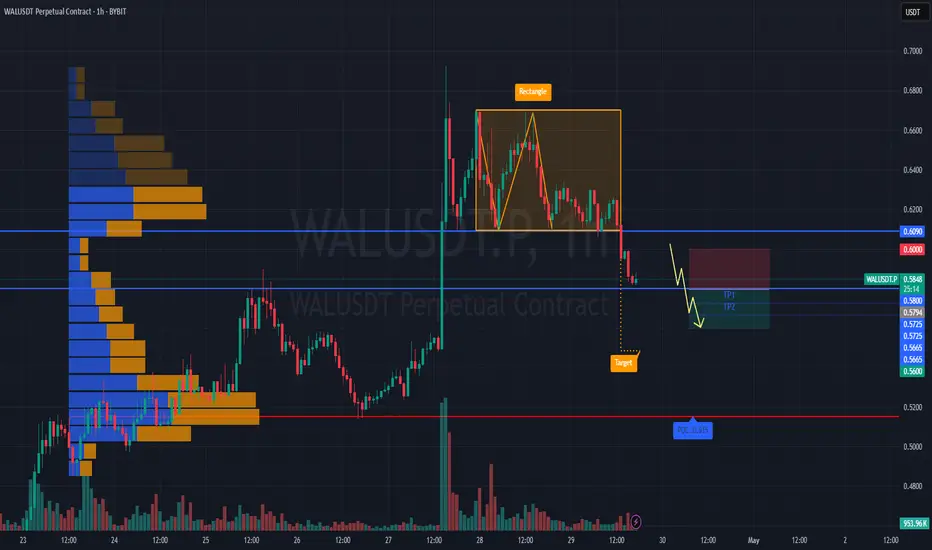
#WALUSDT continues its bearish momentum 📢 As long as the price stays under $0.6000 — short BYBIT:WALUSDT.P bias remains valid.
📢 Watch for further weakness!
📉 SHORT BYBIT:WALUSDT.P from $0.5794
🛡 Stop loss: $0.6000
🕒 Timeframe: 1H
✅ Overview:
➡️ The chart shows a clearly formed and broken Bearish Rectangle, confirming a short setup after price exited the range to the downside.
➡️ The $0.6090 support level has turned into strong resistance.
➡️ Entry at $0.5794 follows a textbook breakdown and retest structure.
➡️ Target area aligns with the volume-based support near POC $0.515, offering solid R:R.
🎯 TP Targets:
💎 TP 1: $0.5725
💎 TP 2: $0.5665
💎 TP 3: $0.5600
📢 Bearish structure confirmed with increased volume.
🚀 BYBIT:WALUSDT.P continues its bearish momentum — downside potential remains active!
Bulls and Bears zone for 04-16-2025Earlier this week S&P 500 has formed a Death Cross which could be significant or not only time will tell.
Any test of yesterday's Close could provide direction for the day.
Level to watch: 5354 --- 5356
Reports to watch:
U.S. Housing Market Index at 10:00AM EST
U.S. Jerome Powell Speaks at 1:30PM EST
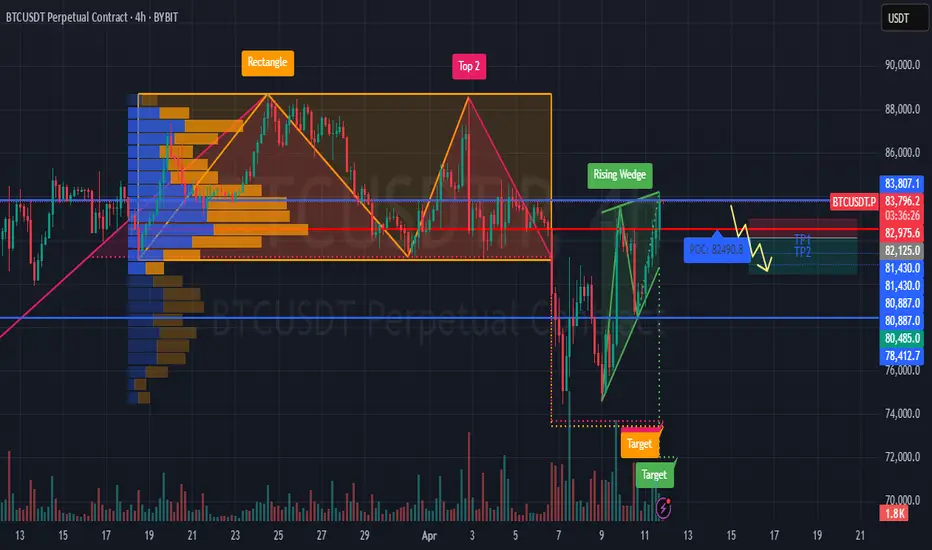
Rising Wedge for #BTCUSDTWhat’s visible on the BYBIT:BTCUSDT.P chart:
📈 Rising Wedge:
➡️ This is a potentially bearish pattern for BYBIT:BTCUSDT.P , especially when it appears after a strong rally following a deep drop (which is exactly the case here).
➡️ The price has almost reached the upper boundary of the wedge and has already formed a second top (Top 2) — a signal of possible weakness.
🔵 Levels:
➡️ POC BYBIT:BTCUSDT.P — $82,490.8 has already been broken to the upside, indicating current market strength.
➡️ The price is approaching major resistance at $83,807.1 — momentum is already slowing down in this zone.
➡️ Support remains in the $80,449.7 – $78,412.7 area.
📊 Volume:
➡️ The rally was supported by high volume, but the most recent candles show declining volume as the price nears the top of the wedge.
➡️ This could indicate weakening buying pressure.
📉 Why it’s important to be cautious with long positions:
➡️ A rising wedge can act as a bull trap.
➡️ The price is near a critical resistance — even a small pullback could lead to a wedge breakdown.
➡️ After such a steep run (from 73K to almost 84K), the chance of profit-taking and a pullback is high.
➡️ Volume is declining — bullish momentum may be fading.
📢 Conclusion:
➡️ Opening a BYBIT:BTCUSDT.P long position right now is risky because:
- the wedge structure suggests a potential reversal to the downside;
- there’s no breakout above the previous high with confirmation;
- and volume does not support further upward movement.
❗️ It's better to watch how the price reacts to the wedge and BYBIT:BTCUSDT.P key levels — a long entry is only valid if the price breaks and holds above $83,800–84,000 with strong volume.
➡️ Until then, a neutral or cautiously bearish position is more appropriate.
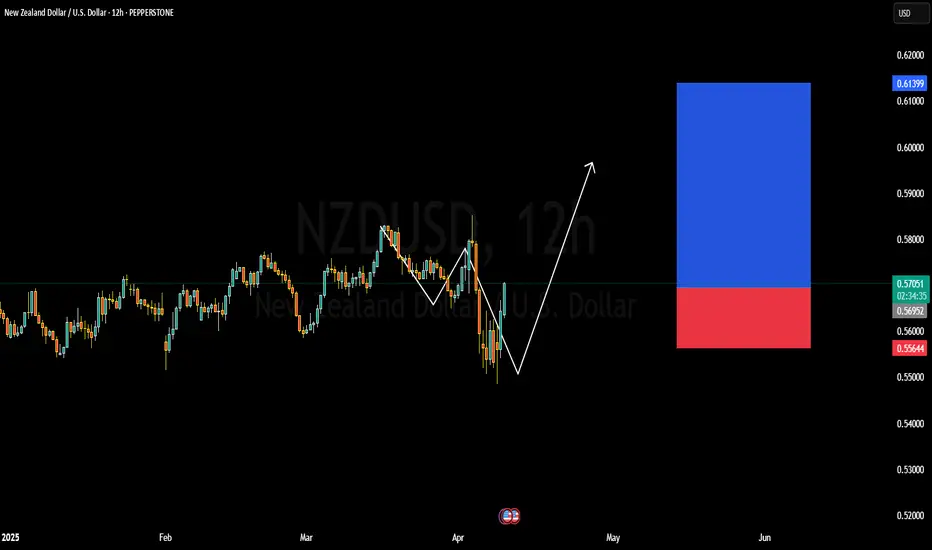
WHY NZDUSD BULLISH ?? DETAILED TECHNICALS AND FUNDAMENTALSNZDUSD has just completed a clean technical retest at a key demand zone around the 0.5560–0.5600 region and is now showing signs of a strong bullish reversal. The recent structure formed a classic “V-shape” recovery, and price is holding firmly above the psychological level of 0.5700. The market has now reset its lower time frame structure and is preparing for a potential bullish continuation toward the 0.6100 target zone in the coming sessions.
Technically, the pair respected its support zone perfectly after a sharp corrective move from the March highs. The retest confirms previous support turned demand, with the 12H chart indicating a potential bullish breakout setup. With the rejection wicks and impulsive bullish engulfing candle seen in the latest session, the momentum has clearly shifted back in favor of the bulls. I'm eyeing a steady climb toward the 0.6000–0.6100 range, especially if we break above the 0.5800 resistance level decisively.
On the fundamental side, the US dollar is showing signs of exhaustion ahead of key inflation data. Market sentiment is slightly dovish on the Fed’s rate trajectory due to softening labor data and a cooling services sector, while New Zealand is holding a relatively steady economic outlook. Although RBNZ remains cautious, commodity demand and improving risk sentiment are currently supporting the Kiwi. Traders are pricing in reduced rate hike expectations from the Fed, which gives NZD a comparative edge in short to mid-term flows.
With positive technical confluence, shifting fundamentals, and improving global risk appetite, NZDUSD looks poised for a solid upside run. As long as the price stays above 0.5600, I remain bullish. A break above 0.5800 could act as the catalyst for acceleration toward 0.6100, providing a favorable risk-reward opportunity in the current market conditions.
#NEIROETHUSDT maintains bearish momentum❗️Keep an eye on the BYBIT:NEIROETHUSDT.P — the structure suggests a possible local rebound or a breakout of the wedge to the upside. Opening a short here goes against the structure and lacks confirmation
📉 SHORT BYBIT:NEIROETHUSDT.P from $0.01612
🛡 Stop loss $0.01693
🕒 Timeframe: 1H
✅ Overview:
➡️ The chart shows BYBIT:NEIROETHUSDT.P forming a bearish continuation move after breaking out of a consolidation range.
➡️ Entry at $0.01612 corresponds to a retest of former support turned resistance.
➡️ Selling volume is increasing, supporting bearish pressure.
➡️ The POC level at $0.02084 remains far above the current price, highlighting downward imbalance.
🎯 TP Targets:
💎 TP 1: $0.01586
💎 TP 2: $0.01535
💎 TP 3: $0.01500
📢 Additional scenario notes:
📢 A false breakout above the entry zone is possible — wait for confirmation of the $0.01620 break.
📢 Watch for volume spikes near TP1 and TP2 — could signal partial take profits.
📢 If price reclaims $0.01693, the setup becomes invalid.
🚀 BYBIT:NEIROETHUSDT.P maintains bearish momentum — downside move expected!

#LAYERUSDT setup remains active 📉 LONG MEXC:LAYERUSDT.P from $1.5722
🛡 Stop loss: $1.5440
🕒 Timeframe: 1H
✅ Market Overview:
➡️ The coin is showing "its own game" — price action is independent of #BTC and #ETH, reacting to internal volume dynamics.
➡️ Ascending triangle breakout with a confirmed close above the key $1.5440 zone.
➡️ Empty space ahead — no major resistance levels until $1.6060–$1.6210.
➡️ Accumulation is forming between $1.5440–$1.5700 — a breakout may follow.
➡️ Important: candles must close above $1.5440 to confirm the long scenario.
🎯 TP Targets:
💎 TP1: $1.5880
💎 TP2: $1.6060
💎 TP3: $1.6210 (full measured move from triangle pattern)
📢 Recommendations:
If volume MEXC:LAYERUSDT.P increases during a breakout above $1.5722 — expect a rapid move.
If price pulls back — the $1.5254 area could offer a second entry opportunity.
The coin looks strong but slightly overbought — partial take profit at TP1 is advised.
📢 A strong breakout above $1.5700 may lead to a sharp move due to lack of resistance.
📢 Avoid 1H candle close below $1.5440 — scenario invalidation.
📢 If the move occurs on weak volume — watch for a potential reversal near TP1.
🚀 MEXC:LAYERUSDT.P setup remains active — holding the key level could lead to a move toward TP2–TP3!

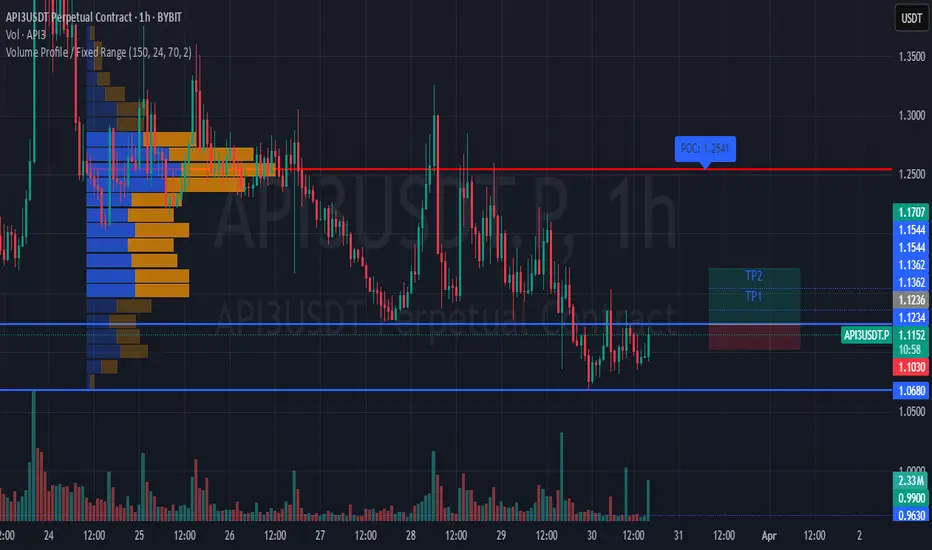
#API3USDT is showing signs of recovery📉 LONG BYBIT:API3USDT.P from $1.1236
⚡️ Stop loss $1.1030
🕒 Timeframe: 1H
✅ Overview BYBIT:API3USDT.P :
➡️ The chart shows a gradual shift from a downtrend to possible reversal after forming strong support around $1.0680.
➡️ Price is currently attempting to break above the key resistance zone $1.1234–$1.1236, which also marks the potential LONG entry point.
➡️ Volume Profile indicates high trading activity above, with the Point of Control (POC) at $1.2541 — suggesting room for upside movement if breakout holds.
➡️ Bullish volume spikes suggest growing buyer interest.
➡️ Stop loss set at $1.1030, just below recent consolidation lows.
📍 Important Note:
Do not rush the entry!
Wait for a clear hold above $1.1236 before entering the LONG — entering too early may expose you to fakeouts.
🎯 Take Profit Targets:
💎 TP 1: $1.1362
💎 TP 2: $1.1544
💎 TP 3: $1.1707
⚡ Plan:
➡️ Watch for breakout confirmation above $1.1236
➡️ Enter LONG after volume or candle confirmation
📢 Consider partial profit at TP1 and move SL to breakeven for risk-free management.
🚀 BYBIT:API3USDT.P is showing signs of recovery — if the price holds above the entry zone, further upside is expected!
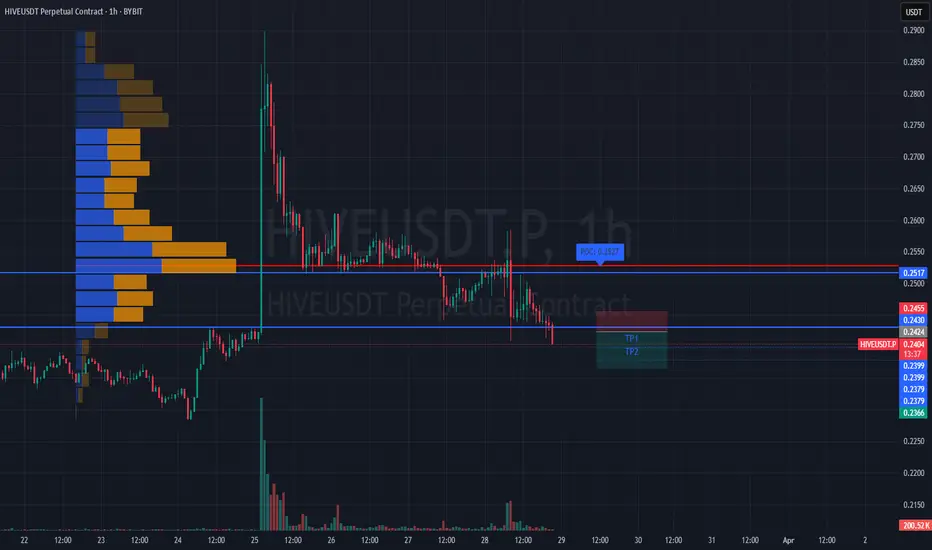
#HIVEUSDT is maintaining a bearish structure📉 Short BYBIT:HIVEUSDT.P from $0.2424
🛡 Stop loss $0.2455
🕒 1H Timeframe
⚡️ Overview:
➡️ The POC (Point of Control) is at 0.2527, marking the area with the highest trading volume and now acting as major resistance.
➡️ The 0.2455 level serves as local resistance — price has already started to decline from that zone.
➡️ Price BYBIT:HIVEUSDT.P is steadily moving lower and staying below volume clusters, confirming the bearish structure.
➡️ A breakdown below $0.2424 could lead to acceleration toward target zones.
🎯 TP Targets:
💎 TP 1: $0.2399
💎 TP 2: $0.2379
💎 TP 3: $0.2366
📢 Watch for confirmation of the $0.2424 breakdown — it’s key for continuation.
📢 If price reclaims $0.2455, the short setup becomes invalid.
BYBIT:HIVEUSDT.P is maintaining a bearish structure — expect quick target reaction if the signal confirms.
Bulls and Bears zone for 03-26-2025Futures are trading a little bit lower during ETH session, since there is a lot of uncertainty in the market.
Level to watch: 5829 --- 5827