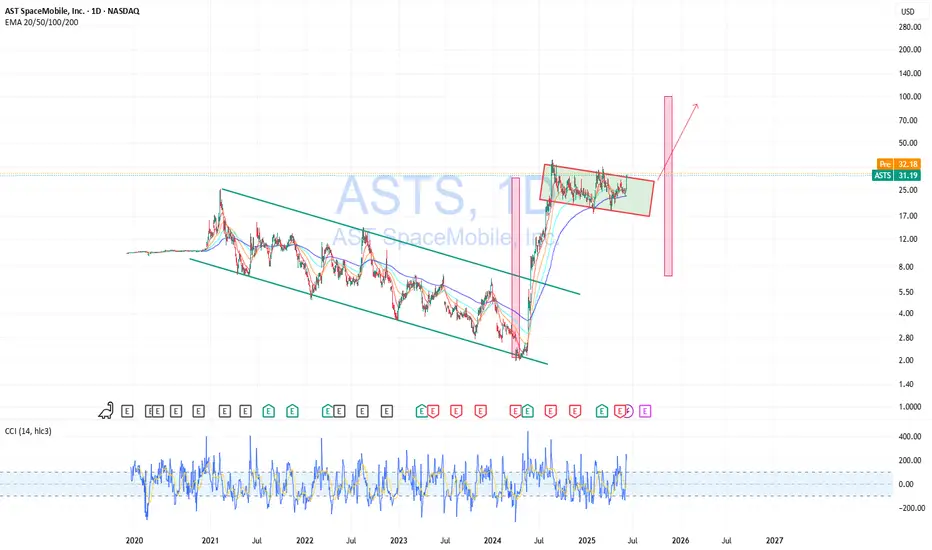
Buying ASTS — Waiting for BreakoutASTS has broken out of a long-term downtrend and is now consolidating in a tight range, forming a base after a strong impulse move. This kind of price action often leads to another breakout, especially when supported by rising volume and EMAs lining up underneath.
I’m buying in this current zone, expecting a breakout from the range and continuation to the upside. I’ll be watching for confirmation through volume spikes and a clean move above resistance. The chart structure looks strong, and the upside potential remains high.
Technicalanalysi
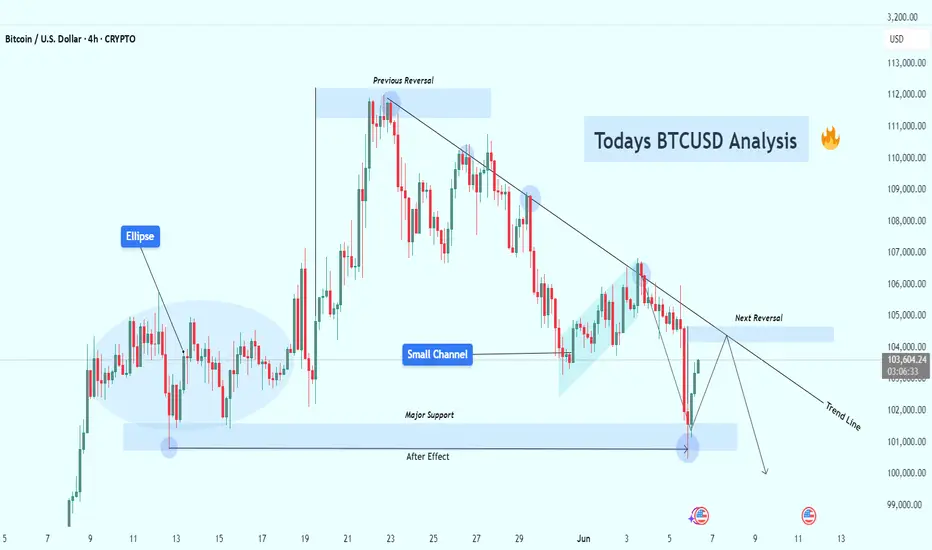
BTCUSD at Decision Point – Rejection or Breakout Ahead? (4H)Bitcoin is currently trading around $103,500, and the price action is presenting a textbook technical scenario with multiple confluences. This chart is rich in structure — from rejection zones and trendlines to channel breakdowns and historical support retests — making it a critical area for traders to observe.
🔍 1. Previous Reversal Zone
The chart shows that Bitcoin previously faced a strong rejection near the $110,500–111,000 level. This created the first lower high, signaling the end of bullish momentum and the start of a trend shift. Every subsequent touch of that zone resulted in rejection, confirming it as a major supply zone.
📉 2. Descending Trendline – Dynamic Resistance
After multiple failed attempts to break above, price has formed a clean descending trendline that is acting as dynamic resistance. Each touch along this trendline has led to a short-term selloff, and price is now approaching this line again, near the Next Reversal Zone.
📌 This confluence increases the probability of another rejection unless there's a strong bullish breakout with volume.
📊 3. Bearish Channel & Breakdown
Before the recent fall, Bitcoin was trading inside a small bearish channel. This type of consolidation often results in continuation — which we saw with the downside breakout. This breakdown also increased bearish momentum and pushed BTC into the major support area.
🧊 4. Major Support Zone – The Battle Ground
Marked around the $101,000–102,000 range, this zone has acted as a strong demand area multiple times. The most recent bounce suggests that buyers are still active here. This could be the last defense for bulls in the short term.
🧠 If this zone breaks, we could see price falling toward the psychological level of $100,000 or even lower.
🌀 5. Ellipse Zone – Accumulation Structure
Early on the chart, an ellipse highlights a horizontal accumulation zone where price moved sideways before breaking out upward. This shows how smart money often enters during quiet phases before explosive moves. Watching for similar signs can provide strong trade setups.
🔄 6. Next Reversal Zone – Watch Closely
Price is now approaching the Next Reversal Zone near $104,500–105,000, which aligns perfectly with the descending trendline. This is a high-probability rejection zone where traders should be watching for bearish confirmations like wicks, pin bars, or bearish engulfing candles.
📌 Two Possible Scenarios
🟥 Bearish Scenario (High Probability):
Price touches the Next Reversal Zone and gets rejected.
We could see a drop back to the Major Support Zone.
If support breaks, expect a move toward $100K–99K in the coming sessions.
🟩 Bullish Scenario (Low Probability Without Volume):
Price breaks and closes above the trendline with strong bullish candles and increased volume.
In that case, BTC could rally toward the $107K–108K resistance and potentially flip the trend bullish.
💡 Trading Insight:
Fridays usually have low volume, leading to unexpected wicks and false breakouts. That’s why it’s important to:
Use small lot sizes
Wait for confirmations
Avoid overtrading before weekend closes
🧠 Final Thoughts:
This is a classic setup — consolidation after trend, rejection zones, trendline resistance, and strong support areas all in one chart. Whether you’re a price action trader or a structure-based analyst, this chart offers a powerful decision point.
Stay patient. Let the market reveal its hand. The next few candles around this trendline will likely dictate the next 1–3 day direction for BTC.
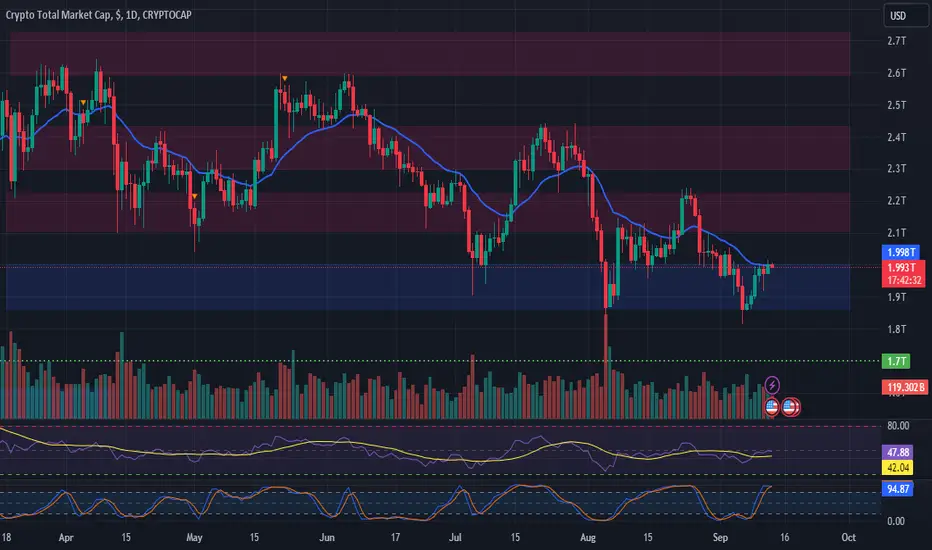
TOTAL Market Cap Faces Rejection at $2TCurrent Market Activity: This morning, the TOTAL market cap was rejected at the $2T level, the top of the range, and has begun retracing, potentially testing the bottom of the range at $1.85T once again.
Key Levels:
Top of Range: $2T (Rejected)
Bottom of Range: $1.85T (Potential test)
Previous High: $2.25T (Late August)
Bearish Signals: TOTAL has not created a higher high since reaching $2.25T, suggesting that the higher timeframe trend remains to the downside. A break below $1.85T could lead to a retest of the $1.7T level, which was last tested in early August.
Market Outlook: Watch for a decisive move at $1.85T for clues on the next direction.
#CryptoMarketCap #TOTAL #MarketAnalysis #SupportAndResistance #Downtrend #Bearish #Crypto #PriceAction #TechnicalAnalysis
Swiss Franc can rebound up from support line to resistance levelHello traders, I want share with you my opinion about Swiss Franc. By observing the chart, we can see that the price started to trades in a downward pennant, where it first rebounded from the resistance line and made a strong downward impulse to the support line, thereby breaking 0.8720 and 0.8490 levels. But after this, CHF at once rebounded from the support line of the pennant, and made a short impulse up to 0.8490 support level, which coincided with the buyer zone, and soon broke this level. After the price some time traded near this level, it bounced and started to rise to the resistance level, which coincided with the seller zone and the resistance line of the pennant. When Swiss Franc reached this area, the price at once turned around and in a short time declined to support line of pennant. But a not long time ago, the price bounced and started to rise. So, I think that the Swiss Franc can fall to the support line, making a little correction, and then rebound up to the resistance level, thereby exiting from the pennant, pattern. For this case, I set my target at the 0.8720 resistance level. Please share this idea with your friends and click Boost 🚀

AUDCHF ShortHey traders, in today's trading session we are monitoring AUDCHF for a selling opportunity around 0.65 zone, once we will receive any bearish confirmation the trade will be executed.
Trade safe, Joe.

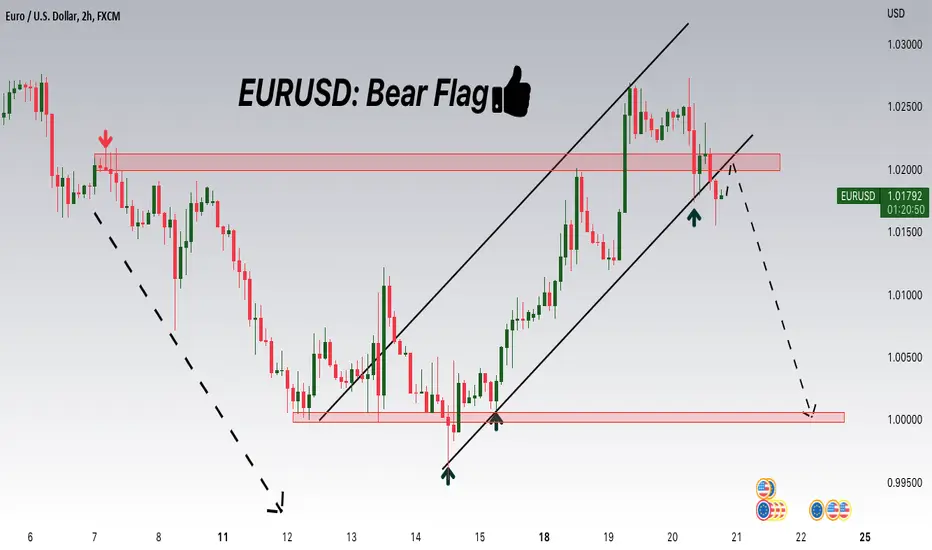
EURUSD: Bear Flag and ECB statement coming abroad! dovish?Hey traders, above is a technical overview on EURUSD and the most important level to watch. Tomorrow we are coming abroad an important event, which is the ECB statement. the Market is expecting a rate hike of 0.30 and our team expect the Rate to be less than the expected. if our Theory is right then we can expect waterfalls for EURUSD.
Trade safe, Joe.
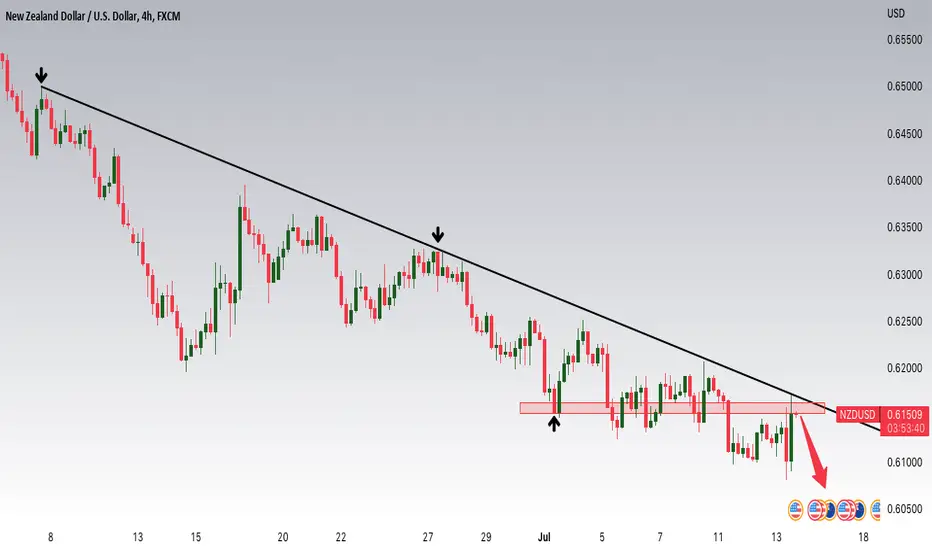
NZDUSD Potential downsidesHey traders, in today's trading session we are monitoring NZDUSD for a selling opportunity around 0.615 zone, once we will receive any bearish confirmation the trade will be executed.
Trade safe, Joe.