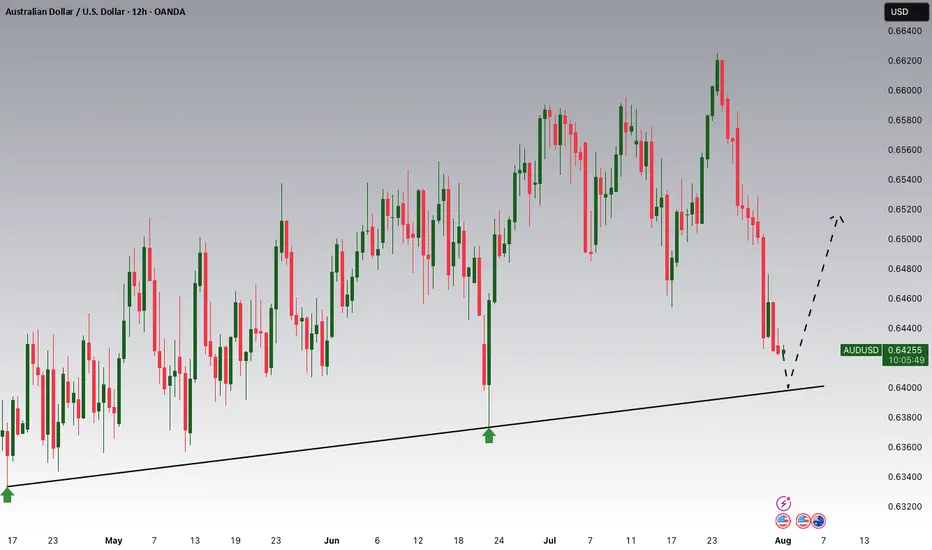
AUDUSD Potential UpsidesHey Traders, in today's trading session we are monitoring AUDUSD for a buying opportunity around 0.64000 zone, AUDUSD is trading in an uptrend and currently is in a correction phase in which it is approaching the trend at 0.64000 support and resistance area.
Trade safe, Joe.
Technical Analysis
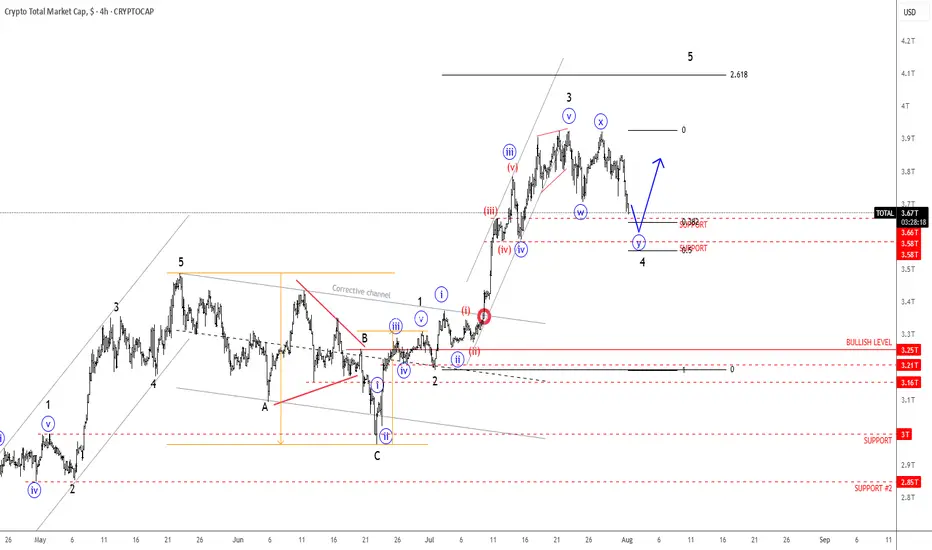
Crypto Market Slows Down For A Pullback Within A Bullish TrendGood morning Crypto traders! Cryptocurrencies are coming slightly lower on the intraday basis due to stock market decline yesterday, but we still see them approaching support, so still be aware of a bounce and recovery at the end of the week or maybe next week because of an upcoming weekend. Crypto TOTAL market cap chart can be trading in wave »y« of a complex w-x-y correction in wave 4, unless it's a flat correction, but support is the same at 3.6T – 3.5T area, from where we may see a bullish continuation within wave 5.
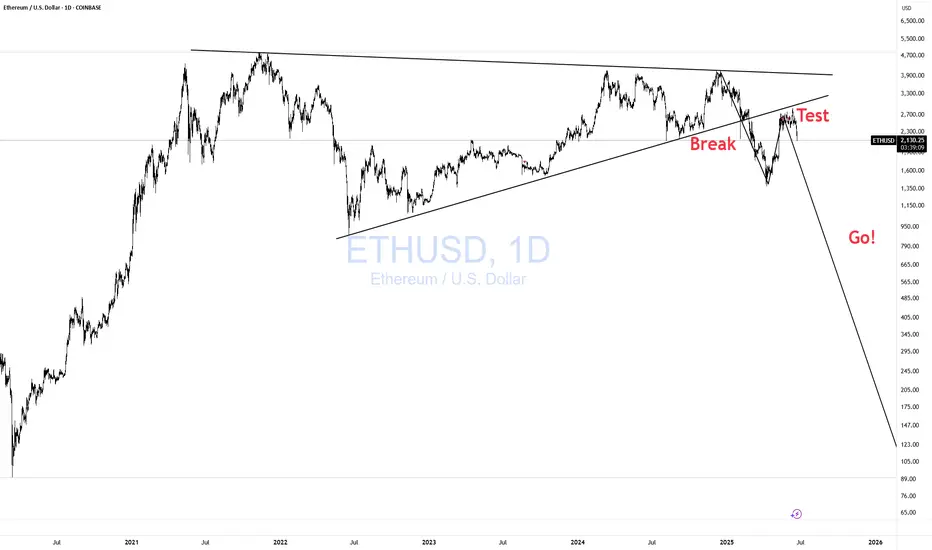
ETHUSD Break- Test- GO!!! Nothing Changed! 3rd EditionI have been warning about this for some time. Please visit my previous two posts for more info and updates.
Magic!
Click boost, follow, and subscribe for more. Let's get to 5,000 followers ))
GBP/NZD POTENTIONAL SHORT OPPORTUNITYThis is an idea for GBPNZD's potential short opportunity based on what the technicals indicate.
The trend has been emphasising its bullish approach for almost three years.
Price respected almost 11 times due to the strong resistance within 150 days between 2.265 & 2.275 and bounced off bullish OB on the daily chart and FVG on the weekly chart.
An institutional sharp decline on the weekly chart, followed by a clear wedge, can support a further drop once swept by bearish daily OB. A breakout to the micro wedge (orange) within a macro wedge can also help further down move.
Given that a bearish pin bar followed by a bearish doji is a strong warning signal of potential reversal or bearish continuation that appears inside the micro wedge.
TP1 is considered the first support at the bottom, where the daily OB and the weekly FVG meet at around 2.22000 or the area close to the trendline. If the price breaks through the trendline, TP2 and TP3 will be expected to be achieved.
TP2 may be located at the micro accumulation around 2.20000, and TP3 at the following major support around 2.15000-2.17000 that previously acted as both support and resistance.
Good luck and have a great weekend.

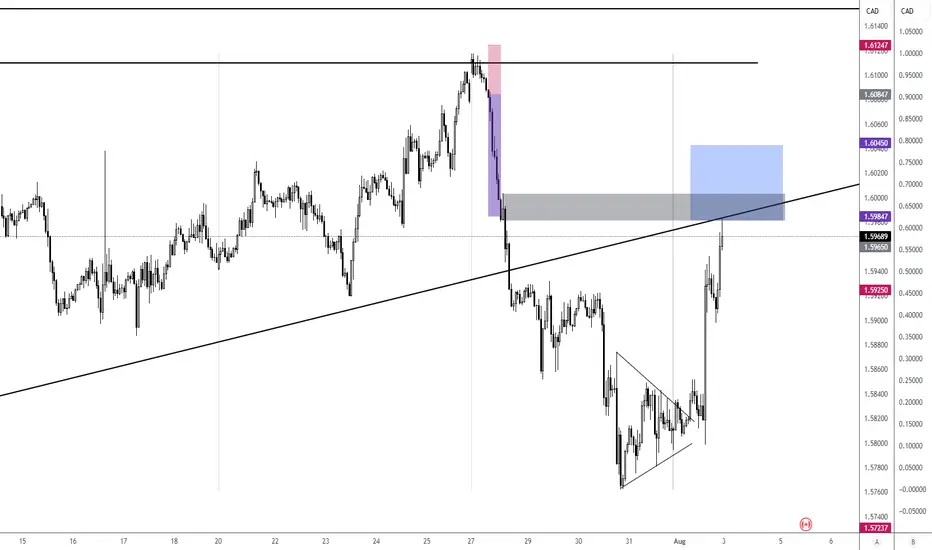
EURCAD ShortConfluence
1. Break and retest of the trendline
2. Order block in 1H
3. 61.8% Fib zone
It's a good spot to catch a clean 1:2. Wait for confirmation on either 1H or 2H timeframe to enter.
Good luck...
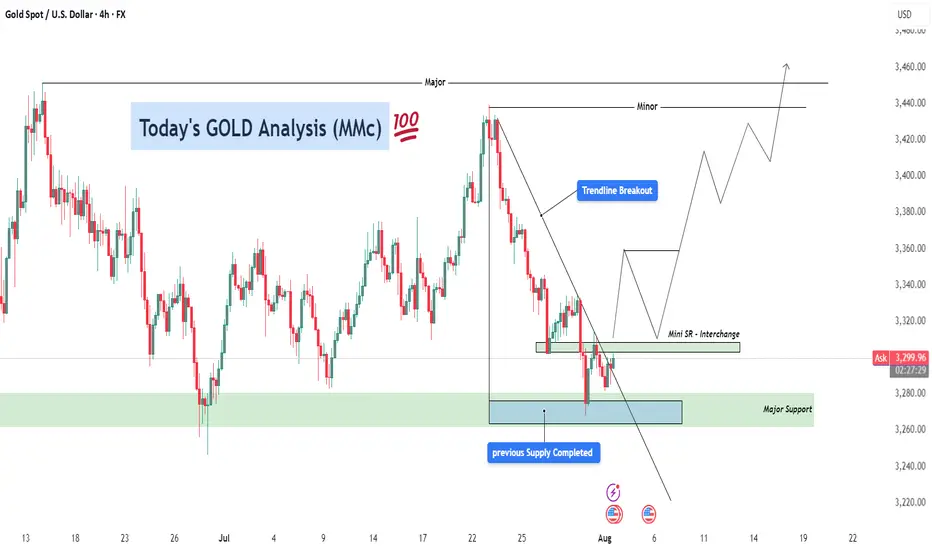
GOLD Analysis – Bullish Recovery Setup After Trendline Breakout ⚙️ Technical Structure Overview
This 4-hour chart of Gold (XAUUSD) illustrates a classic reversal setup developing after a significant correction. Price previously faced strong selling pressure from the 3,470+ zone and declined sharply. However, the recent price action suggests a shift in control from sellers to buyers, signaling a likely medium-term trend reversal or a bullish wave formation.
The key to this setup lies in three confluences:
Completion of a previous supply zone, which no longer holds influence.
Aggressive buyer activity from a major support zone.
A clean break above the descending trendline, which is a common signal that bearish momentum is losing strength.
🔑 Key Levels & Concepts Explained
🟢 1. Major Support Zone (3,260–3,280)
This zone has been tested multiple times and each time, buyers stepped in and prevented further downside. The most recent rejection from this area shows long wicks and bullish engulfing candles, indicating accumulation by institutional players. This is the foundational support that has held the entire corrective structure.
📉 2. Trendline Breakout
The descending trendline connecting swing highs has now been broken to the upside. This is a critical technical signal, especially on the 4H timeframe, as it suggests a potential trend reversal or at least a deep retracement in the opposite direction.
Trendline breakouts typically result in a retest of the trendline or a nearby support-turned-resistance zone (as is the case here with the Mini SR level).
It also implies that supply is weakening, and buyers are ready to push.
🧱 3. Mini Support/Resistance Interchange (~3,300–3,320)
This zone now plays the role of an interchange level—a previous minor resistance that could act as a support after the breakout. This level is crucial for intraday and swing traders because it can offer a low-risk long entry if price retests and confirms it with bullish momentum.
The chart projection suggests a bounce off this mini S/R, followed by successive higher highs and higher lows, forming a new bullish structure.
📈 Forecast Path & Trade Scenario
✅ Bullish Path (Preferred MMC Scenario)
Stage 1: Price retests the 3,300–3,320 zone (Mini S/R).
Stage 2: Buyers step in, leading to a bullish continuation.
Stage 3: Price targets the Minor Resistance (~3,440).
Stage 4: If momentum is sustained, it aims for Major Resistance (~3,470–3,480), completing a clean reversal formation.
This path reflects perfect bullish market structure—a breakout, followed by a retest and rally.
❌ Bearish Invalidation
If the price closes strongly below 3,260, the structure would be invalidated.
This would suggest that the support zone failed, possibly triggering deeper downside toward 3,220–3,200.
🧠 MMC Trader Mindset & Risk Considerations
Don’t Chase: Wait for a confirmed retest of the Mini S/R zone. Let the market come to your entry.
Entry Confirmation: Use candlestick signals like bullish engulfing, pin bars, or inside bars near the Mini S/R.
Volume Consideration: Volume should ideally rise on breakout legs and decline on pullbacks—this confirms healthy bullish structure.
Risk-Reward: With a stop below 3,260 and targets toward 3,470, the RR ratio favors long entries, especially after confirmation.
🔁 Summary Plan for Execution
Entry Zone: 3,300–3,320 (after bullish confirmation)
Stop Loss: Below 3,260 (structure break)
Take Profit 1: 3,440
Take Profit 2: 3,470–3,480
Risk-to-Reward: 1:2+ if planned carefully
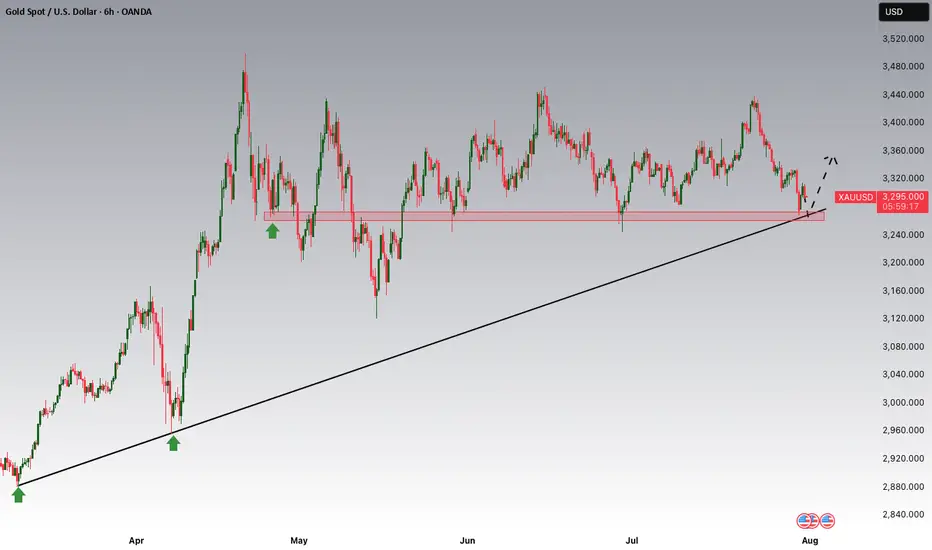
Gold Potential UpsidesHey Traders, in today's trading session we are monitoring XAUUSD for a buying opportunity around 3,270 zone, Gold is trading in an uptrend and currently is in a correction phase in which it is approaching the trend at 3,270 support and resistance area.
Trade safe, Joe.
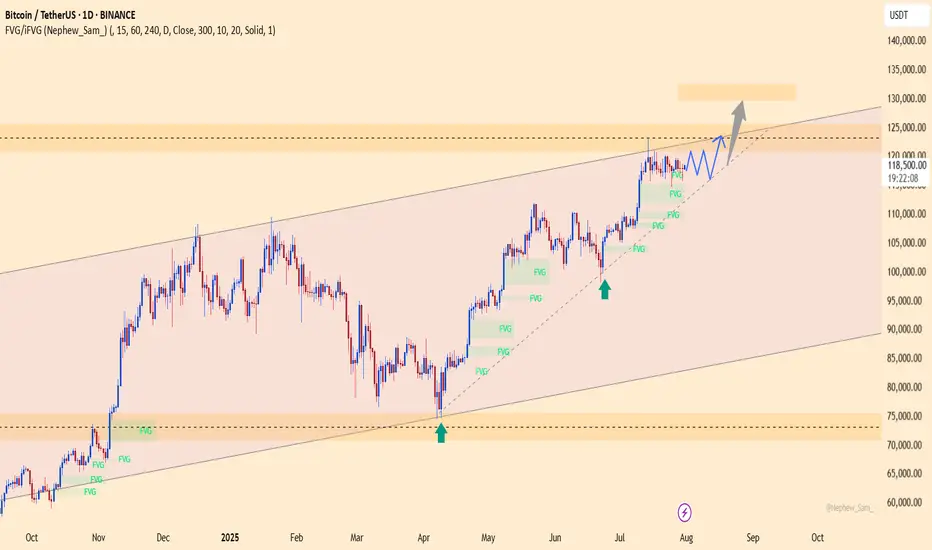
BTC defies expectations –Absorbs 9 billion USD, aiming for 130K?BTCUSDT maintains its bullish momentum despite Galaxy Digital offloading 80,000 BTC (worth ~9 billion USD). Price only saw a slight dip before bouncing back quickly, signaling strong demand and a more mature market sentiment.
Citi analysts point to ETF inflows and retail participation as the primary drivers of BTC’s rally, even as investors remain cautious ahead of the Fed’s rate decision.
On the daily chart, BTC continues to trade within an ascending channel, with the 116,200 zone acting as a potential buy area on any pullback. The next target is set at 129,500 USDT, aligning with the channel’s upper boundary and technical resistance.
Suggested strategy: Look to buy near 116,200–117,000. Target 129,500. Stop-loss below 115,000.
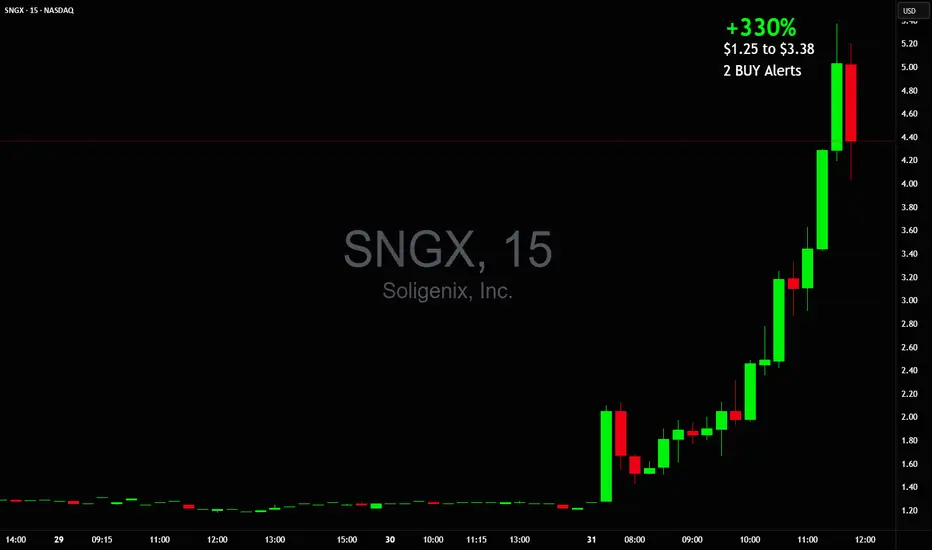
+330% this morning $1.25 to $5.38 on massive 270 million volume🚀 +330% this morning 💥 $1.25 to $5.38 on massive 270 million shares traded volume so far
NASDAQ:SNGX money maker of the day!
2 Buy Alerts sent out, also posted it in my premarket watchlist while it was still up only +30%!
Forget about NASDAQ:MSFT NASDAQ:META NASDAQ:AMZN NASDAQ:NVDA NASDAQ:AAPL AMEX:SPY NASDAQ:QQQ they will never be able to create such gains in a single day or should I say minutes
This isn't options trading either, it's a stock that went up that much this morning
GOLD TRADING PLAN – Triangle Squeeze, All Eyes on NFP【XAU/USD】GOLD TRADING PLAN – Triangle Squeeze, All Eyes on NFP
Gold continues to trade within a large symmetrical triangle, tightening toward the end of its range. However, current candle structure shows clear bullish momentum, indicating the potential for a strong upside breakout.
🔍 Today’s Key Focus: Non-Farm Payrolls (NFP)
Market expectations are pointing to weaker-than-expected US economic data, which could trigger strong FOMO-buying for gold if confirmed. A poor NFP report would likely weaken the USD, supporting bullish continuation.
🔑 Strategy and Key Technical Levels:
Watch for a confirmed breakout above the descending trendline to trigger Wave 3 of the bullish structure.
CP ZONE + OBS BUY ZONE triggered yesterday already yielded 160+ pips profit.
Strategy: Prefer buy-the-dip entries. SELL setups only valid on strong resistance rejection. Avoid counter-trend trades near breakout zones.
🟩 BUY ZONE:
Entry: 3276 – 3274
Stop Loss: 3270
Take Profits:
3280, 3284, 3290, 3294, 3300, 3305, 3310, 3320, 3330, 3340, 3350
🟥 SELL ZONE:
Entry: 3339 – 3341
Stop Loss: 3345
Take Profits:
3335, 3330, 3325, 3320, 3315, 3310, 3305

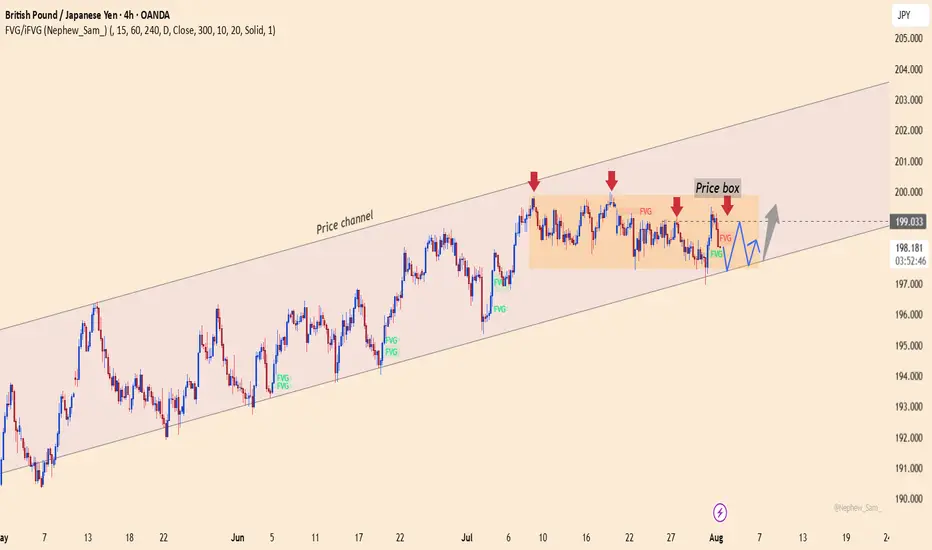
GBPJPY holds momentum, waiting for the final pushThe GBPJPY pair is moving sideways between 197.400 and 199.000, while maintaining its position inside the ascending price channel. Each pullback is quickly absorbed near the lower support, indicating that buying pressure is quietly building.
💡 Bullish factors supporting the trend:
– UK Services PMI beats expectations, strengthening economic outlook.
– BOJ maintains negative interest rates, weakening the JPY.
– Risk-on sentiment drives capital back into the GBP.
🎯 Suggested strategy:
Buy near 197.400 or on a breakout above 199.000.
Target: 201.500 | Stop-loss: below 196.800.
DAILY SCALPING PLAN | CLINTON SMC STYLE✅ XAU/USD - DAILY SCALPING PLAN | CLINTON SMC STYLE
📆 Date: August 1st, 2025
📍 Strategy: Smart Money Concepts (SMC)
🔑 Focus: Liquidity Sweep | Order Block | BOS | Premium/Discount Model
🔍 Market Overview
Gold (XAU/USD) is currently in a manipulation phase after a strong move down from a premium supply zone. The market has swept key liquidity and is preparing for a high-probability move in both directions based on Smart Money footprints.
Current structure suggests:
Bullish intent forming from a discount demand zone.
Liquidity resting above recent highs – perfect for short-term scalps and intraday swings.
🟢 BUY SETUP – DISCOUNT DEMAND REACTION
🎯 Entry: 3275
🛡️ Stop Loss: 3268
🎯 Take Profits:
TP1: 3285
TP2: 3295
TP3: 3305
TP4: 3315
TP5: 3325
TP6: 3335
Reasoning:
This is a clean bullish OB resting beneath a CHoCH and BOS zone. Price may wick into this area as Smart Money reloads after sweeping early long positions. If held, expect sharp upside expansion toward previous liquidity highs.
🔴 SELL SETUP – PREMIUM SUPPLY REJECTION
🎯 Entry: 3356
🛡️ Stop Loss: 3362
🎯 Take Profits:
TP1: 3350
TP2: 3345
TP3: 3340
TP4: 3330
TP5: 3320
Reasoning:
This level is a key supply block where price previously distributed. If price expands into this zone, it’s likely to act as a liquidity magnet for Smart Money to offload longs and enter short-term shorts. Expect reaction.
🧠 SMC Insights
Internal BOS & CHoCH signal early signs of accumulation.
Price respects the premium vs. discount framework with clear liquidity targets.
SMC traders understand that price doesn’t move randomly – it targets liquidity, mitigates OBs, and respects structure.
🔔 Note:
Always wait for clear confirmation (rejection wick, engulfing pattern, or M15 structure shift) before execution. Entries without confirmation are riskier in current volatility.
📌 Follow @ClintonScalper for daily SMC scalping plans & deep institutional insight.
🔁 Like, comment & share if you find this helpful!
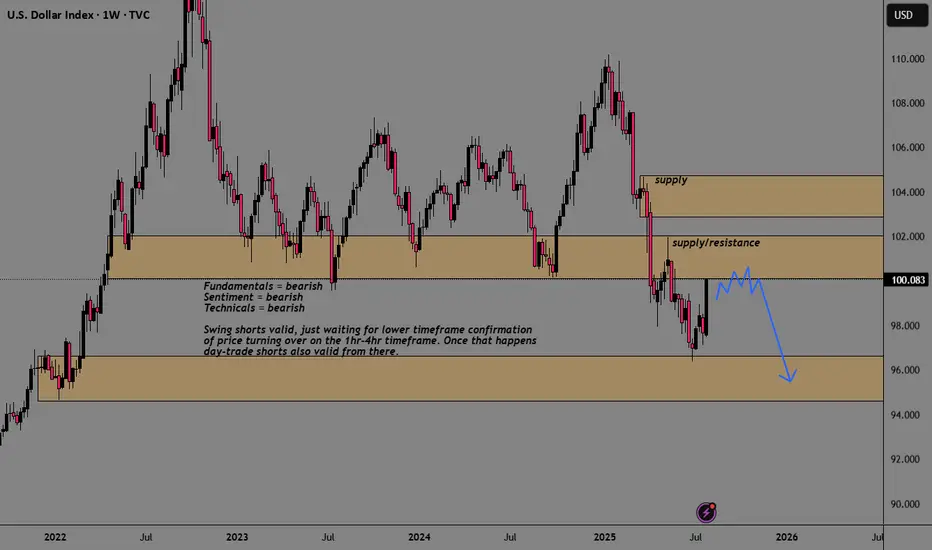
DXY USDOLLAR CRASH Incoming!Long-term fundamentals are bearish
Long-term sentiment = bearish
Long-term technicals = bearish
Trump wants a weaker dollar + FED injecting endless amounts of cash into the markets
driving stocks/ gold up, and the dollar down, losing purchasing power.
My plan is to look for shorts on the 1hr-4hr timeframe with lower timeframe confirmation.
Once price starts turning over, day-traders can join in.
Agree or disagree?
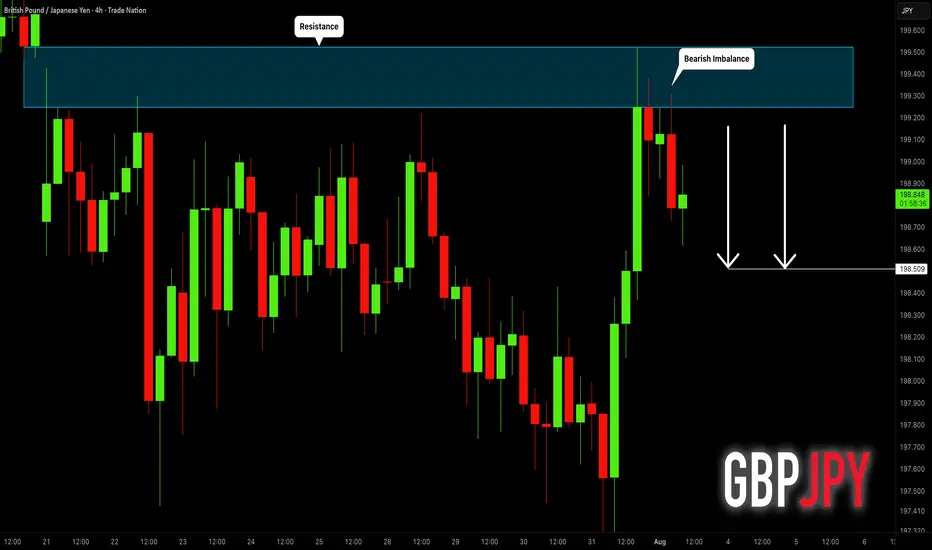
GBPJPY: Pullback From Resistance 🇬🇧🇯🇵
I think that GBPJPY will pull back from a wide
intraday supply area.
As a confirmation, I see a bearish imbalance candle that
is formed after its test.
Goal - 198.51
❤️Please, support my work with like, thank you!❤️
I am part of Trade Nation's Influencer program and receive a monthly fee for using their TradingView charts in my analysis.
BTCUSD – Bullish Recovery Setup Forming Near Trendline Support🧠 Market Structure & Technical Breakdown
The BTCUSD 4H chart showcases a well-formed descending triangle or falling wedge structure with clearly respected major and minor descending trendlines. Currently, price action is testing a dynamic support zone, highlighted in green, which has been a strong reaction area in the past.
This area aligns with a bullish accumulation zone, from which buyers have previously stepped in to initiate impulsive moves. Given the confluence of diagonal support and horizontal price reactions, we may be on the verge of a bullish breakout opportunity.
📍 Key Zones & Trendlines
✅ Green Support Channel (Demand Zone): Acting as a key pivot for multiple recent rejections, this area (~114,000–113,000) is now being revisited again, offering potential buy interest.
📉 Minor Trendline: A short-term descending resistance around 120,000—likely the first barrier in case of a bounce.
📉 Major Trendline: A more extended dynamic resistance line connecting swing highs, currently intersecting near the 124,000 region.
🔄 Potential Price Scenarios
Primary Bullish Setup (MMC Plan):
Price bounces off the green demand zone.
Breaks above the minor trendline (~120K).
Pullback retest to confirm breakout.
Continuation toward the major breakout level (~124K and beyond).
Invalidation / Bearish Case:
A clean breakdown below 113,000 with strong bearish momentum would negate this setup, likely targeting the psychological support near 110,000.
🧠 MMC Mindset: Trade with Patience & Confluence
This is a classic accumulation-to-breakout scenario. Smart traders wait for confirmation—especially as BTC often exhibits false breakdowns before a major move. Monitor candle behavior, volume, and reaction to the minor trendline.
Let the market show signs of strength (like bullish engulfing, pin bars, or a breakout-retest) before committing to the upside. Avoid FOMO; the key is discipline and precision entry at structural break points.
✅ Trade Plan Summary:
Watch zone: 113,000–114,500 for bullish price action
Breakout level: Minor trendline (~120,000)
Target zone: 123,500–124,000 (Major resistance)
Stop-loss idea: Below 112,800 (Invalidation of structure)

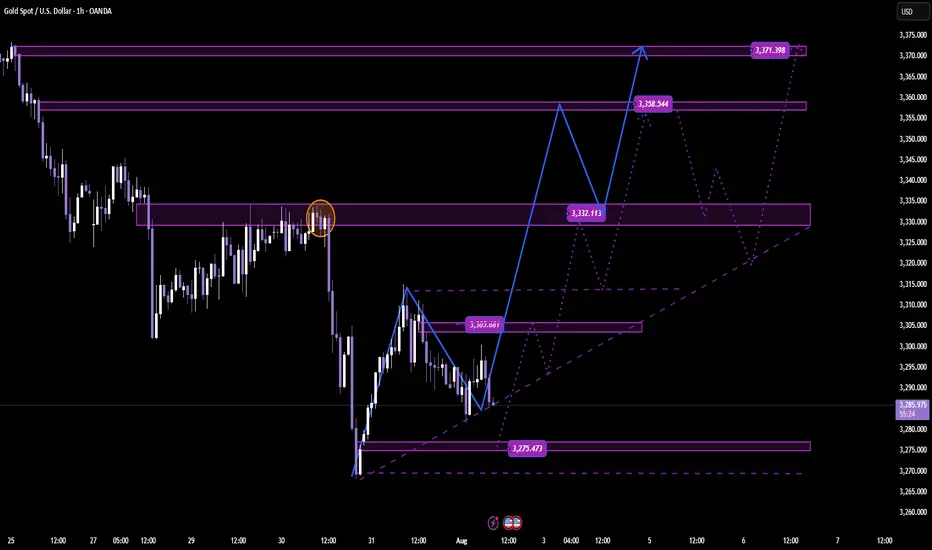
Bounce From Final Liquidity or Start of a Bullish Move? Bounce From Final Liquidity or Start of a Bullish Move?
After the FOMC event, gold completed a sweep of the final liquidity zone at 3269–3271 and rebounded strongly, in line with the broader bullish trend. The price has now recovered sharply and is gradually returning to the liquidity zones left behind after yesterday’s sharp drop.
📍 At the moment, gold is reacting around 3295, which aligns with a CP (Compression Point) Zone on the M30 chart. We're seeing a slight pullback here, and another retracement could occur before a strong upward continuation — potentially breaking out of the descending trendline that’s formed over recent days.
📊 Trading Plan & Key Levels
✅ BUY ZONE – Trend Continuation Setup
Entry: 3286–3284
Stop Loss: 3278
Take Profits:
3290 → 3294 → 3298 → 3304 → 3308 → 3312 → 3316 → 3320 → 3330 → …
💡 This is a prime area to look for re-entries into the dominant bullish move. Price action left a clean liquidity zone below after the aggressive upside reaction — ideal for riding the next wave.
❌ SELL ZONE – Only Valid Below VPOC
Entry: 3328–3330 (Volume Point of Control)
Stop Loss: 3335
Take Profits:
3324 → 3320 → 3315 → 3310 → 3305 → 3300
🔻 This is a high-probability short only if price stays below 3330. If gold closes above this VPOC region, the structure shifts to bullish and we should look for sells higher up — around 335x–337x zones.
📅 Monthly Candle Close – Watch for Indecision
As it’s the last trading day of the month, note that the past two monthly candles have printed doji-like wicks, signalling indecision and liquidity grabs. The market is still waiting for a clearer signal from the Fed on the first potential rate cut of the year.
🚫 Avoid emotional trading. This is a highly reactive environment, so careful risk management is key.
🧭 Final Thoughts
Gold continues to respect market structure and liquidity theory. The first major test lies at the 3313 resistance level — if broken, it opens the door to stronger bullish momentum toward the broader VPOC zone.
⏳ Be patient and only act when price confirms your bias.

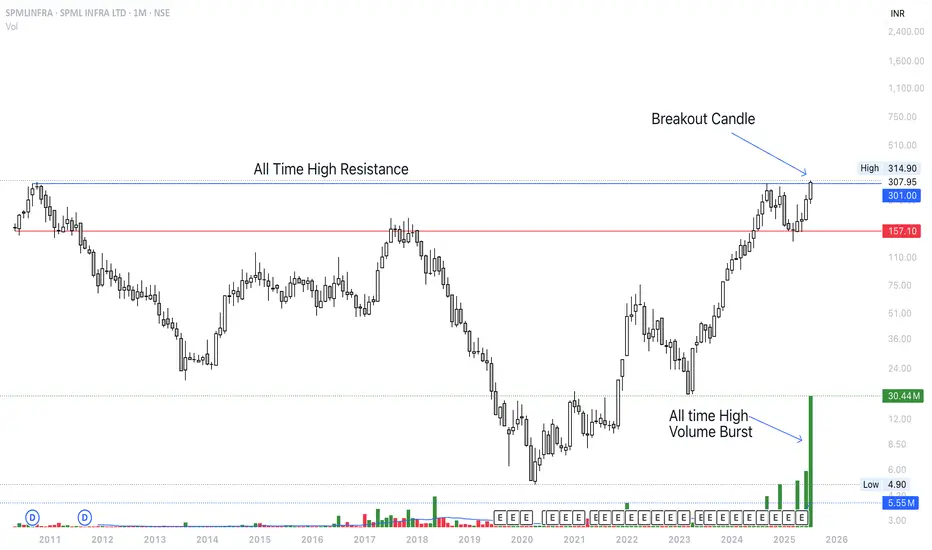
Breakout Soon <> SPMLINFRAStock is pushing above All time High resistance level. Keeping on radar. It would have been solid breakout if the Monthly closing was above 310 level. Volume also supporting the level. Recently realty sector rally also supporting.
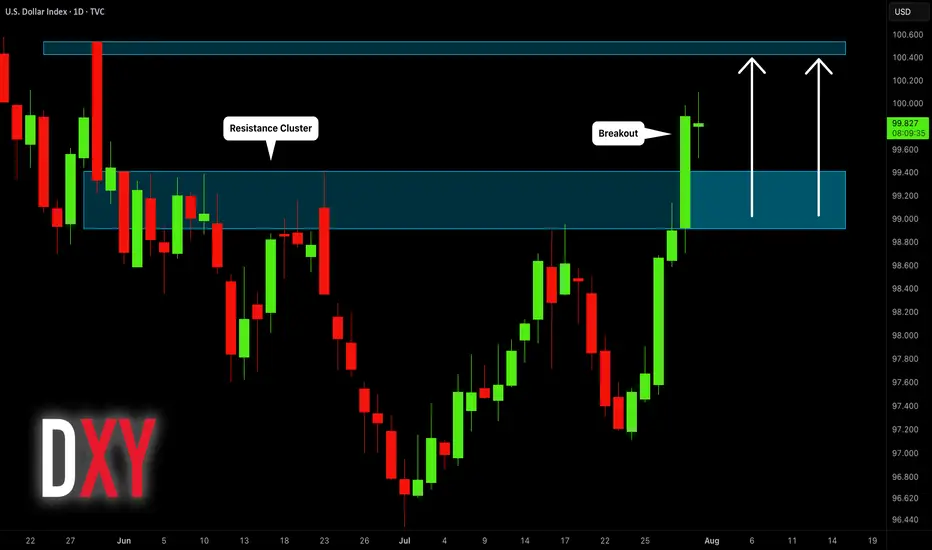
Dollar Index (DXY): Will It Rise More?!
Dollar Index is on its way to 100.4 resistance.
A breakout of a major supply cluster on a daily after FED meeting
yesterday indicates a strong bullish pressure.
I think that growth will continue soon.
❤️Please, support my work with like, thank you!❤️
XAUUSD – Downtrend Confirmed, Bears in ControlOn the H4 timeframe, gold has completely broken its short-term uptrend structure and formed a series of lower highs and lower lows. Every bounce is rejected at the strong resistance zone of 3,326 – 3,333 USD, confirming the clear downtrend.
Although the recently released Core PCE index was lower than expected, this is not enough to drive a recovery as other data, such as the Employment Cost Index and statements from the Fed, still show persistent inflationary pressure. Therefore, the monetary policy remains hawkish, causing money to flow out of gold.
Currently, the price is approaching the critical support zone of 3,247. If this level is broken, the scenario of further declines to 3,192 is entirely possible.

Gold Crashes $100 After Hitting Monthly High | What’s Next?In this video, I break down everything that moved the price of gold last week, from the early-week rally toward $3,430 to the sharp midweek drop toward $3,325. We go beyond the surface, diving into what caused the reversal, and how I'm approaching next week’s market using a simple ascending channel on the 4-hour chart.
With major events like the FOMC rate decision, U.S. GDP, PCE inflation, NFP and the August 1 tariff deadline all on the radar, this analysis will help you stay grounded and prepare for volatility.
👉 If you find this content valuable, don’t forget to Boost, Comment, and Subscribe for weekly market breakdowns.
Disclaimer:
Based on experience and what I see on the charts, this is my take. It’s not financial advice—always do your research and consult a licensed advisor before trading.
#goldanalysis, #goldforecast, #xauusd, #goldpriceprediction, #technicalanalysis, #fundamentalanalysis, #tradingstrategy, #forextrader, #priceaction, #fomc, #usgdp, #pceinflation, #goldtrading, #forexeducation, #dollarvsgold, #tariffnews, #chartanalysis, #forexmentorship, #rebuildingthetraderwithin

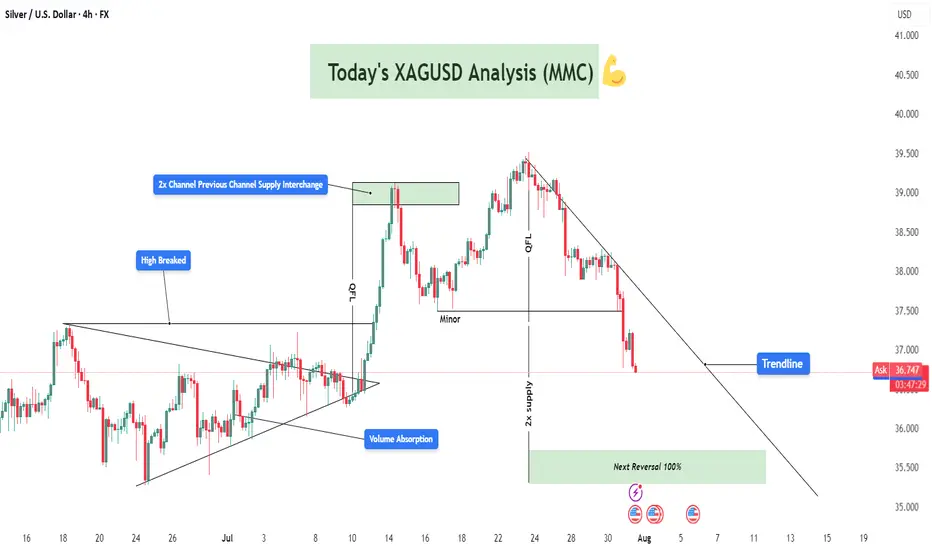
XAGUSD Analysis : Bearish Setup 2x Supply to Next Reversal Zone🔍 Market Context & Technical Overview
Silver (XAGUSD) has recently gone through a sharp corrective phase after breaking above a key structural high and retesting previous resistance. The current price action reflects a clean MMC-patterned behavior, including volume absorption, QFL trap, and interaction with a descending trendline that has now become critical for further directional bias.
🧠 Key Observations Based on MMC Principles
🔵 1. Volume Absorption at the Triangle Breakout
After a prolonged consolidation phase inside a triangle pattern, volume absorption took place—indicating hidden accumulation.
A breakout above the structure was confirmed with momentum (also breaking a previously established “High Breaked” level).
This breakout led to a vertical move towards the 2x Channel Supply Interchange Zone, where price reversed sharply.
🟥 2. Supply Interchange Zone (2x Confirmed)
Price encountered resistance at the green supply block, which acted as a 2x supply zone—a critical confluence where previous sellers re-engaged.
This area had previously served as the channel boundary, creating a supply interchange effect.
⚠️ 3. QFL Zone Trap (Fake Momentum)
The price printed a QFL structure, where it created a flat base, faked a move up, and quickly reversed.
The QFL base acted as a trap for late buyers, which aligned with the start of a bearish phase that is still ongoing.
📉 4. Downtrend & Trendline Respect
Price has respected a strong descending trendline since the reversal at supply.
Each retest has resulted in a lower high, confirming the bearish structure is intact for now.
Currently, the price is trading below this trendline, reinforcing short-term bearish sentiment.
📦 Key Levels to Watch
Zone/Level Type Role
38.70 – 39.20 2x Supply Zone Strong resistance, reversal origin
37.40 – 37.60 Minor Level Short-term support turned resistance
36.00 – 35.40 Next Reversal Zone ✅ High-probability long area, MMC expects reaction
Trendline Dynamic Structure control, needs break for bullish shift
🔁 Scenarios Based on Structure
📈 Scenario 1: Bullish Reversal from Green Demand Block
Price is approaching the next MMC reversal zone (green box below 36.00).
MMC logic suggests a 100% probability of bullish reaction based on:
Volume cycle completion
Downward exhaustion
Proximity to previous institutional accumulation zones
Expected move: bounce toward trendline retest and minor resistance at ~37.50.
📉 Scenario 2: Break Below Green Zone = Panic Sell
If the green zone fails to hold:
A panic drop toward 34.80–35.00 is possible.
However, based on MMC mapping, this is less likely without a major macro catalyst.
💡 Strategic Thoughts (MMC Traders’ Lens)
We’re observing a classic MMC Phase 3 correction following Phase 2 expansion.
The current cycle favors reaccumulation, especially if a wick or engulfing candle forms inside the green zone.
Price action traders should wait for confirmation (e.g., break of trendline, bullish structure on 1H) before entering.
📌 Educational Trade Plan (Not Financial Advice)
Setup Entry Zone Stop Loss Target 1 Target 2
Reversal Long 35.80 – 36.20 35.40 37.50 38.70
Trendline Break Long Above 37.10 36.40 38.00 39.00
Bearish Continuation Below 35.40 36.10 34.80 33.90
🧾 Conclusion & Final Note
Silver is trading at a make-or-break point as it approaches a high-probability reversal zone, identified through MMC methodology. Watch the price action near 36.00 closely—it holds the key to whether we begin a new bullish phase or extend this bearish cycle.
✅ MMC traders will stay reactive, not predictive, and align with structure.
🚨 Patience is key—let the market show its hand before commitment.
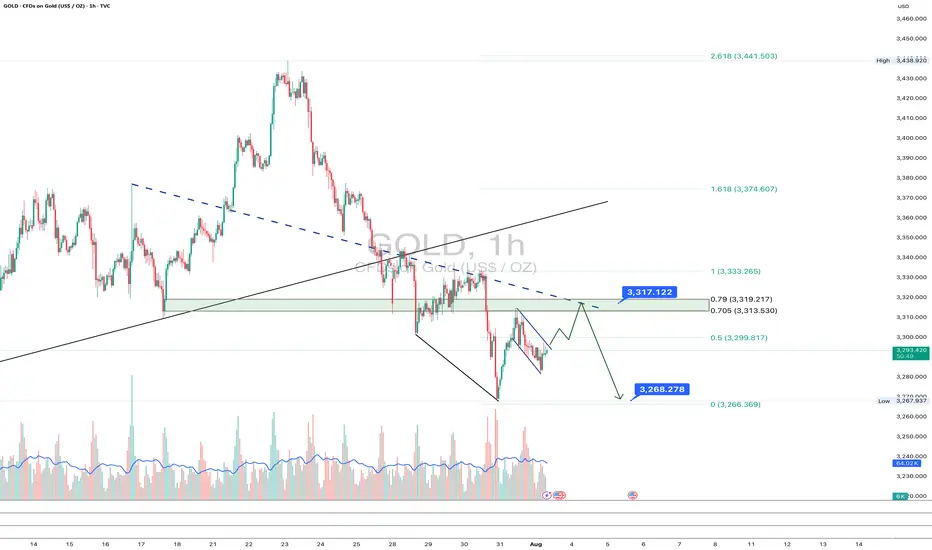
Gold: final pullback or bull trap?On the 1H chart, gold (GOLD) is forming a bullish flag after a sharp decline, which may just be a corrective move within a broader downtrend. The price is now approaching the key resistance zone around $3313–$3317 - this area holds the POC, broken trendline, and the 0.705–0.79 Fibonacci retracement from the last drop. This is the decision-making zone.
If bulls fail to push above it, we expect a move down toward $3268 - the next strong support and potential buy zone, also confirmed by Fibonacci and local demand. Stochastic divergence and slowing volume suggest a possible rebound from that level. However, if the price breaks and holds above $3317, this would indicate a local trend reversal, with targets at $3333 and $3374.
Watch the $3317 zone closely - bulls have yet to prove this is more than just a bounce.
EURGBP Steps Into A Correction Within Ongoing RecoveryEURGBP is sharply down after reaching April highs for wave »v« of an impulse into wave A. As expected, the pair is now unfolding a three-wave abc corrective setback within higher-degree wave B. Currently, EURGBP is breaking below the channel support line in a sharp and impulsive projected wave »a«. A corrective recovery in wave »b« may follow, considering that RSI is already at the lower side of its range. Overall, we are still tracking this correction toward the 0.85x support area, which could act as a base before a potential bullish continuation higher into wave C.
