EURUSD – Is the rally over? Time for a collapse?The technical picture reveals that EURUSD is losing momentum after a brief rebound. The 1.1700 level stands as a key resistance – if bulls fail to break it, the bears will take the wheel! A clear scenario is forming: lower highs, FVGs filled, and a potential drop toward the 1.1580 support zone this week.
The bad news for the euro isn’t over: yesterday’s Eurozone PMI data disappointed heavily, signaling stagnating growth. Meanwhile, the USD is gaining traction from strong labor data and hawkish Fed remarks, putting EURUSD under double pressure.
If the ascending trendline breaks, EURUSD could plunge even further – get ready for a potential breakdown!
Suggested strategy: Prioritize SELL below 1.1700, with a short-term target at 1.1580.
Stop-loss: Above 1.1720 – a breakout here would invalidate the bearish setup.
Technical Analysis

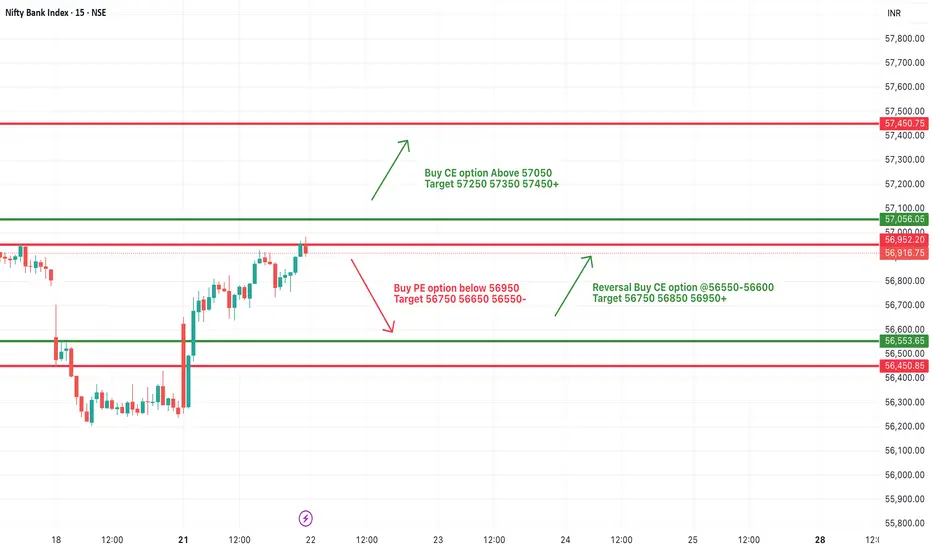
[INTRADAY] #BANKNIFTY PE & CE Levels(22/07/2025)Bank Nifty is expected to open gap-up today, continuing the momentum seen in yesterday’s session. The index has successfully crossed above the short-term resistance zone near 56,900, showing bullish strength. The next key breakout level is at 57,050, and once crossed decisively, we may see a sharp upward rally.
Traders can look to Buy CE option above 57,050, targeting 57,250, 57,350, and 57,450+. The structure indicates that momentum buyers may take over above this zone, with the potential for strong upside if Bank Nifty sustains above the breakout level.
On the downside, if the index slips back and breaks 56,950 decisively, then Buy PE option below 56,950 can be considered, with potential downside targets of 56,750, 56,650, and 56,550-. This zone will act as an immediate intraday support and any fall below it can lead to quick profit-booking.
Additionally, if Bank Nifty finds support near the 56,550–56,600 zone again, traders may also consider reversal CE buying with upside targets of 56,750, 56,850, and 56,950+.
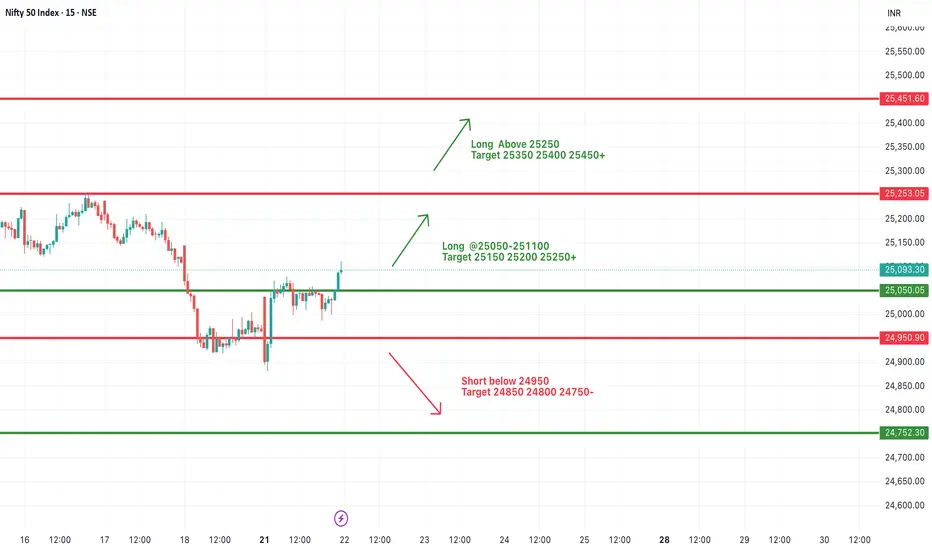
#NIFTY Intraday Support and Resistance Levels - 22/07/2025Today, Nifty is expected to open slightly gap-up, indicating positive early sentiment. After breaking out from the previous day’s consolidation zone, the index has shown strength around the 25,050 level, which will now act as an important intraday support. If this level is held during the early session, we can expect further upside continuation.
A move above the 25,050–25,100 zone can trigger upward momentum with potential targets at 25,150, 25,200, and 25,250+. Sustained strength above 25,250 will open the door for further bullish moves toward 25,350, 25,400, and 25,450+, making it a favorable long scenario for trending market conditions.
However, if the index fails to hold above the 25,050 level and starts trading back below 24,950, it may again enter a bearish territory. In such a case, downside targets of 24,850, 24,800, and 24,750- are possible, indicating weakness and reversal from resistance.
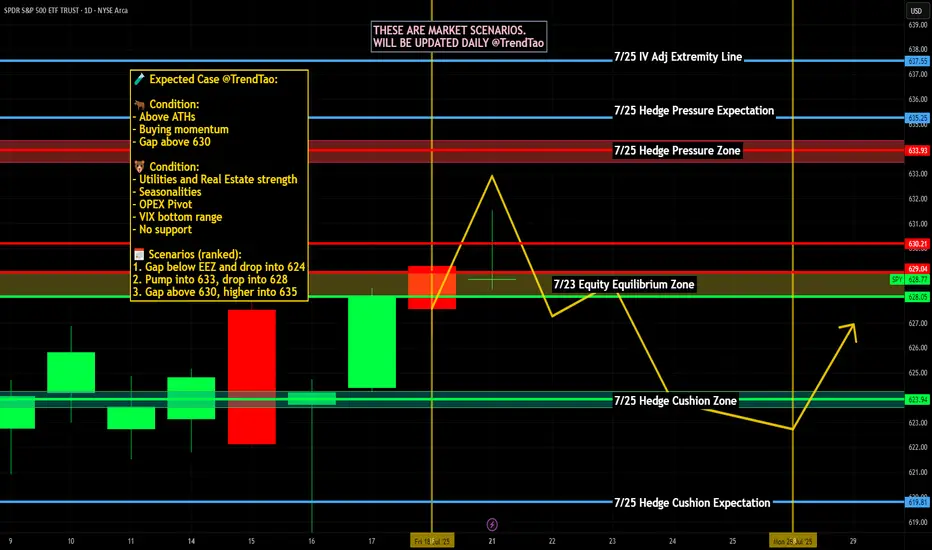
Nightly $SPY / $SPX Scenarios for July 22, 2025🔮 Nightly AMEX:SPY / SP:SPX Scenarios for July 22, 2025 🔮
🌍 Market-Moving News 🌍
🚀 Tech & EV Stocks in Focus Ahead of Earnings
Futures were quiet ahead of Tuesday’s open, but key movers included Astera Labs (+19%), Alphabet (+2.7%), Netflix +2%, and Robinhood –4.9% after being passed over for the S&P 500. Investors are positioning ahead of major tech and EV earnings this week — including Tesla, Alphabet, Lockheed Martin, Coca‑Cola, and Honeywell
📣 Powell Speech Eyed for Rate Clues
Fed Chair Jerome Powell is set to speak at 8:30 AM ET today at the Integrated Review of the Capital Framework for Large Banks Conference in D.C. Markets will be watching for any indications on future interest rate direction
🌏 Japan’s Political Shift Has Little Market Impact
Japan’s ruling coalition lost its upper-house majority over the weekend, but markets remained stable as it was largely expected. The yen held steady, and Asian equities stayed calm amid the holiday—focus remains on upcoming corporate earnings
📊 Key Data Releases & Events 📊
📅 Tuesday, July 22:
8:30 AM ET – Powell Speech: Key address at the bank regulation conference. Tone and forward guidance may sway bond and equity markets.
After Market Close – Alphabet & Tesla Earnings: Heavyweights due today—market attention will track revenue guidance, especially on advertising, EV demand, and AI.
⚠️ Disclaimer:
For educational and informational purposes only. Not financial advice—consult a licensed advisor before making investment decisions.
📌 #trading #stockmarket #tech #Fed #earnings #AI #infrastructure #volatility
XAUUSD – Strong bullish structure, buyers in control!Gold is trading within a well-defined ascending channel, with each higher low being consistently respected – indicating strong buying pressure. The recent move broke through a fair value gap (FVG) and is approaching short-term resistance. High-probability scenario: a pullback toward the rising trendline, followed by a strong rebound aiming for the previous highs.
RSI remains in a positive zone, supporting the bullish bias. If the trendline support holds, the next target is the upper resistance area.
Supporting news: The US dollar has stalled after a sharp rally, while persistent inflation concerns and renewed hopes for a mild Fed rate cut are boosting gold’s appeal.

Could this dip $5 to $3 be a buy gift before double digits?Could this dip $5🔻$3 be a buy gift before NASDAQ:OPEN goes into double digits on NYSE:GME style vertical squeeze? 🤔
We haven't seen such 1 day volume in years so nobody really knows what's next 👀

USDJPY
Date:
July 21,2025
Session:
New York Open
Pair:
USDJPY
Bias:
Long
1. Clean liquidity pool left unswept from last week's NYC Open (Thursday).
2. NY session typically retraces or extends from London reversal, giving directional momentum.
Entry:147.544
Stop Loss:147.250
Target:148.794
RR:4.11

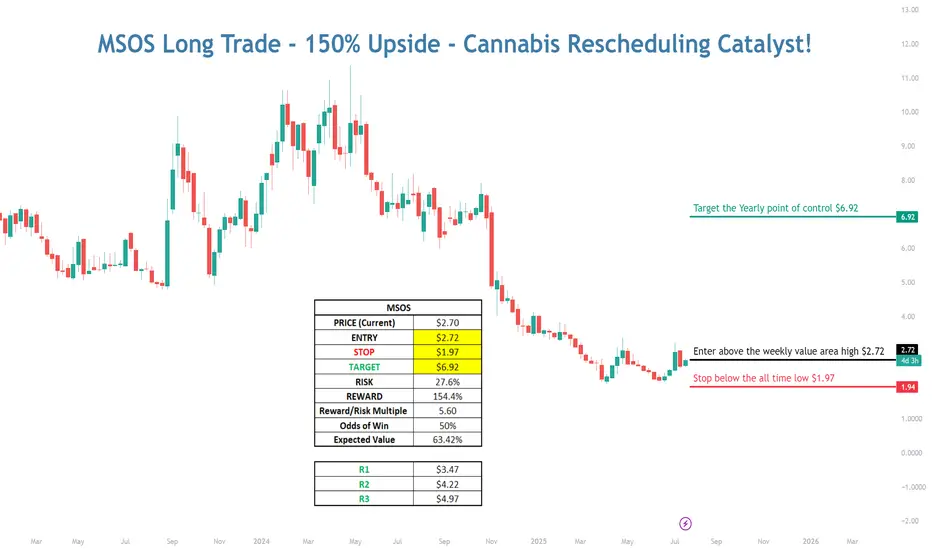
MSOS Long with 150% Upside - Cannabis Rescheduling Catalyst💠 Catalyst : Cannabis is currently classified as a schedule I drug alongside heroin, bath salts, and synthetic opioids that kill thousands every year — all while being safer than Tylenol and legal in over half the country. Cannabis is likely to be rescheduled to a schedule III drug soon after Terry Cole is confirmed as the head of the DEA. The vote to confirm him is expected to take place...TODAY
As a schedule I drug, cannabis companies can’t deduct regular business expenses for tax purposes, have limited access to banking, must transact with customers in all cash, and US multi-state operators are unable to list on the major US exchanges.
Terry Cole will be confirmed as the new head of the DEA, and when he is confirmed, the stalled process to reschedule cannabis from a schedule I to a schedule III drug should resume. If cannabis is rescheduled, that will pave the way for further research, destigmatize it, and open the door to banking and uplisting of US multi-state operators to the major exchanges in the near future.
This trade capitalizes on the fact that investors are not positioned for reform and further positive catalysts. The worst-case scenario is priced into the MSOS ETF, and when good news on rescheduling hits the tape, that should start a NEW Bull market in the MSOS cannabis stocks.
💠 Technical Setup:
Bear Market
• Multi-year bear market throughout the entire Biden administration on promises to reschedule that were never followed through on
• Capitulation when Trump won the election on the prospect of potentially another 4 years of no reform
Bearish to Bullish Technical Transition!
• LT Stage 1A Bottom Signal (Price > 50D SMA)
• ST Stage 2A Breakout (First day Price > 10D EMA and 20D SMA)
• Hourly Chart – Breaking out above Weekly Value Area
• Daily Chart – Trading above the Monthly Value Area
• Overlapping prior monthly value areas in sight!
• VPOC in sight!
• Weekly Chart – Targeting a retest of the Yearly POC
💠 Trade Plan
ENTRY: $2.72 (Break above weekly value area high)
STOP: $1.97 (Below the prior all-time-low)
TARGET: 6.92 (A retest of the yearly point of control from 2024)
RISK: 27.6%
REWARD: 154.4%
R/R Multiple: 5.6X
Probability of Win: 50%
Expected Value: 63.42%

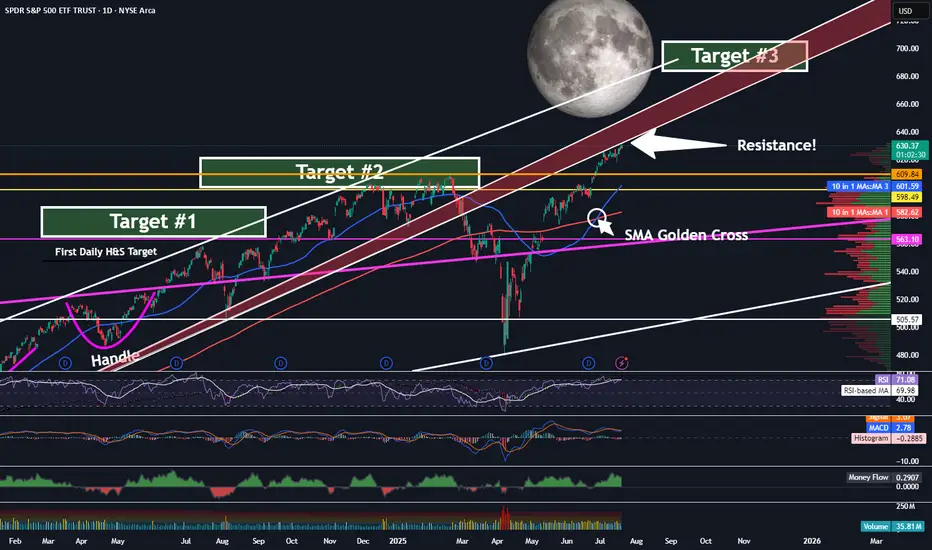
SPY - On Our Way To Target 3 ...But First?Trading Fam,
It's been a while since I updated you all on the SPY, which, as you know, we track closely to help us determine the overall market trend. Since we have now exceeded my Target #2, it's time for me to give you all another update. But first, a little context for my new readers which I have been getting a lot of recently, thanks to my new indicator hitting it out of the park.
So, we began marking targets on our chart here after spotting an inverse H&S on the daily chart a few years ago. Many of my followers back then were doubtful the pattern would fully form, or if it did, that it would actually play out. But the pattern completed about 14 months ago and subsequently broke the neckline in June of last year. I then knew we were going full send and have been predicting a 700 SPY final target since. This target has been made utilizing both that inverse H&S pattern as well as a longer-trend Elliot Wave, which I don't have denoted here at this point. The chart gets too messy with all of my markings. Regardless, we are currently in wave 5 and heading steadily towards that 670-700 target #3, my final target.
But be careful! Today, we have hit the underside of that RED area, which is HUGE resistance. I would expect that we will NOT break straight through this without some pullback prior. Indeed, the market is overextended at this moment, and we'll need the volume to be able to push through. Could this occur? Of course, anything is possible. But, it is not likely right now.
My guess is that we'll at least pull back to one of those levels below us or possibly even re-touch that 200 SMA in red before the final push.
Anyways, it is worth taking note of what may be ahead of us in the next few weeks or months so that you can plan your trades accordingly. Stay with me. We're almost there.
✌️Stew
MSOS Long with 150% Upside - Cannabis Rescheduling Catalyst💠 Catalyst: Cannabis is currently classified as a schedule I drug alongside heroin, bath salts, and synthetic opioids that kill thousands every year — all while being safer than Tylenol and legal in over half the country. Cannabis is likely to be rescheduled to a schedule III drug soon after Terry Cole is confirmed as the head of the DEA. The vote to confirm him is expected to take place...TODAY
As a schedule I drug, cannabis companies can’t deduct regular business expenses for tax purposes, have limited access to banking, must transact with customers in all cash, and US multi-state operators are unable to list on the major US exchanges.
Terry Cole will be confirmed as the new head of the DEA, and when he is confirmed, the stalled process to reschedule cannabis from a schedule I to a schedule III drug should resume. If cannabis is rescheduled, that will pave the way for further research, destigmatize it, and open the door to banking and uplisting of US multi-state operators to the major exchanges in the near future.
This trade capitalizes on the fact that investors are not positioned for reform and further positive catalysts. The worst-case scenario is priced into the MSOS ETF, and when good news on rescheduling hits the tape, that should start a NEW Bull market in the MSOS cannabis stocks.
💠 Technical Setup:
Bear Market
• Multi-year bear market throughout the entire Biden administration on promises to reschedule that were never followed through on
• Capitulation when Trump won the election on the prospect of potentially another 4 years of no reform
Bearish to Bullish Technical Transition!
• LT Stage 1A Bottom Signal (Price > 50D SMA)
• ST Stage 2A Breakout (First day Price > 10D EMA and 20D SMA)
• Hourly Chart – Breaking out above Weekly Value Area
• Daily Chart – Trading above the Monthly Value Area
• Overlapping prior monthly value areas in sight!
• VPOC in sight!
• Weekly Chart – Targeting a retest of the Yearly POC
💠 Trade Plan
ENTRY: $2.72 (Break above weekly value area high)
STOP: $1.97 (Below the prior all-time-low)
TARGET: 6.92 (A retest of the yearly point of control from 2024)
RISK: 27.6%
REWARD: 154.4%
R/R Multiple: 5.6X
Probability of Win: 50%
Expected Value: 63.42%
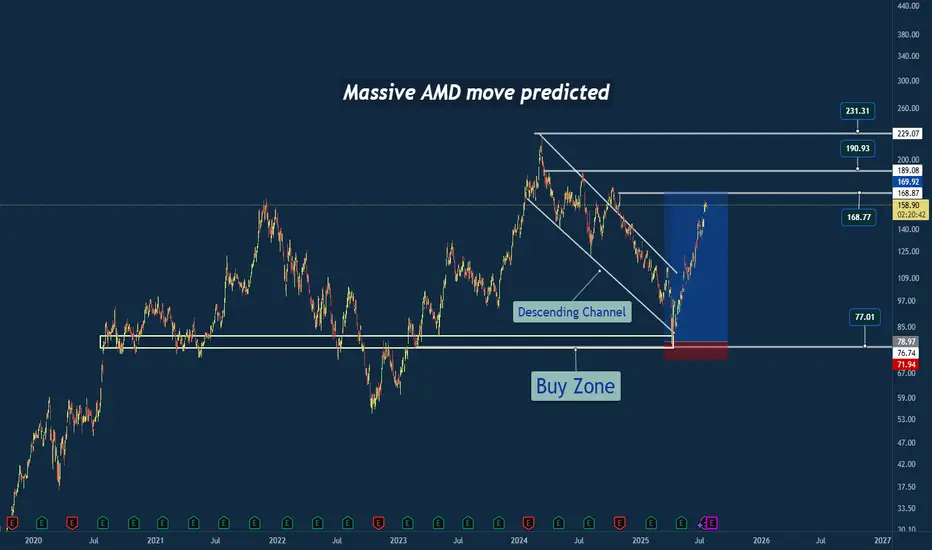
Why I Went Long on AMD Near the 2025 Lows🔍 Reason for the Trade
This wasn’t just a “buy the dip” setup — this was a calculated trade based on strong confluence:
✅ Multi-Year Demand Zone
Price returned to a massive support level that’s held since 2020. This zone had previously triggered multiple large bullish reversals.
✅ Falling Wedge Breakout
A textbook falling wedge pattern formed during the pullback. Once price broke out, the momentum confirmed a structural reversal.
✅ Risk/Reward Optimization
I positioned my stop just under key support, with targets set at prior structure highs. The setup offered a clean 2.5:1+ R/R ratio, perfect for swing conviction.
✅ Institutional Accumulation Area
The volume and wick rejections in this zone screamed smart money stepping in. It was a classic sign of fear-based selling into patient buyers.
🧠 Lessons Reinforced
- Wait for the Zone, Then Act: Patience paid off — the best trades come from the best levels.
- Structure Over Emotion: I trusted the technical, not the bearish headlines.
- R/R Always Wins: You don’t need to be right every time, but when you’re right — let it run.
#AMD #SwingTrade #TechnicalAnalysis #SupportAndResistance #WedgeBreakout #RiskReward #PriceAction #StockMarket #TradingView #TradeRecap
Ethereum: Breakout Holds Strong | Next Targets $4K, $7K+Last week, three major crypto bills cleared the U.S. House of Representatives—and Ethereum (ETH) is emerging as the biggest winner from this legislative momentum.
ETH recently broke out of a rounding bottom pattern and hasn’t looked back. Momentum continues to build, and it’s now outperforming most other major assets.
📈 Technical Highlights:
✅ Short-term target: $4,000
✅ Long-term potential: $7,000–$8,000
🛡️ Key support: $2,700–$2,800 (bullish as long as this holds)
📣 Takeaway:
Ethereum’s breakout remains intact. Pullbacks into support could offer high-probability setups for swing traders and long-term investors.
#Ethereum #ETHUSD #Crypto #Trading #TechnicalAnalysis #CryptoTrading #EthereumPrice #Altcoins #Bullish #Breakout

$0.50 to $4.00 up nearly 1,000% in the past trading days😲 $0.50 to $4.00 up nearly 1,000% in the past trading days 💥 600 Million shares traded today so far
People must be thinking NASDAQ:OPEN means stock of OpenAI, hey everyone this is not ChatGPT stock

QUIET START TO THE WEEK, WATCH OUT FOR KEY RESISTANCE!🔔 GOLD PLAN 21/07 – QUIET START TO THE WEEK, WATCH OUT FOR KEY RESISTANCE!
🌍 Market Overview
Gold has bounced back strongly following a brief pullback late last week. The move comes as geopolitical tensions and global conflicts continue to escalate.
While this week may not feature high-impact economic data, macroeconomic risks and global uncertainty remain the primary drivers of price action.
📊 Technical Outlook
Price is currently approaching a strong resistance zone between 3377–3380, which aligns with a Buy Side Liquidity region.
💡 Sellers may step in here to push the price lower, aiming to fill FVG zones (Fair Value Gaps) left behind during the previous bullish rally.
⚠️ Entering SELL positions at this level is risky — only act upon confirmed reversal signals (candlestick rejection or volume-based confirmation).
🎯 Trade Setup
🟢 BUY ZONE: 3331 – 3329
Stop Loss: 3325
Take Profits:
3335 → 3340 → 3344 → 3348 → 3352 → 3358 → 3364 → 3370
🔴 SELL ZONE (confirmation required): 3377 – 3379
Stop Loss: 3383
Take Profits:
3372 → 3368 → 3364 → 3360 → 3350
📌 Key Notes
The 3347 zone acts as short-term support for bulls. If this level breaks, a move toward lower FVG liquidity zones becomes more likely.
Keep an eye on EU session volume for clearer short-term direction and better trade timing.
✅ Final Thoughts
Discipline is key. Stick to your TP/SL strategy to manage risk effectively during early-week volatility.
🛡️ Wishing everyone a successful start to the week. Stay patient, stay focused.
GOD BLESS ALL!

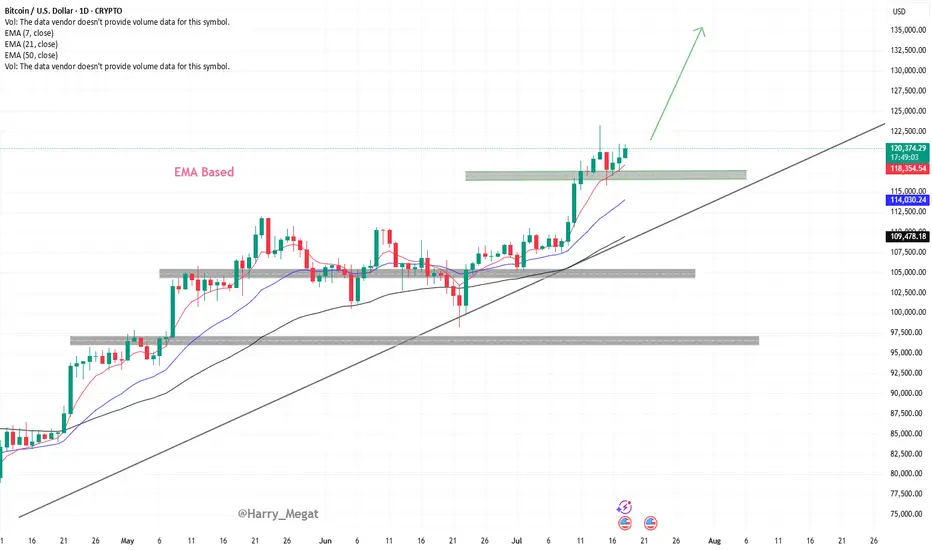
Bitcoin (BTC/USD) Technical AnalysisBitcoin (BTC/USD) Technical Analysis – Daily Chart Overview
This chart shows a **bullish continuation setup** for Bitcoin, supported by **EMA structure**, **trendline**, and **support zone** validation. Here's the detailed breakdown:
**1. Trend & Structure**
* **Uptrend:** Price is in a clear uptrend, making higher highs and higher lows.
* **Trendline:** The ascending trendline confirms strong upward momentum. It has been respected multiple times, acting as dynamic support.
**2. Key Support Zones**
* **Recent Breakout Zone (\~\$118,000 – \$119,000):**
Bitcoin broke out above this horizontal resistance and is now **retesting it as support**. This is a classic bullish retest pattern.
* The chart suggests that as long as price holds above this zone, **bullish continuation** is expected.
**3. EMA Indicators (Exponential Moving Averages)**
* **7 EMA (Red) – \$118,386**
* **21 EMA (Blue) – \$114,042**
* **50 EMA (Black) – \$109,483**
All EMAs are **sloping upwards** and aligned in bullish order (7 > 21 > 50), confirming strong upside momentum. The price is currently above all EMAs, which supports a continuation of the bullish trend.
**4. Bullish Target**
* The green arrow suggests a projected bullish move with a potential target above **\$130,000–\$132,500**, assuming price holds the support and resumes upward.
**5. Risk Area**
* If BTC closes **below the highlighted support zone (\~\$118,000)**, it could invalidate the bullish structure temporarily and push toward the next support near **\$114,000–\$115,000**.
**Conclusion**
* **Bias:** Bullish
* **Actionable Insight:**
* As long as BTC remains above the \$118K support zone and trendline, **buy dips** or **hold longs**.
* A clean break and close above recent highs (\~\$121K–\$122K) could open the door toward **\$130K+** targets.
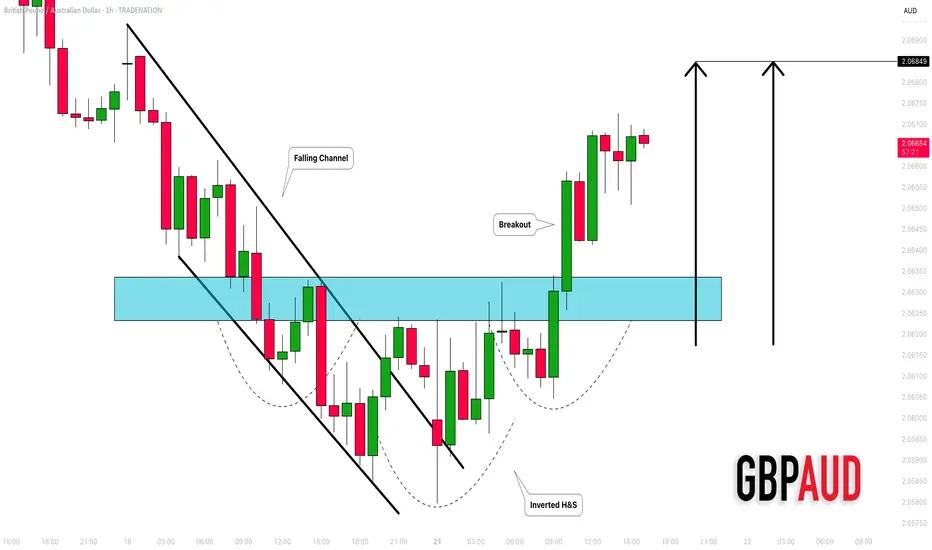
GBPAUD: Bullish Movement Continues 🇬🇧🇦🇺
GBPAUD is going to rise more, following a confirmed intraday bullish reversal:
first, the price violated a resistance line of a falling channel.
It started to consolidate within an inverted head & shoulders pattern then.
Its neckline violation is another strong bullish signal.
Next resistance - 2.0685
❤️Please, support my work with like, thank you!❤️
I am part of Trade Nation's Influencer program and receive a monthly fee for using their TradingView charts in my analysis.
Gold Nears $3,350 as Tariff Risks PersistGold rose to around $3,350 per ounce on Monday, extending its gains for a second session amid concerns over Trump’s tariff strategy. Commerce Secretary Howard Lutnick said a deal with the EU is likely but confirmed the August 1 tariff deadline. He also suggested smaller countries could face at least a 10% tariff, with some rates reaching 40%. Strong US data last week reduced expectations for an immediate Fed rate cut, capping gold’s gains. Markets now await comments from Fed Chair Powell and Governor Bowman for policy signals.
Gold faces resistance at 3380, with additional barriers at 3400 and 3430. Support levels are positioned at 3330, followed by 3295 and extending down to 3250.

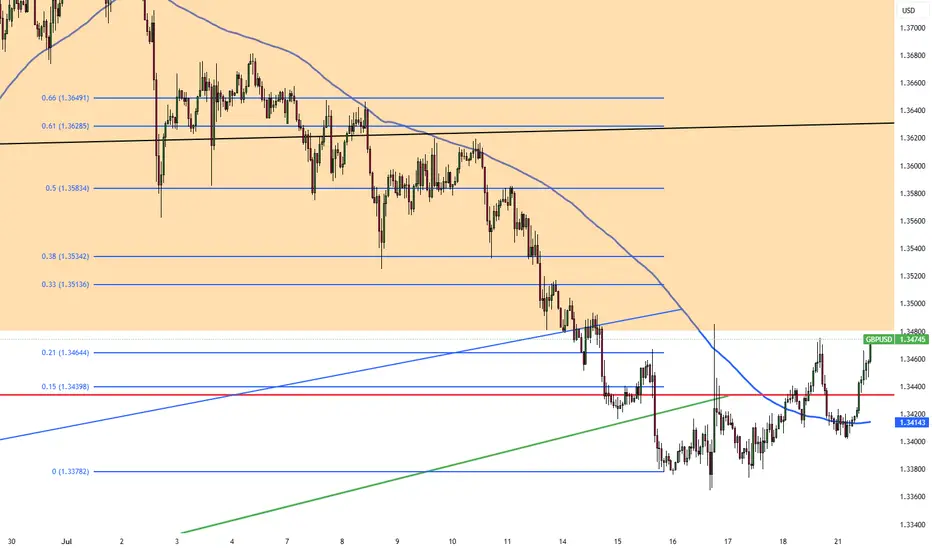
Pound Pressured by Rising UK Jobless RateGBP/USD started the week steady, trading just above 1.3400 during the Asian session and holding near last week’s two-month low. The US Dollar remains soft below Thursday’s monthly peak, as markets weigh the prospects of a Fed rate cut. Although Fed Governor Waller backed a July cut, most investors expect the Fed to keep rates higher for longer due to Trump’s tariffs impacting consumer prices.
The British Pound is under pressure as markets price in a potential Bank of England rate cut in August. UK labor data showed unemployment rising to 4.7%, a four-year high, and annual pay growth slowing to 5%, the weakest since Q2 2022. This limits GBP/USD upside despite persistent inflation.
For GBP/USD, resistance is seen at 1.3535, with the next levels at 1.3580 and 1.3630. Support stands at 1.3380, followed by 1.3270 and 1.3140.
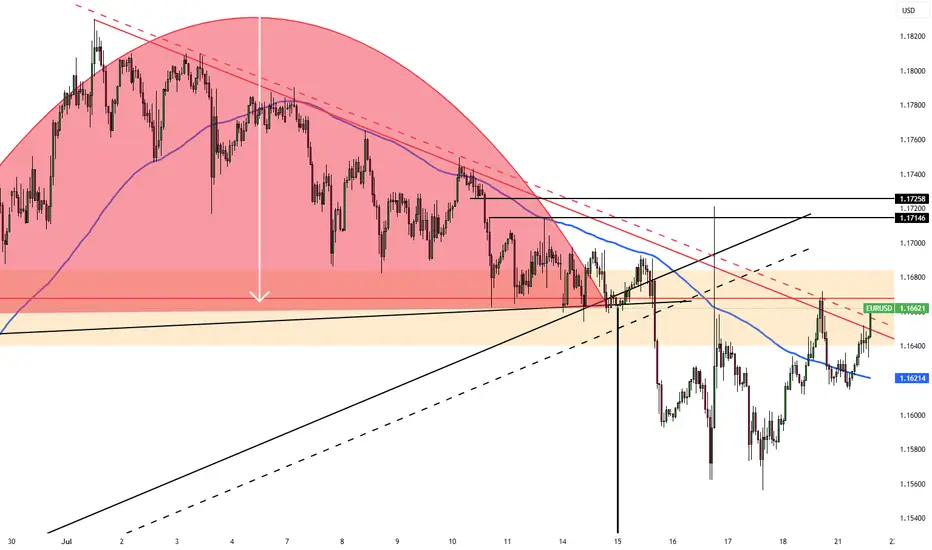
EUR/USD Analysis by zForex Research Team - 07.21.2025EUR/USD Pulls Back Amid Trade Deal Uncertainty
EUR/USD edged down to 1.1620 during Monday’s Asian session, after gains in the previous session, as the US Dollar stayed firm and traders remained cautious ahead of the August 1 tariff deadline.
US Commerce Secretary Howard Lutnick said the Trump administration expects to finalize trade deals with major partners in the coming weeks, calling the next two weeks “historic.” He expressed optimism about reaching an agreement with the EU but confirmed that August 1 remains a firm deadline for new tariffs.
Resistance levels for EUR/USD are set at 1.1670, followed by 1.1700, and extend up to 1.1750. On the downside, support is found at 1.1580, with additional levels at 1.1540 and 1.1500.
USD/JPY Analysis by zForex Research Team - 07.21.2025Yen Recovers After Japan’s Upper House Election
The Japanese yen rose to around 148.5 per dollar on Monday, recovering some of last week’s losses after the ruling coalition lost its upper house majority. Markets had mostly priced in the result, limiting the reaction. Prime Minister Ishiba is expected to remain in office, which could ease concerns over political instability.
The opposition is likely to push for more spending and tax cuts, which could pressure the yen and lift bond yields. The election outcome comes as Tokyo continues trade talks with Washington. US Commerce Secretary Lutnick confirmed the August 1 tariff deadline but said negotiations will continue.
For the yen, resistance stands at 149.30, followed by 151.50, with the next key level at 155.00. Support is located at 147.50, with further levels at 146.15 and 145.30.

Dow Jones is Nearing an Important Support!!Hey Traders, in today's trading session we are monitoring US30 for a buying opportunity around 43,950 zone, Dow Jones is trading in an uptrend and currently is in a correction phase in which it is approaching the trend at 43,950 support and resistance area.
Trade safe, Joe.

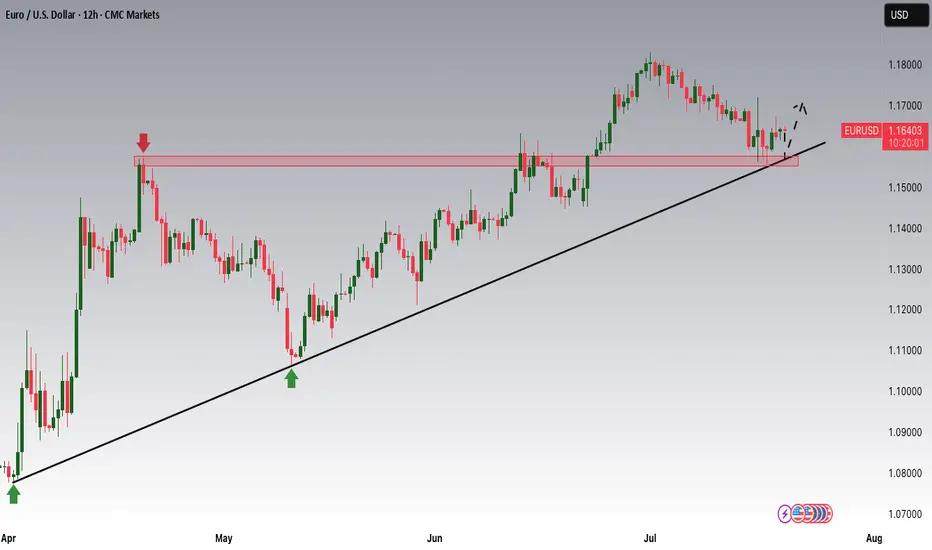
EURUSD is Nearing the Daily Uptrend! Hey Traders, in today's trading session we are monitoring EURUSD for a buying opportunity around 1.15800 zone, EURUSD is trading in an uptrend and currently is in a correction phase in which it is approaching the trend at 1.15800 support and resistance area.
Trade safe, Joe.
NASDAQ INDEX (US100): Bullish Continuation Confirmed
NASDAQ Index broke and closed above a resistance of a horizontal
parallel channel on a daily.
It confirms a bullish trend continuation and a highly probable growth
to the next strong resistance.
Goal - 23300
❤️Please, support my work with like, thank you!❤️
