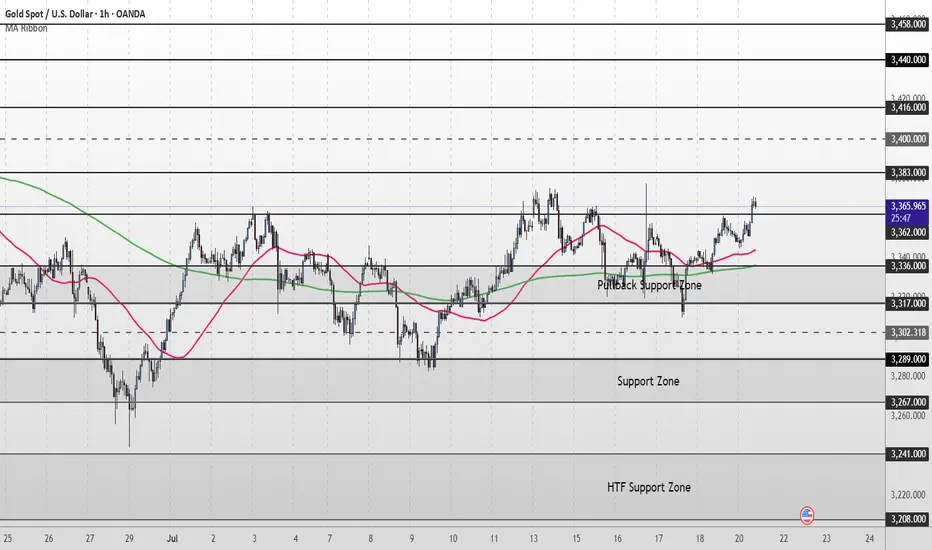
XAU/USD Intraday Plan | Support & Resistance to WatchGold has extended its recovery and is now trading around 3,366, pushing into the next resistance cluster.
Price is holding firmly above both the 50MA and 200MA, which are now flattening and beginning to turn upward, acting as dynamic support.
A confirmed break and hold above 3,362 would open the path toward the next upside targets at 3,383 and 3,400, with 3,416 and 3,440 as higher‑timeframe resistance levels if momentum continues.
If price rejects the 3,362 resistance zone and fades lower, watch the Pullback Support Zone (3,336–3,317) closely. A break back below that area would shift focus to the broader Support Zone (3,289-3,267).
Failure to hold there could expose price to the deeper HTF Support Zone.
📌 Key Levels to Watch
Resistance:
3,362 ‣ 3,383 ‣ 3,400 ‣ 3,416
Support:
3,336 ‣ 3,317 ‣ 3,302 ‣ 3,289 ‣ 3,267
🔎 Fundamental Focus – Week of July 21–25
📌 Tuesday, Jul 22
Fed Chair Powell Speaks
📌 Thursday, Jul 24
Unemployment Claims
Flash Manufacturing PMI & Flash Services PMI
Technical Analysis
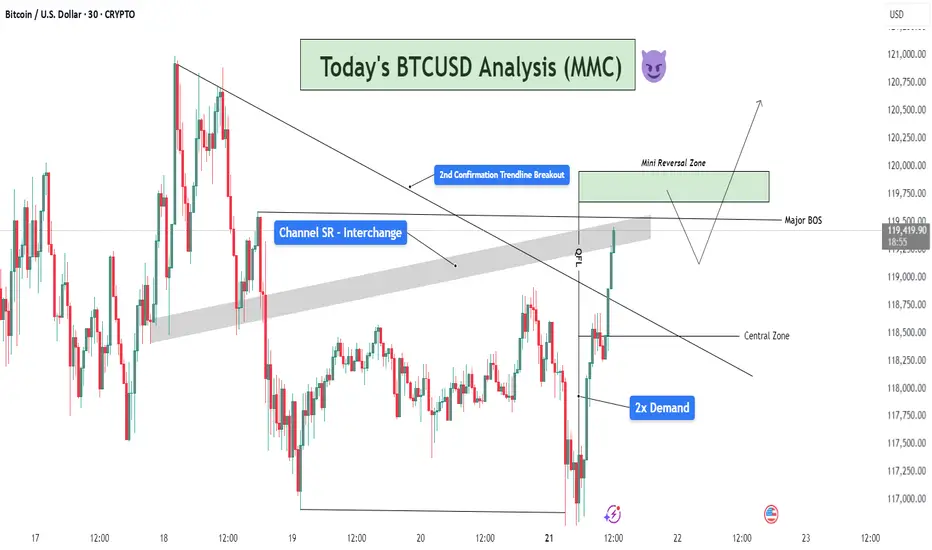
BTCUSD MMC Analysis - Breakout Confirmation + Reversal + TargetWelcome back to another deep-dive analysis powered by MMC (Mirror Market Concepts), where precision meets market psychology. In today’s BTCUSD setup, we’re observing a textbook confluence of structural breakouts, demand rejections, and liquidity zone engagements. Let’s break it down step by step.
📊 1. Market Context & Background
The market recently showed a prolonged bearish trendline structure, with lower highs compressing price into a wedge. The prior days have been consolidative, hinting at an accumulation phase. This forms the foundation for reversal setups we often identify in MMC-style analysis — where liquidity, not just structure, determines the next move.
🔍 2. Demand Zone Dominance – 2x Tap Confirmation
At the bottom of the chart, BTC created a strong 2x Demand Zone (117,250–118,000 area), a region where buyers aggressively stepped in. This zone had already been tested once, and the second tap confirmed demand strength — a key MMC signal.
This dual-tap created a spring effect, launching price upward and rejecting all downside liquidity grabs. It also showed clear absorption of sell-side volume.
📈 3. QFL Behavior + Break of Structure
We see a QFL (Quick Flip Liquidity) reaction just after price bounced from demand — this is a behavior unique to MMC models. Here, price flipped structure rapidly after breaking a local high near 118,500, suggesting aggressive buyer entry.
This QFL event served as the first warning for a major trend shift.
Right after that, we got a major BOS (Break of Structure) above 119,250, further confirming the bullish transition.
🪜 4. Trendline Breakout – Second Confirmation
The descending trendline — connecting several swing highs — was breached with strong bullish momentum. Importantly, this was the second confirmation breakout, not just a fakeout spike.
The breakout candle closed strongly above the trendline and above the SR channel zone (gray area), confirming trend reversal intent.
This aligns with MMC's multi-stage breakout logic, where price gives one trap, pulls back, and then breaks cleanly with intent.
🛡 5. Channel SR Interchange Zone (Support-Resistance Flip)
The gray horizontal SR Channel played a crucial role. Initially acting as resistance, it became support once the breakout was confirmed.
This interchange behavior — a principle where support turns into resistance or vice versa — is critical in MMC. Price flipping this zone and holding above is a strong continuation signal.
🧠 6. Targeting & Forward Outlook
Price is now approaching the Mini Reversal Zone (119,750–120,250). This is a low-timeframe liquidity zone where short-term traders may take profits or where institutional orders may reverse temporarily.
Here are two potential scenarios:
Bullish Continuation: If price pulls back slightly and holds the channel SR as support, we may see a continued leg upward, breaking above 120,250.
Temporary Rejection: A sharp reaction from the Mini Reversal Zone could lead to a retracement into the Central Zone (~118,800), where buyers might reload.
📌 Key MMC Takeaways:
✅ 2x Demand Zone reaction confirmed bullish interest.
✅ QFL + BOS + Trendline Break = High-conviction reversal signal.
✅ SR Flip adds MMC-style structural layering.
✅ Price is now navigating final supply zones before expansion.
👑 Join the Candle King Community
If you find value in these advanced MMC analyses, join the Candle King server — a professional community focused on refining trading journeys through advanced market theory like Mirror Market Concepts, QFL, and real-time price logic.
📢 We don’t just trade levels — we trade behavior.
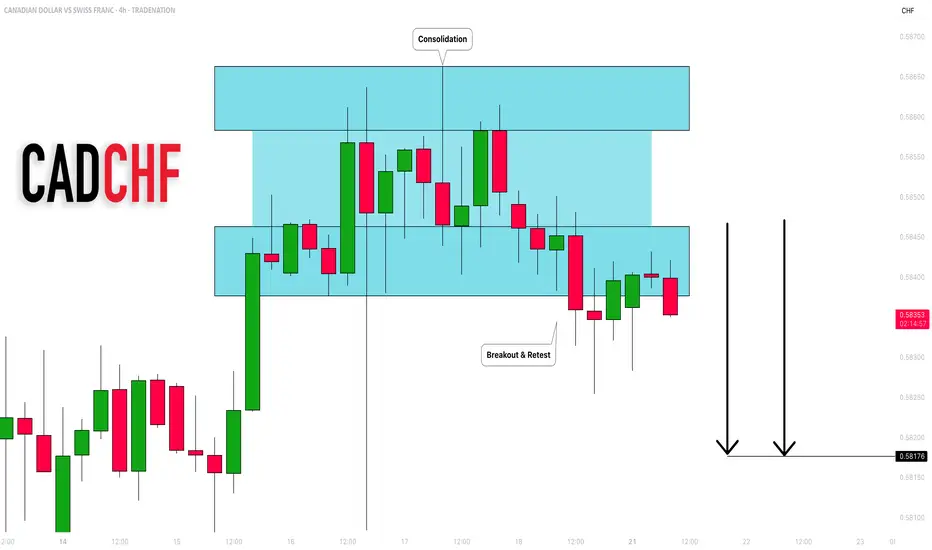
CADCHF: Bearish Outlook Explained 🇨🇦🇨🇭
CADCHF completed an intraday consolidation within a horizontal
parallel channel.
Its support was broken on Friday and we see a positive bearish
reaction to that after its retest.
With a high probability, the price will drop to 0.582 level soon.
❤️Please, support my work with like, thank you!❤️
I am part of Trade Nation's Influencer program and receive a monthly fee for using their TradingView charts in my analysis.
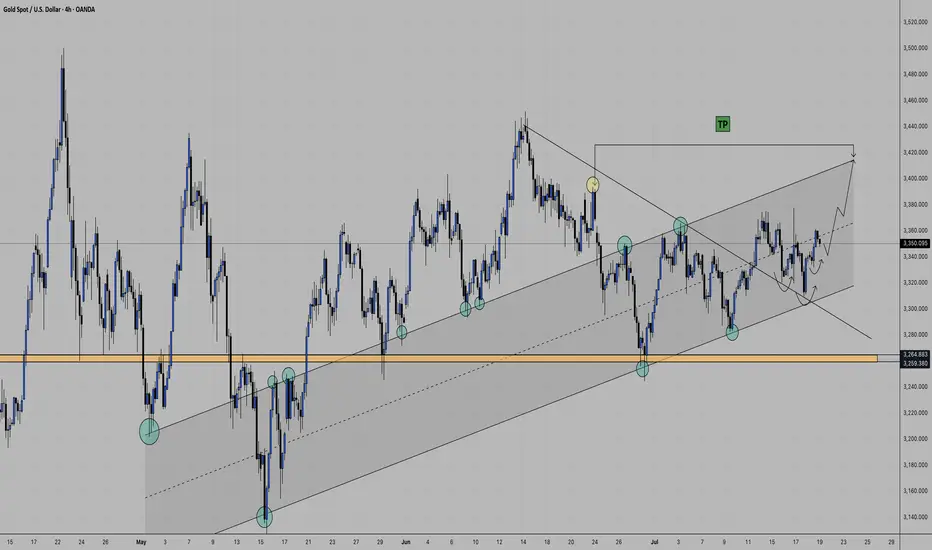
Today's GOLD Analysis – Structural Breakout and Bullish Setup🔷 1. Descending Channel – End of Bearish Phase
The chart initially shows Gold trading inside a well-defined descending channel, where price was consistently respecting both upper and lower trendlines. This movement reflected short-term bearish pressure, likely driven by fundamental uncertainty and lower time frame liquidity grabs.
However, the price broke above the channel with a strong bullish candle, which is a clear sign of momentum shift. Breakouts like these usually signify the end of a corrective phase and the beginning of a trend reversal or impulsive leg.
🔷 2. Minor Break of Structure (BOS) – First Confirmation
Following the channel breakout, price broke through a minor structure zone around 3,345–3,350, confirming a short-term change in market direction. This zone, previously acting as resistance, is now functioning as support (noted as “Minor SR - Interchange” on the chart).
This BOS is important because it represents the first break of a lower high in the previous downtrend, which is an early sign that buyers are stepping in with strength.
🔷 3. Retest and Clean Reaction – Support Validated
After breaking structure, the market retraced back into the broken zone, validating it as new support. This is a classic market behavior where price retests previous resistance to gather liquidity before moving higher — a key concept in Smart Money Concepts (SMC).
The bullish rejection from this zone further confirms the validity of the breakout and indicates that institutional buyers may be active in this region.
🔷 4. Current Price Action – Building Momentum
Price is now hovering near 3,355, building bullish structure with a series of higher highs and higher lows. This setup aligns with a continuation move toward the next liquidity target or resistance zone, which is:
✅ Reversal Zone: 3,375–3,380
This zone is marked as the next high-probability area where price might:
Face short-term resistance
Grab liquidity above previous highs
Possibly react with a pullback
The highlighted reversal zone (target: 3,378.23) is crucial because:
It aligns with previous supply
It could act as a decision point for larger time frame traders
It’s where a Major Break of Structure might occur if price breaks and holds above it
🔷 5. Projection & Scenario Planning
Here’s how the next move could play out:
Bullish Scenario: If price maintains support above the 3,350 zone, a rally toward 3,378 is expected. A strong close above this level would shift the larger structure bullish, confirming a major trend reversal.
Bearish Scenario (Short-Term): If price fails to break 3,378, we could see a pullback into the 3,345–3,350 area again. However, as long as this support holds, the bullish bias remains intact.
🔐 Key Technical Concepts Used:
Channel Breakout
Minor BOS & SR Flip
Liquidity Sweep
Reversal Zone (Supply Area)
Trend Structure Shift
📌 Conclusion:
Gold has broken out of its bearish channel and confirmed a short-term bullish structure. The recent breakout and retest give buyers a strong foundation to push toward the 3,378 zone. This is the key reversal area, and the reaction from here will define whether Gold continues to rally or faces a temporary pullback. For now, bulls are in control, and the market structure supports a continuation move.

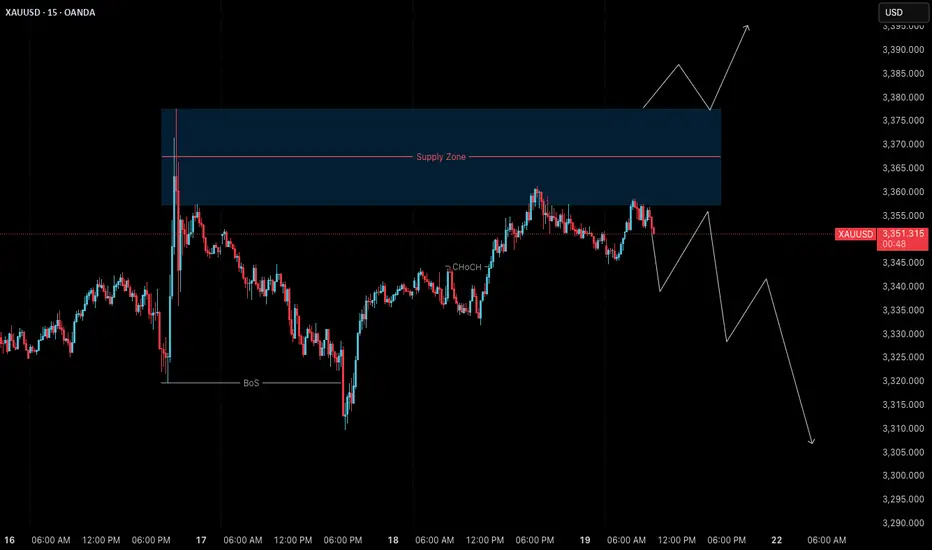
Gold (XAUUSD) – 21 July | M15 Pullback Within Bearish Structure🟠 Gold (XAUUSD) – 21 July Analysis | M15 Pullback in Bearish Trend
Gold is currently in a pullback phase within a bearish M15 trend .
The market structure is defined between the M15 lower high at 3377.650 and the previous low at 3310 .
On Friday, price retested the M15 supply zone near the lower boundary, and again today, it has reacted from the same area. This repeated rejection suggests that sellers are still defending this level.
🔍 Trend Context:
– M15: Bearish (Lower High → Lower Low structure intact)
– H4: Currently in a pullback phase
Unless the price breaks above the key 3377.650 level, the bearish structure remains valid. As such, our directional bias continues to favour shorts.
🟥 Key Supply Zone: 3358–3377.650
– Recent rejections seen from this zone
– Acts as the active short-term supply zone
– Watching for internal M15 bearish shift for possible entry
Preferred Scenario:
As price has already retested the M15 supply zone, if we now see a downside shift in internal M15 structure (e.g., ChoCH + BoS), we will look for a potential short entry aligned with the dominant M15 trend .
No confirmation, no entry. Always follow structure.
Alternate Scenario:
If the market breaks above the 3377.650 lower high, it would signal a potential bullish structure shift . In that case, we will step back from the short bias and re-evaluate long opportunities accordingly.
📌 Trade Plan:
– Wait for M15 internal structure to shift (ChoCh) bearish, followed by a Break of Structure (BoS)
– On the retest, mark the Point of Interest (POI) for potential short setup
– Only act on confirmation (e.g., M1 ChoCH + BoS)
– SL: 40 pips | TP: 120 pips | Risk-Reward: Always 1:3
Summary:
– Gold is in a pullback phase within a bearish M15 trend
– Key levels to watch: 3377.650 (lower high) and 3310 (previous low)
– Bias remains bearish unless structure flips
– Watch for internal structure shift for short opportunity
– Stay patient and aligned with the dominant trend
📘 Shared by @ChartIsMirror
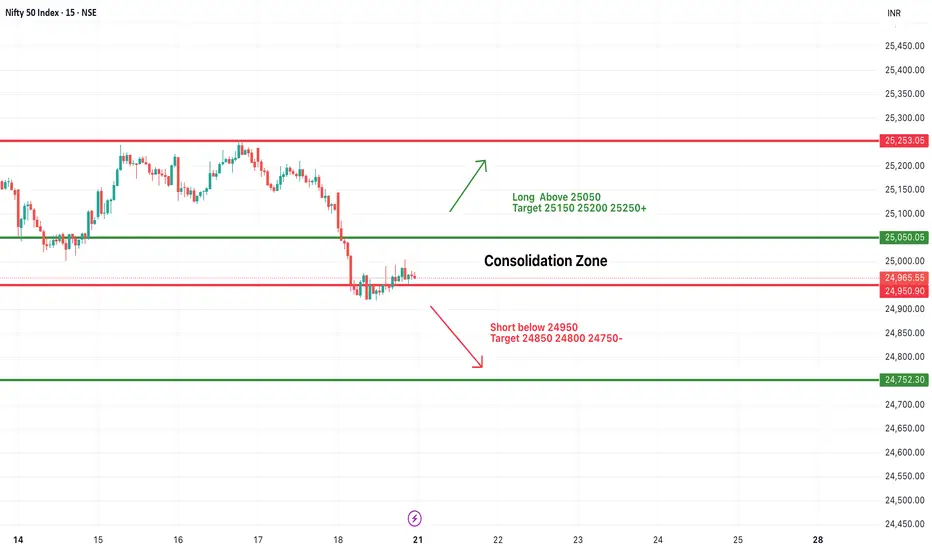
#NIFTY Intraday Support and Resistance Levels - 21/07/2025Nifty is likely to start the day with a flat opening, as current price action is indicating a consolidation phase near the lower range. The zone between 24,950–25,050 is acting as a key area of indecision, where prices are stuck in a tight range, showing a lack of clear momentum. This consolidation could lead to a breakout or breakdown depending on how the index reacts at key levels.
If Nifty sustains above 25,050, it may trigger a short-term upward move, breaking the consolidation phase. In such a scenario, an upside rally towards 25,150, 25,200, and 25,250+ levels can be expected, making it a favorable long setup for intraday traders.
On the contrary, if the index slips below 24,950, the selling pressure may increase, and downside momentum can accelerate. A breakdown here could pull the index towards support levels of 24,850, 24,800, and even 24,750-, which would confirm bearish strength.
Traders are advised to avoid aggressive positions within the consolidation zone and wait for a breakout or breakdown for directional trades. Quick entries with partial profit booking at every level and strict stop-losses are recommended to manage risk efficiently in today’s range-bound environment.
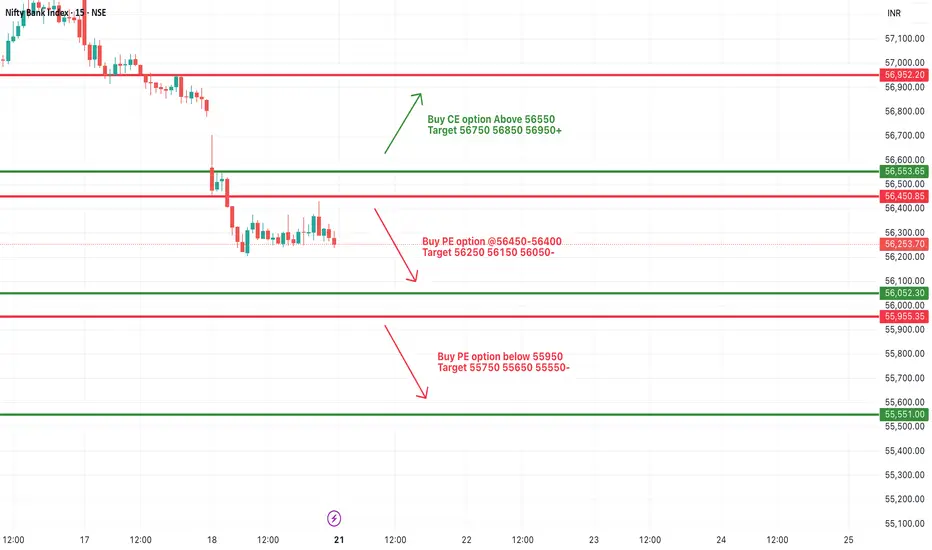
[INTRADAY] #BANKNIFTY PE & CE Levels(21/07/2025)Bank Nifty is expected to open with a gap-up, indicating early bullish sentiment. However, price action near the 56,450–56,500 zone will be crucial in deciding the day’s direction. If Bank Nifty manages to sustain above the 56,650 level after opening, it may invite fresh momentum on the upside. A move above this zone can be seen as a strength confirmation, potentially pushing the index toward targets of 56,750, 56,850, and even 56,950+ levels.
On the other hand, if the index faces resistance and shows rejection from the 56,450–56,400 supply zone, weakness can creep in. This could trigger a corrective move toward the lower levels of 56,250, 56,150, and 56,050-, making it a favorable short trade setup for the day if confirmed by price action.
Additionally, a breakdown below the 55,950 support level can lead to strong bearish pressure. If this level is breached and sustained, the index may fall sharply toward the support zones of 55,750, 55,650, and 55,550-, indicating bearish continuation.
$QQQ this might the spot. Hello and good night, evening, afternoon, or morning wherever you may be. I have been looking at names all day and I wanted to check the indexes: NASDAQ:QQQ and $SPY.
Here we have the indexes up almost 30% from the April lows and sitting about 10% YTD. The candle highlighted is the spinning stop candle and has volume to match. These candles usually take place (green or red) in downtrends or uptrends and provide pivotal indication. The market has major earnings this week (07/21/2025 to 07/25/2025) with names like Google, Tesla, General Dynamics, Verizon, Domino’s And so forth.
This week could be a catalyst to see some great volatility. I believe staying 3% from moving averages so I have noted 3.5% from the 50EMA and revisiting the 20EMA and 21EMA in the low $550 area. My target is $553 which is only a 1.4% move which can happen in one session in this environment while staying 3.5% above the 50EMA.
My trade idea will be $553p for 07/25/2025. Good luck!
WSL

Weekly $SPY / $SPX Scenarios for July 21–25, 2025🔮 Weekly AMEX:SPY / SP:SPX Scenarios for July 21–25, 2025 🔮
🌍 Market-Moving News 🌍
🏦 Fed Chair Powell Speaks — Markets Key Into Tone
Federal Reserve Chair Jay Powell’s Jackson Hole speech is the week’s centerpiece. Markets will be closely listening for clues on inflation strategy, rate-cut timing, and sensitivity to geopolitical inflation drivers like tariffs.
📦 Tariff Deadlines Gain Spotlight
Multiple tariff deadlines are set this week for targeted trade partners including the EU, Mexico, Canada, Japan, South Korea, and Thailand. Any new announcements or extensions could trigger volatility in trade-exposed sectors.
🛢️ Oil Market Mixed Signals
Brent crude prices have stabilized near mid-$70s, but OPEC+ discussions regarding supply extensions and global growth concerns continue to inject uncertainty into energy-linked equities.
📈 Big Tech Earnings Kick Off
The “Magnificent Seven” tech giants begin reporting: Nvidia leads on Tuesday, followed by Microsoft, Amazon, Alphabet, and Meta later in the week. Expect significant sentiment swings based on forward commentary.
📊 Key Data Releases & Events 📊
📅 Monday, July 21
Quiet session ahead of a packed week of speeches and data.
📅 Tuesday, July 22
8:30 AM ET – Existing Home Sales (June):
Measures signed contracts on previously owned homes—a key housing indicator.
After Market Close – Nvidia Q2 Earnings:
Market will watch guidance and China commentary.
📅 Wednesday, July 23
8:30 AM ET – Leading Economic Indicators (June):
An early gauge of U.S. economic momentum.
📅 Thursday, July 24
8:30 AM ET – Initial & Continuing Jobless Claims:
Labor-market health indicator.
📅 Friday, July 25
8:30 AM ET – Durable Goods Orders (June):
Signals demand for long-lasting goods, often driven by business spending.
8:30 AM ET – New Home Sales (June):
Follows existing home data for housing sector insight.
4:00 PM ET – Fed Chair Powell Speech at Jackson Hole:
Expect commentary on inflation, growth, and rate-path clarity.
⚠️ Disclaimer:
This content is for educational and informational purposes only and should not be construed as financial advice. Consult a licensed financial advisor before making investment decisions.
📌 #trading #stockmarket #economy #Fed #earnings #housing #durablegoods #JacksonHole #technicalanalysis

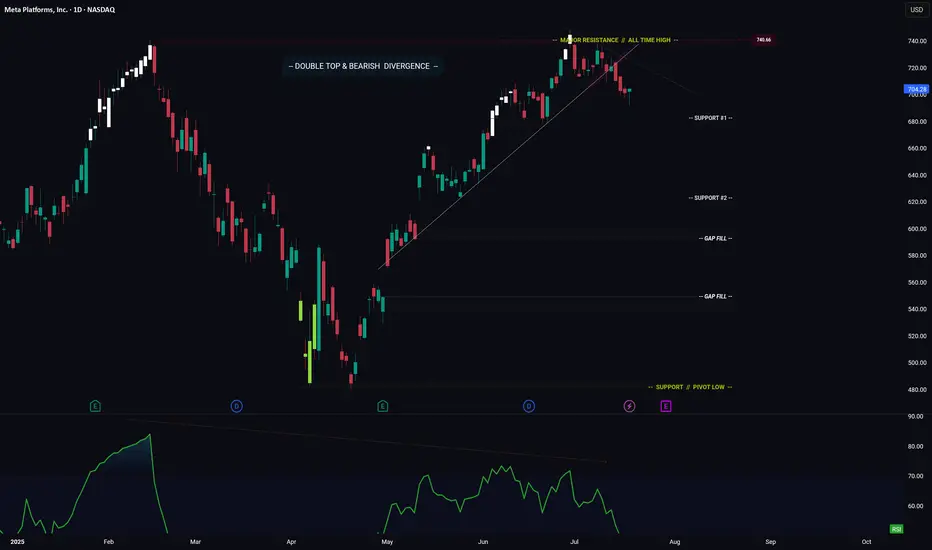
META -- Breakdown? Or Move Higher? Levels To Watch ForHello Traders!
Meta has broken down from its ascending trendline. This is bearish.
In addition price has formed a major Double Top pattern with Bearish Divergence.
Bearish Factors
1) Breakdown of ascending trendline
2) Double top
3) Bearish divergence
Two things need to happen if META is going to make a move higher...
1) Price needs to stay above "Support #1"
2) Price needs to break above the descending trendline (connecting the range highs)
IF price does breaks lower... where do we start looking for long positions?
- Support #2 is a great starting point, however if price makes it to support #2, then I could also see price trading down to fill the gap just below.
- This is where you could enter again to average down your position.
Thanks everyone and best of luck on your trading journey!
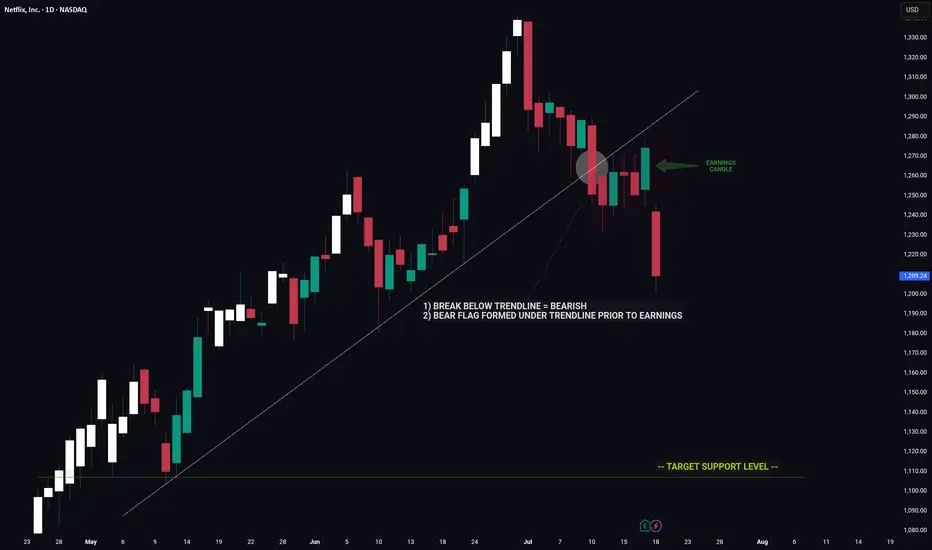
NETFLIX -- Price Signaled A Move Lower Prior To EarningsHello Traders!
The chart of NFLX is a great example of using clues to decipher a future move.
Prior to earnings we had major bearish indicators on the chart that hinted towards a move down on earnings.
1) Break below major trendline
2) Bear flag
These two signals by themselves are very bearish however the fact that these signals appeared coming into earnings was an even strong indicator of a potential for negative move.
Now that the upward trend is broken NFLX has a long way to fall before reaching the next key support level.
Thanks everyone and best of luck on your trading journey!
Adani Power (NSE:ADANIPOWER) Technical Analysis July 18th, 2025Current Price : ₹594.65 (as of July 18th, 2025, 02:00PM UTC+4)
Target Price: ₹633.67 (+6.56% upside potential)
Executive Summary
Adani Power is currently showing mixed signals across different timeframes. The stock has broken through key resistance levels but is facing overhead resistance. Multiple technical theories suggest a consolidation phase with potential for upward movement.
1. CANDLESTICK PATTERN ANALYSIS
Intraday Patterns (5M-1H)
Current Formation: Doji/Spinning top patterns indicating indecision
Key Pattern: Inside bar formations suggest consolidation
Volume Profile: Moderate volume with no significant breakout confirmation
Swing Patterns (4H-Weekly)
Primary Pattern: Rectangle/Channel formation identified
Support Zone: ₹513-520 (Strong support)
Resistance Zone: ₹588-600 (Current testing area)
2. HARMONIC PATTERN ANALYSIS
Potential Patterns
ABCD Pattern: Incomplete - monitoring for completion around ₹630-650 zone
Gartley Pattern: Potential bearish setup if rejection occurs at current levels
Fibonacci Levels:
Support: ₹450 (S1), ₹300 (S2), ₹200 (S3)
Resistance: ₹700 (R1), ₹850 (R2), ₹1,000 (R3)
3. ELLIOTT WAVE THEORY
Wave Count Analysis
Primary Wave: Currently in Wave 3 of a larger impulse structure
Sub-wave: Wave 4 correction potentially completing around ₹580-590
Target: Wave 5 projection towards ₹700-750 zone
Invalidation Level: Below ₹513 would negate current count
Time Cycles
Short-term: 5-8 day correction cycle
Medium-term: 21-34 day impulse cycle active
4. WYCKOFF THEORY ANALYSIS
Current Phase Assessment
Phase: Potential Mark-up Phase (Phase D-E transition)
Volume Analysis: Accumulation patterns visible on weekly charts
Smart Money: Institutional interest evident from volume profiles
Composite Operator: Testing supply around ₹600 levels
Key Levels
Spring Test: ₹513 level held as key support
Supply Line: ₹588-600 acting as resistance
Upthrust Potential: Break above ₹605 could trigger mark-up
5. W.D. GANN THEORY ANALYSIS
Square of Nine Analysis
Current Position: 594° on the wheel
Next Resistance: 625° (₹625) - significant Gann angle
Support Level: 576° (₹576) - 45-degree angle support
Cardinal Points: 600° represents a critical decision point
Time Theory
Natural Time Cycles: 90-day cycle completion expected by August 2025
Anniversary Dates: Historical significant dates align with current timeframe
Time Windows: July 25-30, 2025 represents important time cluster
Angle Theory
1x1 Angle: Currently trading above the 1x1 rising angle from ₹513 low
2x1 Angle: Resistance at ₹630 level (steep angle)
Price/Time Squares: Next square at ₹625 (25²)
Forecasting
Price Target: ₹625-650 based on geometric progressions
Time Target: 15-20 trading days for next significant move
Harmony Level: ₹594 is in harmony with previous swing levels
6. ICHIMOKU KINKO HYO ANALYSIS
Cloud (Kumo) Analysis
Current Position: Price trading above the cloud (bullish)
Cloud Thickness: Thin cloud ahead suggests easier breakout potential
Cloud Color: Green cloud in coming periods (bullish bias)
Line Analysis
Tenkan-sen (9): ₹587 - price above (bullish)
Kijun-sen (26): ₹571 - price above (strong bullish)
Chikou Span: Clear of price action (no interference)
Senkou Span A: ₹579 (support)
Senkou Span B: ₹562 (key support)
7. TECHNICAL INDICATORS
RSI Analysis
Current RSI: 58-62 range (neutral to slightly bullish)
Divergence: No major divergences detected
Overbought/Oversold: Not in extreme zones
Bollinger Bands
Position: Price in upper half of bands
Squeeze: Bands expanding, indicating increased volatility
Signal: Potential for continued upward movement
VWAP Analysis
Daily VWAP: ₹591 (price above - bullish)
Weekly VWAP: ₹584 (strong support)
Volume Profile: Heavy volume around ₹570-580 zone
Moving Averages
SMA 20: ₹583 (bullish crossover)
EMA 20: ₹586 (price above)
SMA 50: ₹567 (strong support)
EMA 50: ₹569 (upward sloping)
SMA 200: ₹524 (long-term bull market)
8. MULTI-TIMEFRAME ANALYSIS
Intraday Timeframes
5-Minute Chart
Trend: Sideways with bullish bias
Key Level: ₹592-596 range bound
Signal: Wait for breakout above ₹600
15-Minute Chart
Trend: Consolidating triangle pattern
Volume: Decreasing (typical in consolidation)
Target: ₹605-610 on upside breakout
30-Minute Chart
Trend: Higher highs and higher lows intact
Support: ₹590-592
Resistance: ₹598-602
1-Hour Chart
Trend: Bullish flag pattern forming
Breakout Level: Above ₹602
Target: ₹625-630
4-Hour Chart
Trend: Strong uptrend since ₹513 low
Pattern: Bull flag consolidation
Key Level: ₹588 as crucial support
Swing Timeframes
Daily Chart
Trend: Primary uptrend intact
Pattern: Rectangle between ₹513-588 broken upside
Target: Next resistance at ₹700 zone
Weekly Chart
Trend: Long-term bullish structure
Support: ₹450-500 major support zone
Resistance: ₹700-750 target area
Monthly Chart
Trend: Recovery from major lows
Long-term View: Potential for ₹850+ targets
Time Horizon: 6-12 months for major targets
9. FORECAST & OUTLOOK
Intraday Forecast (Next 1-5 Days)
Bias: Neutral to Bullish
Range: ₹585-610
Breakout Level: Above ₹605 for ₹625 target
Stop Loss: Below ₹582
Swing Forecast (Next 2-8 Weeks)
Primary Target: ₹633-650
Secondary Target: ₹700-720
Support Zone: ₹570-580
Risk Level: Medium (volatility expected)
Key Risk Factors
Overall market sentiment and Adani group developments
Earnings disappointment (recent -23.91% surprise noted)
Broader power sector dynamics
Regulatory changes in power sector
Trading Strategy Recommendations
For Intraday Traders
Buy: Above ₹602 with ₹610-615 target
Sell: Below ₹590 with ₹582-585 target
Risk Management: 1-2% position sizing
For Swing Traders
Accumulate: ₹580-590 zone
Target: ₹633-650 (first target)
Stop Loss: Below ₹570 (daily close basis)
Time Horizon: 4-8 weeks
Confluence Factors Supporting Bullish View
Multiple theories align for ₹625-650 targets
Strong volume accumulation patterns
Technical breakout from rectangle formation
Ichimoku cloud support
Gann squares and angles alignment
Warning Signals to Watch
Daily close below ₹580
RSI divergence formation
Volume decrease on any upward moves
Broader market weakness
Disclaimer: This analysis is for educational purposes only. Always consult with financial advisors and conduct your own research before making investment decisions. Past performance does not guarantee future results.

XAUUSD Outlook: Bullish Bias Hi Traders
I am a profitable full time trader with 7 Years experience and I would like to share my journey including profits analysis and signal indicators.
Attached is the XAUUSD chart showing current areas of interest above and below current price which can used to trade profitably.
I still have a bullish bias, but will wait patiently for a retracement into one of the support levels. I will assess price action at lower levels before looking for buy trades.
Key support levels
3,335–3,338
3,320–3,324
Key resistance levels
3,352–3,355
3,367–3,371
Price respected last week’s high (3,377) and is pulling back. The moving averages are also proving a confluence to support our bullish outlook.
Also, please take into account news releases throughout the week before placing any trades to avoid market volatility.
We will share updates throughout the week.
Please let me know your bias for gold this week in the comments.
If you found this helpful, please drop a like to support my work.
Thanks,
PrestigeGoldFX

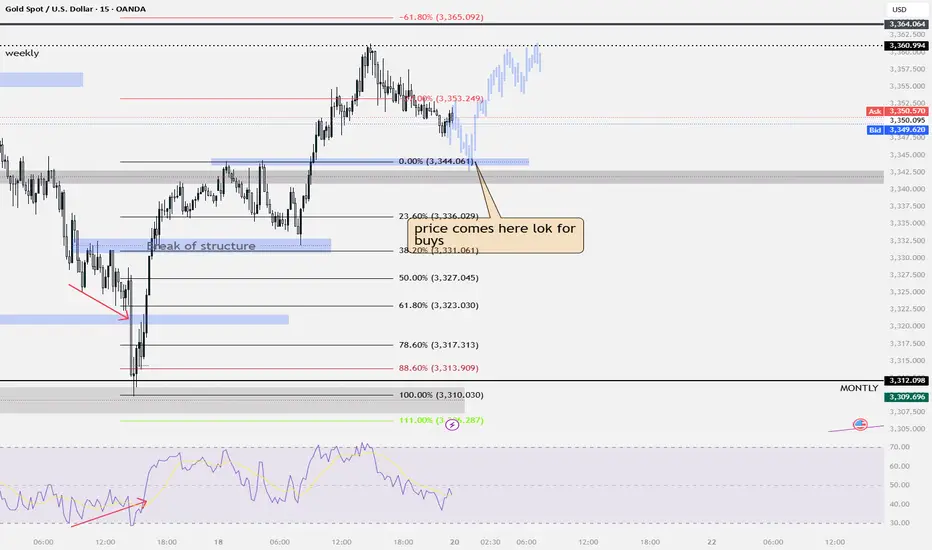
gold buysim looking for buys this week on gold price has been consolidating for the past few weeks. on friday price broke structure on the m15 structure went higher and created new highs... im im looking for a retest of the higher high
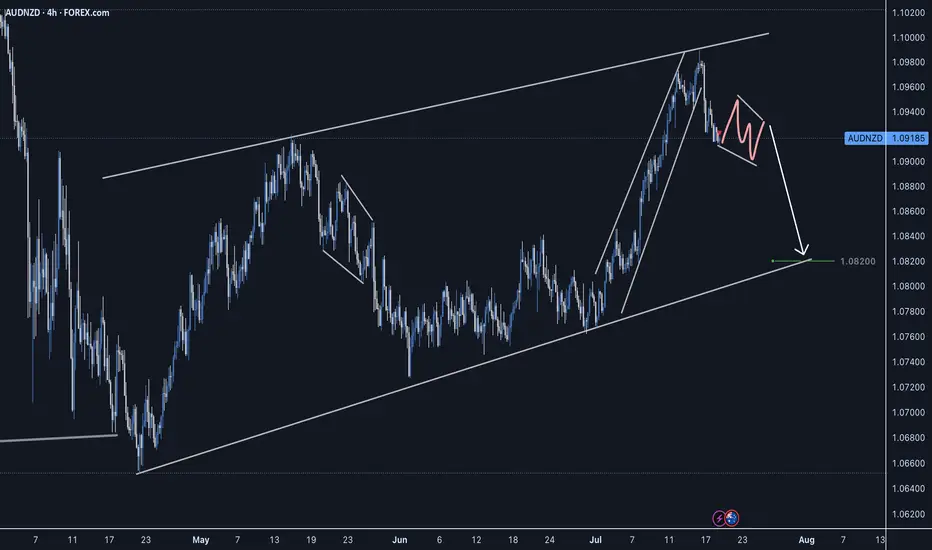
AUDNZD Short Setup - CAB EntrySellers stepping in, strong reversal impulse. Waiting for a slight correction before taking a short entry on the LTF.
Good Luck
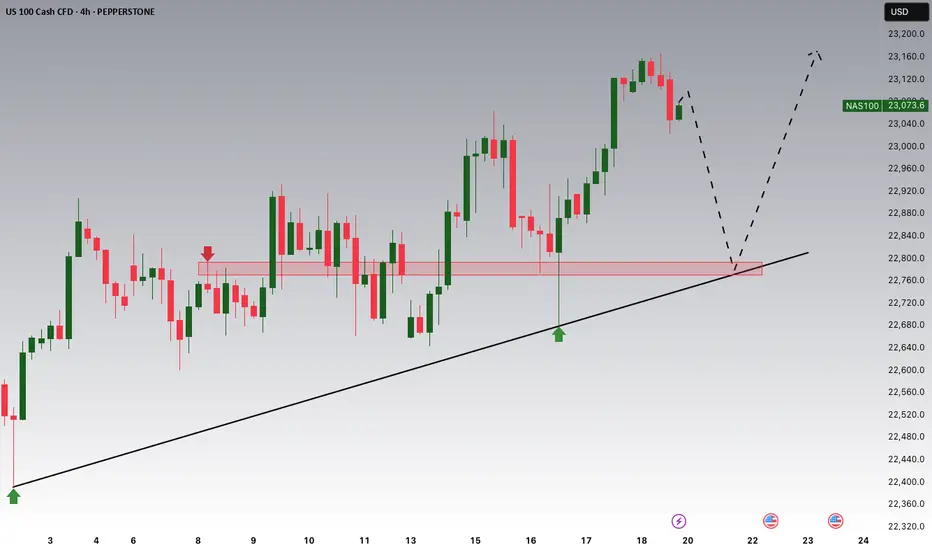
NASDAQ Potential UpsidesHey Traders, in tomorrow's trading session we are monitoring NAS100 for a buying opportunity around 22,780 zone, NASDAQ is trading in an uptrend and currently is in a correction phase in which it is approaching the trend at 22,780 support and resistance area.
Trade safe, Joe.
PEP: PepsiCo Earnings resultsIts looks like PEP is a buy now. Just want to double check on future sales growth as it is stable for a while. Lower stock price made the dividend very attractive since PEP is a defensive stock.
Disclaimer: This content is NOT a financial advise, it is for educational purpose only.

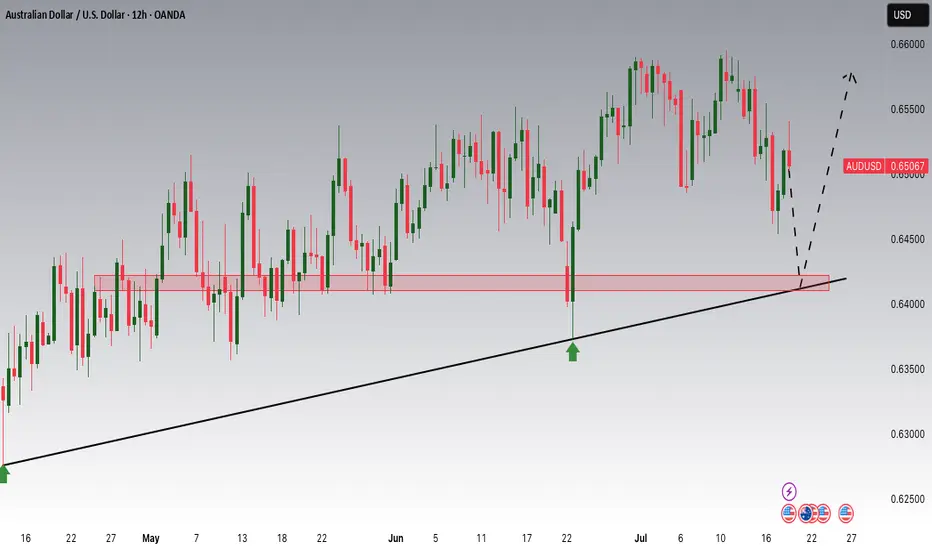
AUDUSD Potential UpsidesHey Traders, in tomorrow's trading session we are monitoring AUDUSD for a buying opportunity around 0.64200 zone, AUDUSD is trading in an uptrend and currently is in a correction phase in which it is approaching the trend at 0.64200 support and resistance area.
Trade safe, Joe.
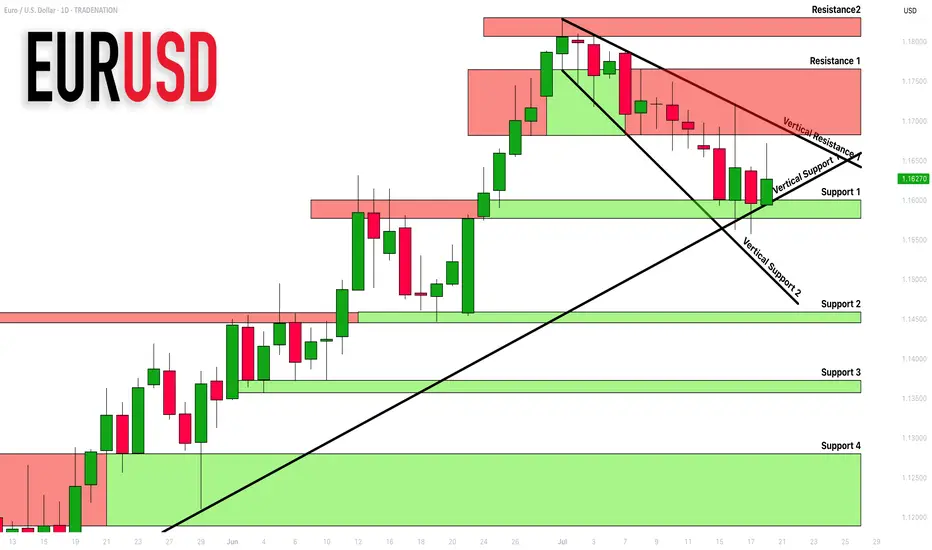
EURUSD: Support & Resistance Analysis For Next Week 🇪🇺🇺🇸
Here is my latest structure analysis and important supports/resistances
for EURUSD for next week.
Consider these structures for pullback/breakout trading.
❤️Please, support my work with like, thank you!❤️
I am part of Trade Nation's Influencer program and receive a monthly fee for using their TradingView charts in my analysis.
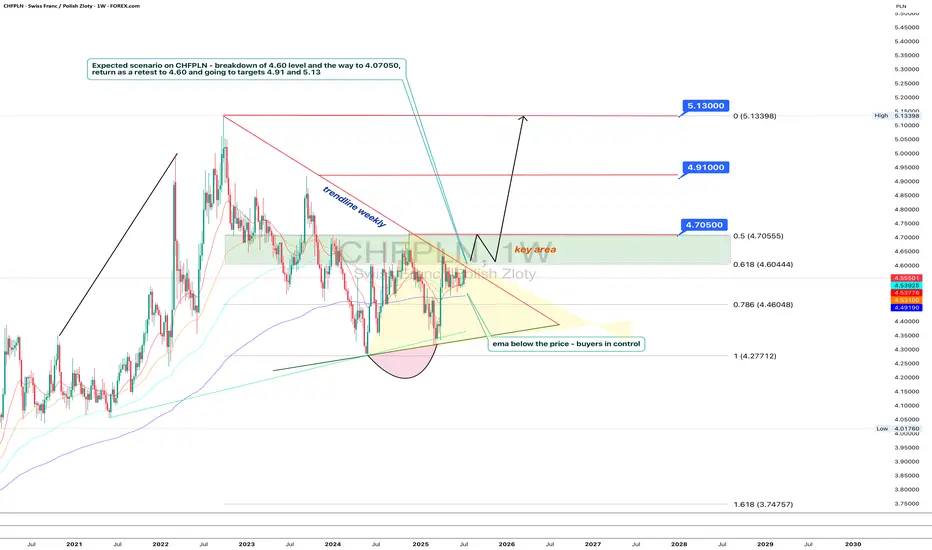
Polish zloty in trouble: Swiss franc is sharpening its teethTechnically, CHFPLN has completed a consolidation phase within a narrowing triangle and broke to the upside. The pair is now testing the 4.60 level (the 0.618 Fibonacci retracement) from below — a decisive zone. A breakout and confirmation above this area opens the path toward 4.705, which coincides with the 0.5 Fibo level and a local resistance. A pullback from that zone back to 4.60 is possible, but this time as a support retest. If the level holds, the targets remain: 4.91 and 5.13 - both marked by Fibonacci extensions and major long-term horizontal resistance. The EMAs are aligned in support of further upside, with price consistently trading above them.
Fundamentally, the Swiss franc remains a safe-haven currency, especially amidst increasing instability in the Eurozone. Weak growth in Germany, looming ECB policy easing, and rising inflationary pressures are all tilting investor interest toward CHF. Meanwhile, Poland faces political uncertainty, budgetary debates, and volatility in the agricultural and energy sectors. All of this strengthens the case for the franc in this pair.
Tactically, the game plan is straightforward: a confirmed breakout above 4.60 signals the start of a bullish impulse. The 4.60–4.705 zone is the key area of interest for buyers. If this zone is reclaimed and held, the next targets - 4.91 and 5.13 - remain valid, where large players may look to take profits.
If this scenario plays out, the zloty may soon be tuning into Polish radio to sing nostalgic songs about the golden days of its strength.
XAUUSDgold has played over a week and finally took a long as we know it will fly on wednesday but trap with seller.. i am looking for continue long on gold, as i have drw simple line reason is clear w pattern,, and the (bos) .. lets see is it flying without fvg, or lit a bit to fill the fuel..what are your thought let me know in the comment.
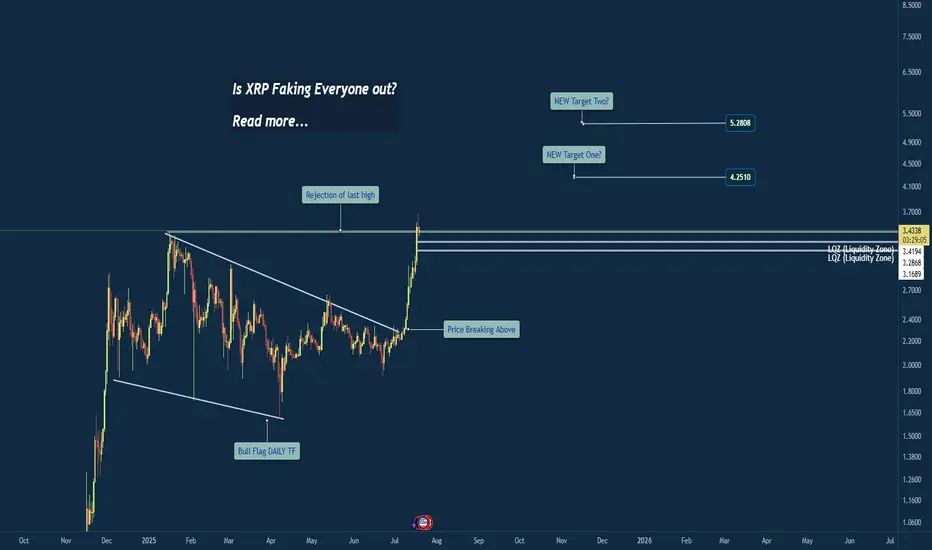
Breakout or Bull Trap? XRP at Critical Weekly LevelWeekly Chart Insight: XRP Closing Above Previous High
XRP has just closed above its previous weekly high—a significant development that could signal a shift in market sentiment. Historically, when price closes above such a critical level on the weekly timeframe, it often leads to continuation, unless a sharp rejection quickly follows.
At this stage, the focus shifts to the 4-hour timeframe for confirmation. An impulsive move above the current consolidation zone could indicate that this breakout is legitimate, potentially leading to another bullish weekly candle.
However, caution is warranted. If the next two daily candles close weakly or fail to maintain structure above the breakout level, it could hint at a fakeout or liquidity grab before a deeper correction.
My Current Bias:
I remain neutral-to-bullish, contingent on:
An impulsive continuation on the 4HR
Strong daily closes above the key range
Price not falling back and closing below the weekly breakout level
If price begins to consolidate and hold this level, that would reinforce the bullish case. But if we see immediate selling pressure and a re-entrance below the breakout, I’ll reconsider the bias based on developing structure.
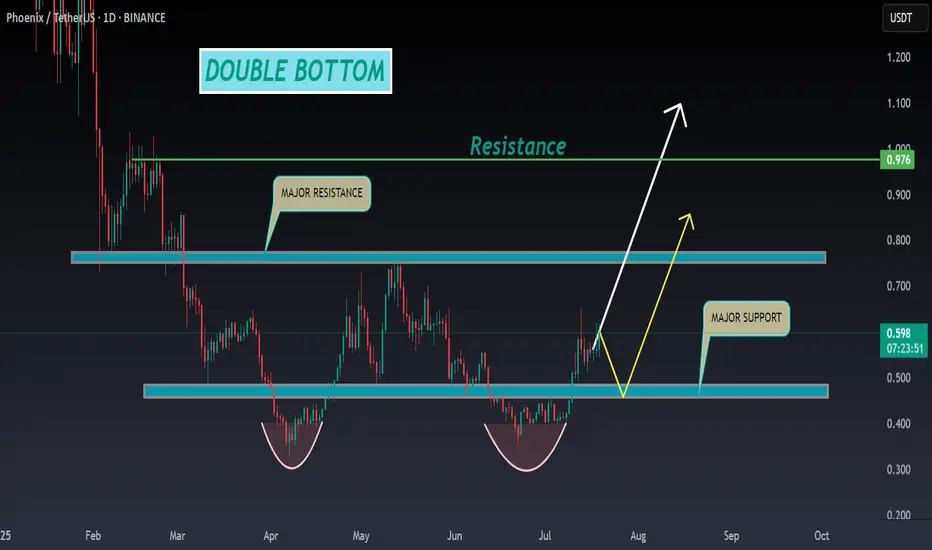
PHB ANALYSIS🔮#PHB Analysis :
📈📈 #PHB is making perfect Double Bottom Pattern. We can see a good pump if #PHB breakout the major resistance zone with good volume and sustains the higher price after breakout 🚀🚀
📊 Current Price: $0.595
⏳ Target Price: $0.780
⁉️ What to do?
- We can trade according to the chart and make some profits in #PHB. Keep your eyes on the chart, observe trading volume and stay accustom to market moves.💲💲
#PHB #Cryptocurrency #Pump #DYOR #Breakout