Yen Rebounds as Japan Inflation Stays ElevatedThe yen rose to around 148 per dollar on Friday, recovering from the previous day’s decline as markets assessed fresh inflation figures. Japan’s inflation eased slightly to 3.3% in June from 3.5% in May but remained above the Bank of Japan’s 2% target for the 39th straight month. This persistent overshoot has intensified speculation about possible policy tightening by the central bank.
Resistance is at 149.30, with major support at 147.50.
Technical Analysis
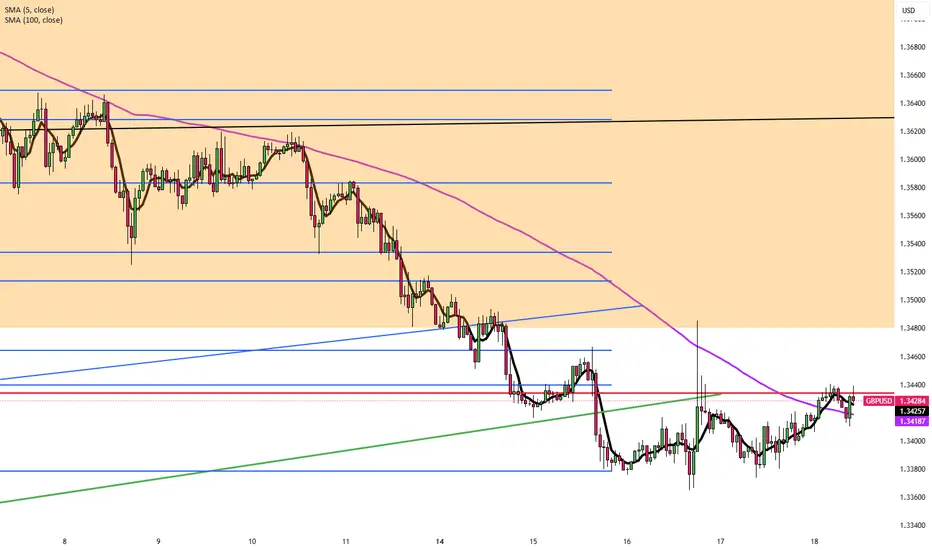
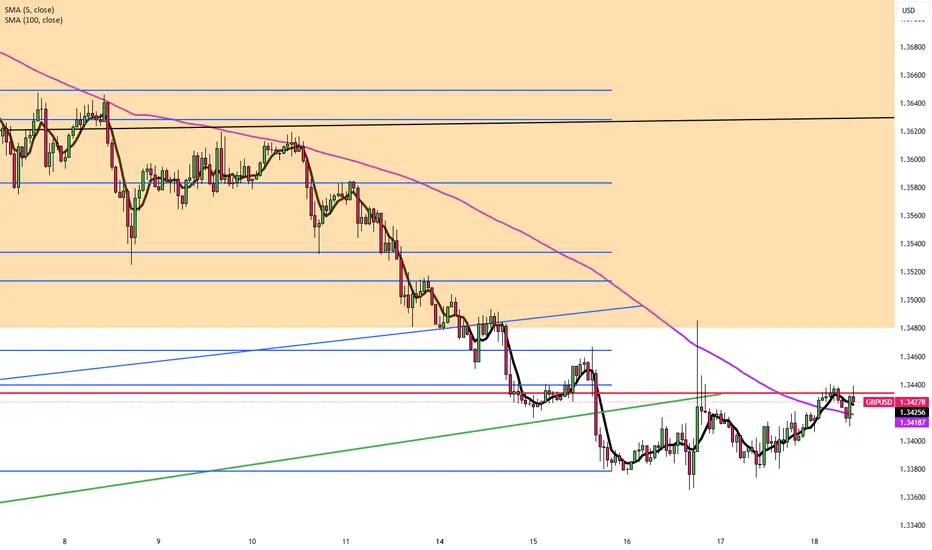
Pound Pressured by Firm Dollar and UK Data ReviewThe British pound held near $1.339 on Friday, its lowest level in eight weeks, as the U.S. dollar strengthened. The dollar reached a three-week high after President Trump confirmed he would not remove Fed Chair Jerome Powell, despite continued criticism of the Fed’s careful stance on rate cuts. In the UK, markets are closely reviewing recent employment and inflation data. While the labor market shows signs of weakness, updated tax records suggest the slowdown may not be as severe as previously thought.
Resistance is at 1.3535, while support holds at 1.3380.
Today's GOLD Analysis (MMC) – Bullish Momentum Building Ahead🔍 Market Overview:
Gold is currently showing signs of a bullish reversal structure after experiencing a downward correction. Price action has reacted strongly from well-defined demand zones, suggesting institutional buying activity at key levels. The current setup highlights a clear accumulation phase transitioning into a potential markup phase, driven by buyers regaining control.
🧱 Chart Structure Breakdown:
1️⃣ Initial Channel Formation (Left Side of Chart)
After a major downtrend, price began consolidating within a rising channel, indicating a retracement or correction phase.
This ascending channel showed a short-term bullish effort, but eventually broke to the downside, resuming the dominant bearish flow temporarily.
2️⃣ Previous Reversal Zone ($3,312 – $3,322)
This is the origin of the recent bullish move, where price strongly reversed after heavy selling.
The reversal formed a long bullish wick and an engulfing candle—clear signs of buying absorption.
This level has historical confluence, acting as both support and prior demand.
3️⃣ Mini SR - Interchange Zone ($3,327 – $3,335)
This zone is a mini structure level where previous resistance has now become support (SR Flip).
The area acted as a platform for the recent bullish reaction.
This zone also aligns with the interchange of order blocks, adding more confluence to the bullish argument.
4️⃣ Bullish Pattern Formation
Price formed a micro double bottom/inverse head and shoulders structure just above the Mini SR.
The pattern suggests strong base-building and provides momentum for the current bullish move.
Confirmation came after the neckline breakout and retest within the Central Zone.
5️⃣ Central Zone ($3,340 – $3,345)
This is an intraday pivot area, acting as a decision-making zone between buyers and sellers.
Price is currently testing this zone with strong bullish candles.
A clean break above this level increases the probability of further upside.
6️⃣ Reversal Zone 1 ($3,345 – $3,353) – ✅ Condition 1
Price is now entering this zone, where previous price rejections occurred.
If buyers can maintain momentum and break above this zone on strong volume, it will validate the bullish continuation thesis.
This zone is also an ideal area to monitor for partial profit-taking or potential short-term rejection.
7️⃣ Reversal Zone 2 ($3,365 – $3,375) – ✅ Condition 2
This is the next significant resistance block.
If price reaches this level, it could face heavy resistance and profit-booking from swing traders.
However, a breakout above this zone could lead to a much larger bullish wave, targeting $3,390+.
🎯 Trade Setup Idea:
Long Bias: Above $3,335 with targets at $3,353 (TP1) and $3,370 (TP2)
Risk Invalidation: Break below Mini SR zone ($3,327) may invalidate bullish thesis
Aggressive Entry: At retest of Mini SR after pattern breakout
Conservative Entry: On breakout and close above Reversal Zone 1 with confirmation
🧠 Trader’s Mindset:
The market is showing a clear shift in momentum, but buyers must sustain control above key levels.
Stay patient at resistance zones; avoid chasing.
Watch for rejection wicks or bearish divergence near Reversal Zone 2 if you're looking for a counter-trade.
📌 Summary:
📈 Bias: Bullish (as long as $3,335 holds)
💡 Opportunity: Breakout from Mini SR with structure support
📉 Risk: Failure to hold central zone could trigger retest of lower support
🚀 Potential: If momentum continues, gold could revisit July highs near $3,390–$3,400

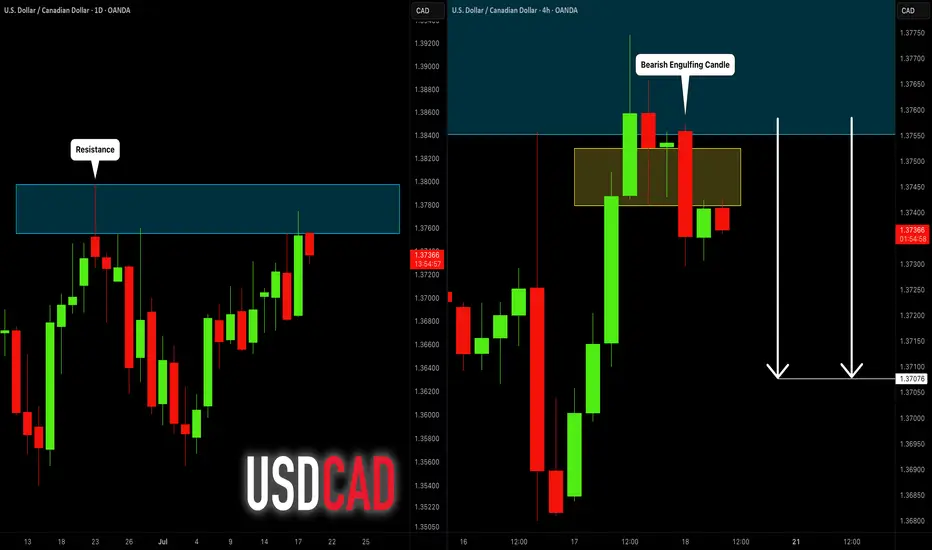
USDCAD: Bearish Move From Resistance 🇺🇸🇨🇦
USDCAD is going to retrace from a key daily resistance.
A bearish imbalance candle that the price formed after its test
during the Asian session provides a strong intraday bearish confirmation.
Goal - 1.3707
❤️Please, support my work with like, thank you!❤️
I am part of Trade Nation's Influencer program and receive a monthly fee for using their TradingView charts in my analysis.
Technical **chart analysis** for ETH/USDTechnical **chart analysis** for **ETH/USD** based on (15-min timeframe) :
Bullish Outlook**
* **Price Action**: Ethereum is consolidating just above previous resistance (\~\$3,440) after a breakout from the range.
* **Current Price**: \~\$3,446
* **EMA Support**:
* EMA 7: \$3,441 (price holding above)
* EMA 21: \$3,413
* EMA 50: \$3,376 (strong dynamic support)
Key Levels**
* **Resistance Broken**: Former resistance zone (\~\$3,415–\$3,440) now acting as support.
* **S1 Support Zone**: \$3,415–\$3,440 (ideal retest zone for long entries)
* **S2 Support Zone**: \$3,335–\$3,350 (next demand zone if S1 fails)
Analysis Summary**
* **Trend**: Bullish momentum is intact above EMA cluster.
* **Setup**: Retest of breakout zone successful → price stabilizing above EMA7.
* **Target Area**: If momentum continues, next target zone could be \$3,500–\$3,560 (as shown by green arrow).
* **Invalidation**: Drop below \$3,413 (EMA21) and especially \$3,376 (EMA50) would weaken the bullish structure.

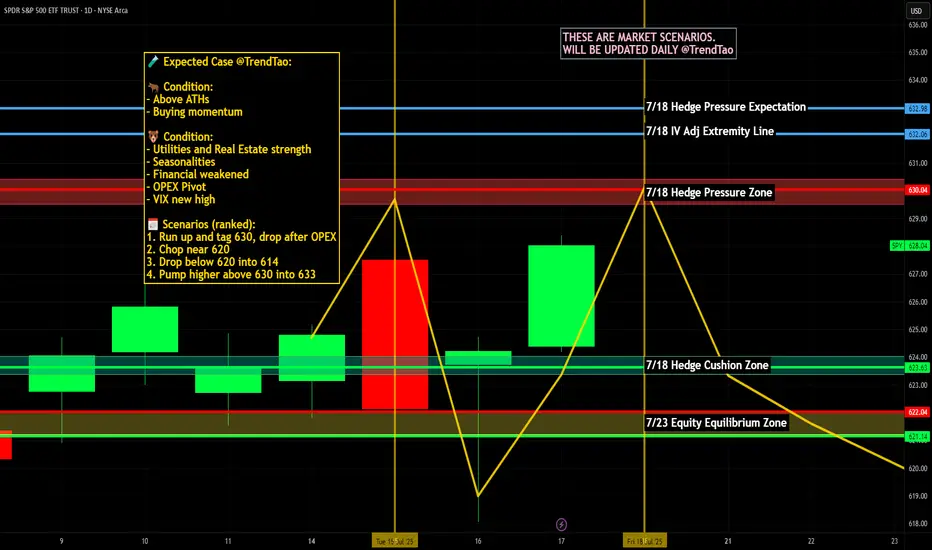
Nightly $SPY / $SPX Scenarios for July 19, 2025🔮 Nightly AMEX:SPY / SP:SPX Scenarios for July 19, 2025 🔮
🌍 Market-Moving News 🌍
🏢 U.S. Corp Buybacks Set to Propel Stocks
Citadel Securities expects U.S. companies to repurchase roughly $1 trillion of stock in 2025. With the blackout period ending in August, buybacks—historically strong in July, the stock market’s best month—could bolster valuations
⚖️ Fed Independence Debate Intensifies
President Trump’s continued criticism of Chair Powell has already weakened confidence in Federal Reserve autonomy. The fallout shows up in a weaker dollar, elevated Treasury yields, and rising inflation expectations—though stocks have remained resilient
🇺🇸 Immigration Rollback Sparks Economic Concern
The rescinding of Temporary Protected Status for ~900,000 immigrants could remove up to 1.1 million workers from the labor force. Analysts warn of potential stagflation risks, with GDP growth potentially down 0.3–0.4 percentage points and labor-market tightening ahead
💵 Massive T-Bill Issuance Incoming
Following the debt-ceiling deal, the Treasury plans over $1 trillion in T-bill issuance in the next 18 months. Money-market funds are expected to absorb much of it, influencing short-term rates and cash-market dynamics
📊 Key Data Releases & Events 📊
📅 Friday, July 19:
8:30 AM ET – Initial Jobless Claims
Weekly figure on new unemployment filings—a real-time indicator of labor-market resilience.
8:30 AM ET – Existing Home Sales (June)
Measures signed contracts on previously owned homes; key for gauging housing-market health.
All Day Events:
Ongoing corporate buybacks entering open window
Treasury auctions and T-bill issuance updates
⚠️ Disclaimer:
This information is for educational and informational purposes only and should not be construed as financial advice. Always consult a licensed financial advisor before making investment decisions.
📌 #trading #stockmarket #economy #monetarypolicy #debt #housing #labor #technicalanalysis
Sterling Rebounds But Faces Heavy Resistance Ahead GBP/USD Outlook – Sterling Rebounds But Faces Heavy Resistance Ahead
🌐 Macro Insight – UK Labour Data Mixed, Trump Headlines Stir Market
The British Pound (GBP) regained some lost ground against the U.S. Dollar after the UK labour market data revealed mixed signals:
Wage growth cooled as expected, suggesting a potential easing in inflationary pressures.
UK ILO Unemployment ticked up to 4.7%, raising concerns about labour market fragility.
Meanwhile, in the U.S., President Trump denied reports about firing Fed Chair Powell, briefly easing tensions and stabilizing USD demand.
With both currencies facing mixed narratives, GBP/USD is set for a pivotal move, and traders should stay alert to key liquidity zones and order blocks.
🔍 Technical Setup – MMF + Smart Money Framework
On the H2 chart, GBP/USD has reacted from the OBS BUY ZONE at 1.3376, bouncing with a bullish structure and forming a potential continuation pattern. Price is now expected to target key zones above, where significant order blocks and Fibonacci confluence reside.
⚙️ Key Resistance Zones:
1.3578 – 0.5 Fibonacci Retracement + OBS
1.3627 – 0.618 Fibonacci + Supply Zone
1.3697 – CP Continuation Pattern + H2 Order Block
These areas represent institutional interest for potential sell setups.
✅ Trade Plan for GBP/USD
🟢 BUY ZONE: 1.3376 – 1.3398
SL: 1.3360
TP: 1.3450 → 1.3485 → 1.3530 → 1.3578 → 1.3627
Look for bullish structure confirmation before entering. Target the next liquidity highs and imbalance zones.
🔴 SELL ZONE: 1.3627 – 1.3697
SL: 1.3735
TP: 1.3580 → 1.3530 → 1.3480
Watch for rejection and bearish divergence at supply areas to time potential swing shorts.
🧠 Strategy Notes
This setup combines MMF zones with institutional volume and price action concepts. The pair is currently reacting to a deep discount zone and may climb toward premium levels where selling pressure awaits. Be cautious during New York session volatility, especially with potential U.S. policy headlines and upcoming global inflation data.
🗨 What’s Next?
Are bulls ready to reclaim control or will resistance zones cap this recovery? Drop your ideas below and don’t forget to follow for more institutional-grade insights powered by MMF methodology.

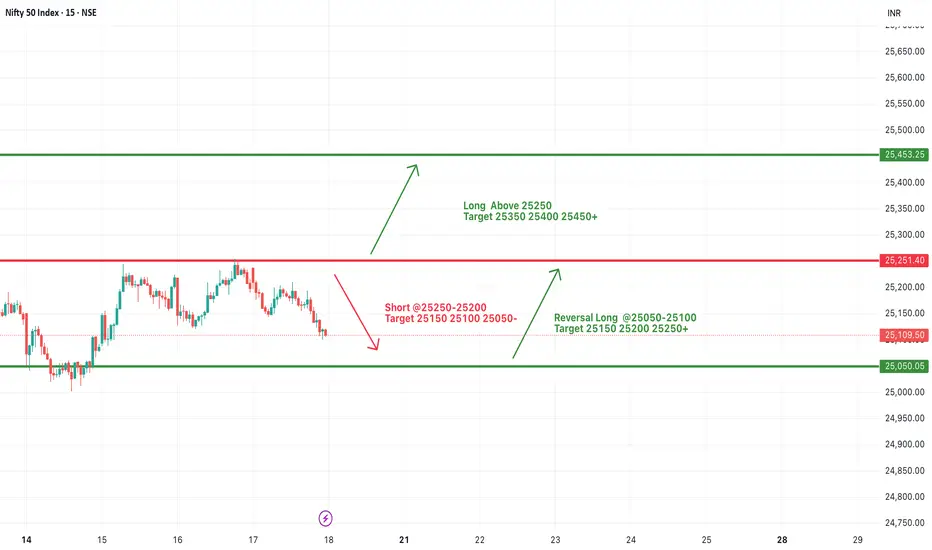
#NIFTY Intraday Support and Resistance Levels - 18/07/2025Nifty is likely to open slightly gap-up today near the 25100–25150 zone. There are no major changes from yesterday’s levels, so the same trading levels remain in focus for today’s session. If Nifty sustains above the 25250 level, we can expect an upside move toward 25350, 25400, and even 25450+ levels. This area remains a crucial resistance zone for potential bullish continuation.
On the downside, if Nifty fails to cross and sustain above 25250 and breaks below the 25200–25250 zone, we may witness a downward move with possible targets at 25150, 25100, and 25050.
A reversal long opportunity may arise in the 25050–25100 support zone if the market finds buying interest after a dip. From this level, we can expect targets around 25150, 25200, and 25250+.
The index is trading in a tight range with no fresh cues. Avoid aggressive entries and stick to level-based trades with strict stop-loss and partial profit booking.
[INTRADAY] #BANKNIFTY PE & CE Levels(18/07/2025)Bank Nifty is expected to open flat around the 56800 zone, suggesting indecision in the early session. If it manages to move upward and sustain above the 57050–57100 resistance range, it could invite bullish momentum targeting 57250, 57350, and even 57450+. A breakout above this level can trigger a continuation of upward movement, but volume and price confirmation are essential.
On the downside, if the index stays weak and slips below the 56950–56900 zone, we may see fresh bearish pressure pulling it toward 56750, 56650, and 56550 support levels. This zone remains a crucial intraday pivot for traders to watch.
A reversal opportunity may also emerge if the index drops further near 56550–56600 and then shows a sharp recovery. In such a case, targets of 56750, 56850, and 56950+ are possible, making it a good support-based bounce trade. Overall, the market might remain sideways with both opportunities for quick scalps and reversals—focus on key levels and act with strict stop losses.

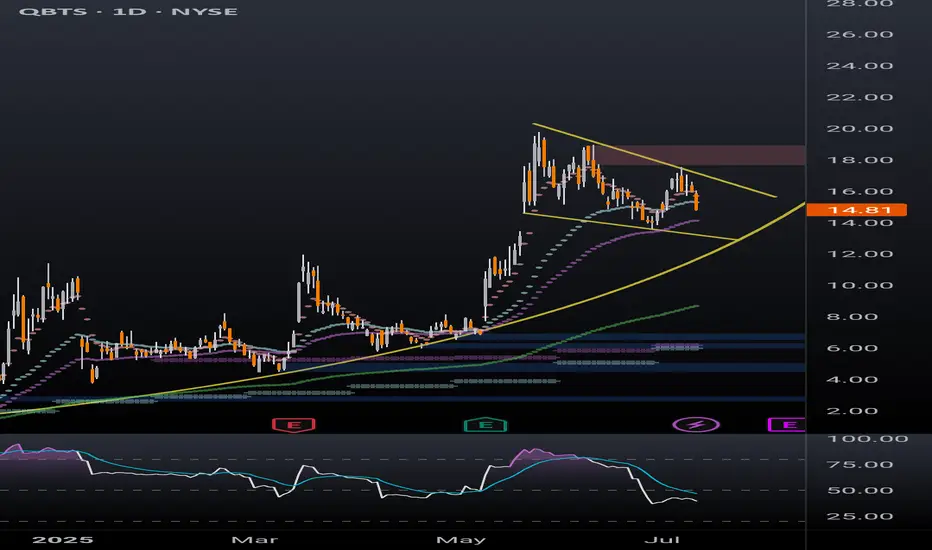
QBTS bull flag dailyBetter look at quantum computing ticker QBTS bull flag on the daily timeframe. Previous post looked at the weekly timeframe to highlight the bullish momentum. Lots of retail money piled into this one in the last few months, a breakout of this bull flag will likely be followed by a parabolic move.
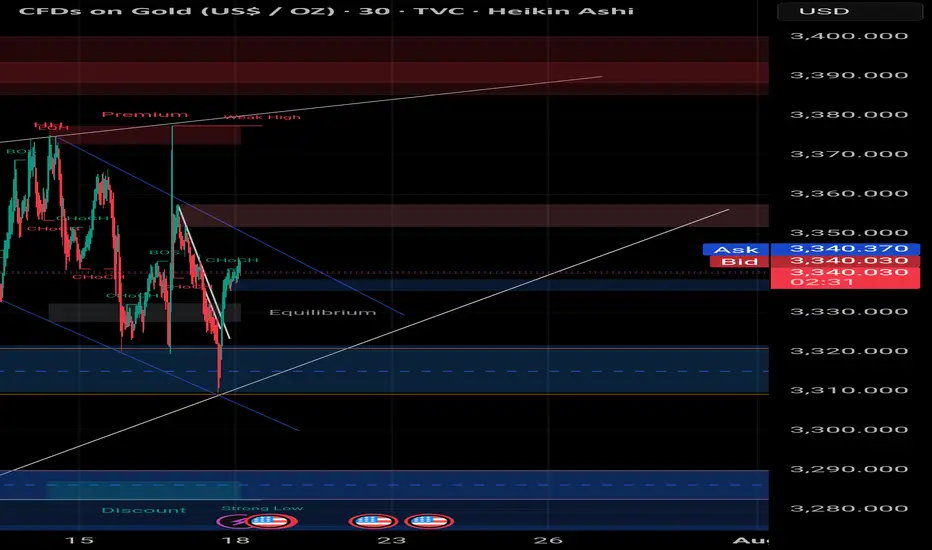
Smart Money Sell Setup on Gold (15-Min TF)# Smart Money Sell Setup on Gold (15-Min TF)
### 🔍 Market Context:
Gold has recently formed a strong bullish retracement after a sharp impulsive bearish move. Now, price has returned to a critical zone — the **Equilibrium level (EQ)** — which also aligns with a **valid supply zone** and **bearish trendline resistance**.
This zone is often considered the "decision point" where Smart Money evaluates whether to continue upward or resume the previous bearish trend.
---
## 📉 Strategy: Sell Limit Based on Structure + Liquidity
### ✅ Entry Zone:
**3341.500 – 3343.000**
(At the EQ zone + premium pricing area)
### 🛑 Stop Loss:
**Above 3345.000**
(Just beyond the last liquidity wick and top of supply)
### 🎯 Take Profit Targets:
- **TP1:** 3338.000 → First demand zone
- **TP2:** 3332.500 → Liquidity sweep target under previous lows
### 📐 Risk to Reward Ratio:
**1:3 or higher**, depending on execution precision.
---
## 🔎 Confluences Supporting the Setup:
| Factor | Confirmation |
|--------|--------------|
| EQ Zone (50% of previous move) | ✅ |
| Supply Zone | ✅ |
| Bearish Trendline Resistance | ✅ |
| Liquidity above EQ | ✅ |
| CHoCH + BOS (Market Structure Shift) | ✅ |
---
## 🧠 Why This Setup Works:
This is a classic **"Premium Price Rejection"** in a bearish environment, combining:
- Institutional logic (EQ level)
- Structural resistance (previous BOS)
- Liquidity traps above
---
## 🧵 Summary:
- **Sell Limit:** 3341.5 – 3343
- **SL:** 3345
- **TP1:** 3338
- **TP2:** 3332.5
- **RR:** 1:3+
- **Style:** Smart Money / Liquidity + Structure Based
---
🔔 **Disclaimer:** This is not financial advice. Always do your own analysis and manage risk accordingly.
#gold #XAUUSD #smartmoney #tradingview #liquidity #supplydemand #priceaction #forex #structure
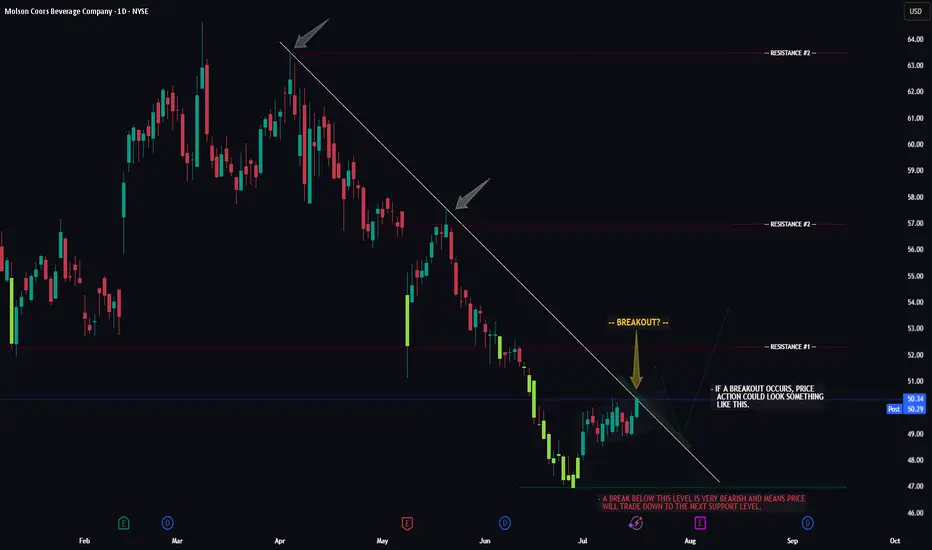
TAP -- Breakout Attempt -- Target LevelsHello Traders!
The chart of TAP (Molson Beer co.) is currently flirting with a major resistance trendline. Now whether or not price can successfully seal the deal and make it too third base remains to be seen.
If price does breakout, watch for a potential retrace to the breakout trendline first, then we could see the larger move to resistance level #1.
If price gets rejected and fails to breakout we could see a move below support before it attempts to breakout again.
Thanks everyone and best of luck with your trading journey!
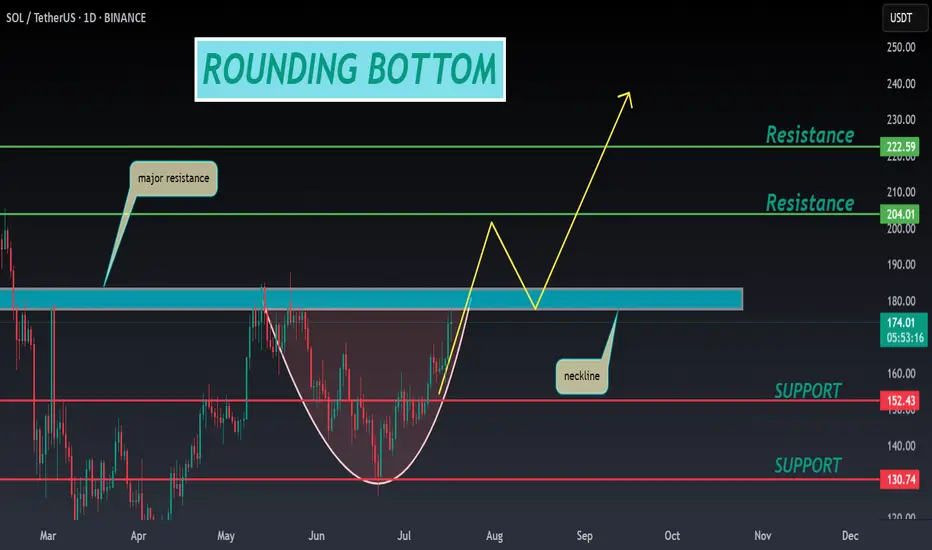
SOL ANALYSIS🔮 #SOL Analysis 💰💰
📊 #SOL is making perfect and huge rounding bottom pattern in daily time frame, indicating a potential bullish move. If #SOL retests little bit and breakout the pattern with high volume then we will get a bullish move📈
🔖 Current Price: $173.75
⏳ Target Price: $204.00
⁉️ What to do?
- We have marked crucial levels in the chart . We can trade according to the chart and make some profits. 🚀💸
#SOL #Cryptocurrency #Pump #DYOR
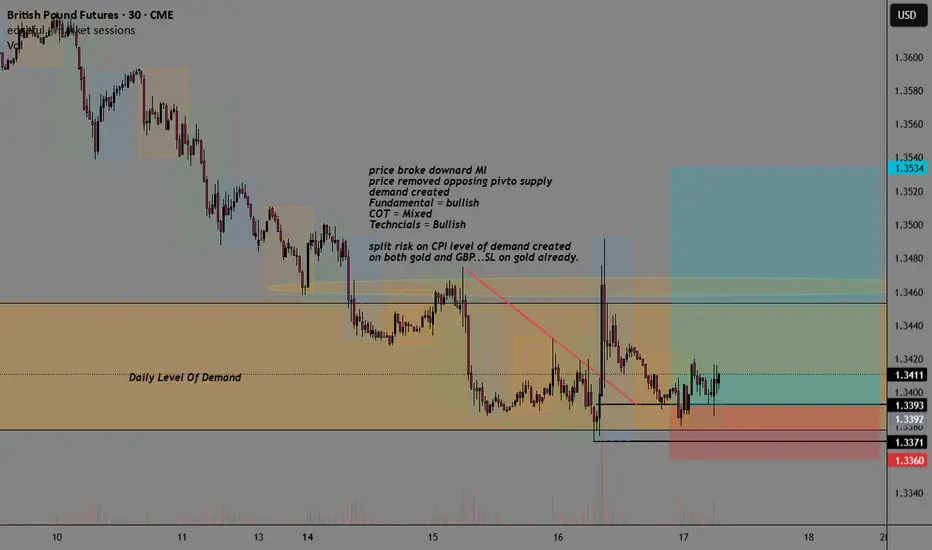
GBP GBPUSD Supply-Demand Long SignalHigher Timeframe Analysis:
- Price inside daily/Weekly level of demand + pivot
- Long term trend = uptrend
- Fundamentals Bullish
- COT Mixed
- Technicals Bullish
Lowertimeframe:
- Price broke downard ML
- Price removed the opposing pivotal level of demand
- DBR Demand created from CPI event
- Split risk on GC + GBP
This is a mix of using Sentiment, technical analysis, and fundamental analysis with supply-demand.
Market Volatile Amid Geopolitical Tensions & Fed Rumors Gold 17/07 – Market Volatile Amid Geopolitical Tensions & Fed Rumors
🌍 Macro Sentiment: Uncertainty Continues
The global gold market opened Thursday with high volatility following headlines that former U.S. President Donald Trump was considering firing Fed Chair Jerome Powell. Though Trump later denied the claim, the initial rumor spiked fear in financial markets.
At the same time:
🇮🇱 Israel launched airstrikes on Syria, escalating regional tensions.
🇪🇺 The EU proposed new tariffs on U.S. imports, increasing global economic friction.
🏦 Inflation concerns persist as BlackRock warns about delayed price pressures from earlier tariff hikes.
📉 These factors have turned gold into a temporary safe haven, but investors should remain cautious as the market is still undecided about direction.
🔎 Technical Outlook – Key Patterns to Watch
The H1 chart reveals price action respecting a wide consolidation range with visible liquidity sweeps on both ends. The market is forming a clean structure of lower highs, hinting at bearish bias unless bulls reclaim upper resistance zones.
Sell-side liquidity has been swept around the 3,320 level.
Order Block Sell Zone remains active at 3,342 – 3,344, potentially leading to a short-term drop.
If price breaks above 3,357 – 3,363 (VPOC & OB zone), a new bullish leg may form.
🎯 Trade Plan for Today
🟩 Buy Opportunity Zone
Entry: 3,312 – 3,310
Stop Loss: 3,306
Take Profits:
→ 3,316 → 3,320 → 3,324 → 3,328 → 3,335 → 3,340 → 3,350
📌 This zone has shown strong demand historically. Look for bullish candle confirmation on the lower timeframe (M15–H1).
🟥 Sell Opportunity Zone
Entry: 3,362 – 3,364
Stop Loss: 3,368
Take Profits:
→ 3,358 → 3,354 → 3,350 → 3,345 → 3,340
📌 This area overlaps with a VPOC level and prior order block – watch for price rejection patterns (e.g., bearish engulfing, fake breakouts).
⚠️ Risk Note
With geopolitical and monetary policy headlines dominating sentiment, price may spike erratically. Avoid overleveraging and always respect your SL/TP.
💬 What’s Your Take?
Do you think gold will break below 3,300 and head toward deeper FVG zones?
Or will bulls regain control and aim for 3,377 liquidity?
👇 Drop your analysis and let’s build the best gold trading community together!

EURUSD: Support & Resistance Analysis 🇪🇺🇺🇸
Here is my fresh support & resistance analysis for EURUSD.
Vertical Structures
Vertical Support 1: Rising trend line
Vertical Support 2: Falling trend line
Vertical Resistance 1: Falling trend line
Horizontal Structures
Support 1: 1.1577 - 1.1600 area
Support 2: 1.1445 - 1.1458 area
Support 3: 1.1356 - 1.1373 area
Support 4: 1.1190 - 1.1280 area
Resistance 1: 1.1682 - 1.1766 area
Resistance 2: 1.1807 - 1.1830 area
Consider these structures for pullback/breakout trading.
❤️Please, support my work with like, thank you!❤️
I am part of Trade Nation's Influencer program and receive a monthly fee for using their TradingView charts in my analysis.

USDCAD is breaking the trendline againOnce again, FX_IDC:USDCAD is breaking its medium-term downside resistance line, drawn from the current highest point of this year. If the rate remains above it, we may see a few more bulls stepping in. Let's take a look.
MARKETSCOM:USDCAD
Let us know what you think in the comments below.
Thank you.
75.2% of retail investor accounts lose money when trading CFDs with this provider. You should consider whether you understand how CFDs work and whether you can afford to take the high risk of losing your money. Past performance is not necessarily indicative of future results. The value of investments may fall as well as rise and the investor may not get back the amount initially invested. This content is not intended for nor applicable to residents of the UK. Cryptocurrency CFDs and spread bets are restricted in the UK for all retail clients.

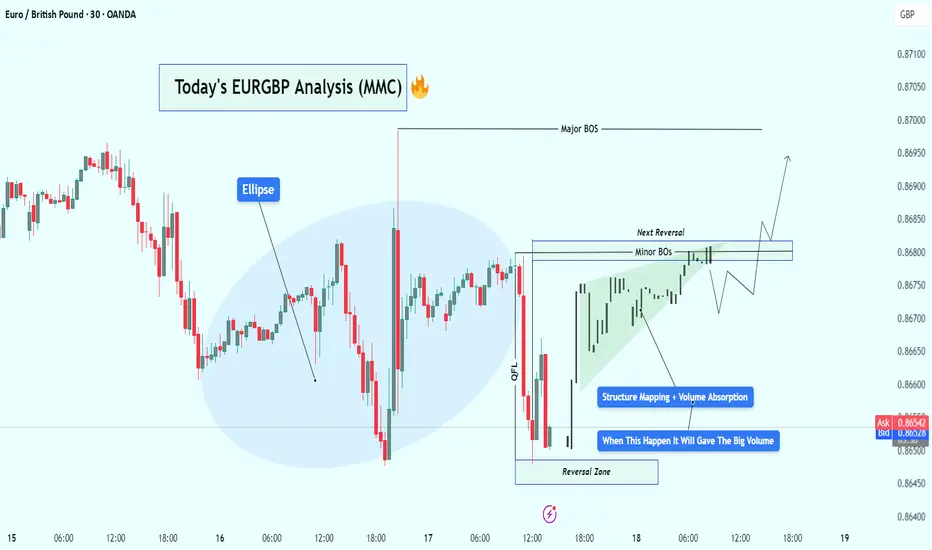
EURGBP Bullish Setup Analysis – MMC + Volume Absorption + TargetIn today's EUR/GBP 30-minute chart, we can clearly observe a well-structured Market Maker Cycle (MMC) in play, accompanied by Smart Money concepts such as volume absorption, minor BOS (Break of Structure), and reversal zone identification. Let’s walk through the technical story unfolding:
🧠 Step-by-Step Breakdown:
🟣 1. Reversal Zone & QFL (Quasimodo Failed Level) Formation
The price made a sharp decline, which trapped retail sellers chasing the breakout to the downside.
This drop landed into a key reversal zone — a price pocket where Smart Money often steps in for accumulation.
The QFL structure is evident here, showing a previous demand zone break and then recovery — classic stop-loss hunting behavior followed by institutional positioning.
This is often considered the “Spring” or “Manipulation” phase in Wyckoff or MMC theory.
🟩 2. Volume Absorption & Compression Phase
After tapping into the reversal zone, price action entered a tight compression range, forming a wedge/triangle.
During this phase, volume absorption is clearly visible — large players are absorbing selling pressure without letting price drop further.
This is a signal of re-accumulation. Buyers are loading up while keeping the price suppressed to mislead retail traders.
You’ve rightly labeled this phase as “Structure Mapping + Volume Absorption” — a textbook Smart Money behavior prior to breakout.
🔓 3. Minor Breaks of Structure (BOS)
As price consolidates, we begin to see Minor BOS— subtle shifts in structure where previous highs are taken out.
These BOS levels are confirmation that demand is outweighing supply.
Once we break multiple minor highs, it shows that buyers are now in control — hinting at the transition from Accumulation → Expansion.
📈 4. Projected Next Reversal + Breakout Scenario
The marked Next Reversal Zone above (around 0.8680–0.8695) is where we can expect the first true breakout and major expansion.
If price enters this area with increased volume, it validates that Smart Money is pushing into the Markup Phase of the MMC.
After the breakout, we could see price push toward 0.8710 and above.
📊 5. Market Maker Cycle (MMC) Summary
What we’re seeing here is a full-scale MMC pattern unfolding:
Manipulation (QFL trap ) → Accumulation (Volume absorption) → Structure Shift (Minor BOS) → Expansion (Reversal breakout)
This is the kind of setup that offers high-probability entries for those who understand Smart Money dynamics and wait for confirmation.
🎯 Key Levels to Watch:
Reversal Support Zone: 0.86450 – 0.86500
Breakout Target Zone: 0.86800 – 0.86950
Final Target (Swing): 0.87100+
🧠 Final Thoughts:
This EUR/GBP setup shows everything we love to see:
Liquidity taken ✅
Structure forming ✅
Volume building ✅
BOS confirming ✅
Expansion pending 🔜
Be patient. Let Smart Money reveal their hand through price action and volume confirmation.
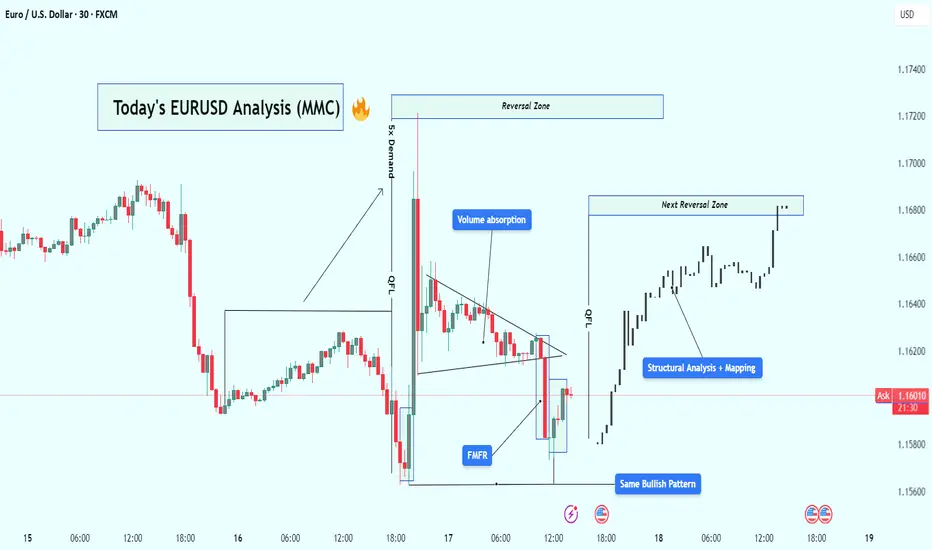
EUR/USD Analysis : Bullish Reversal – Volume Absorption & Target🧠 Market Overview:
EUR/USD has followed a flawless Market Maker Cycle, moving from manipulation to expansion. The chart shows institutional behavior through liquidity grabs, volume absorption, and structural breaks, confirming that big players are in full control.
The current price action signals bullish strength targeting the next high-probability reversal zone, but let’s break this down from the very beginning.
🔍 Key Chart Phases and Insights:
1️⃣ Massive Bearish Impulse – Liquidity Sweep Phase
At first glance, the chart shows an aggressive drop — a strong bearish leg that looks like market weakness.
❗ But in reality, this is the liquidity sweep phase. Here’s what likely happened:
Price ran below key lows
Hit stop losses of early buyers
Created “fake” bearish sentiment
Built sell-side liquidity for institutions to buy from
🔑 This isn’t weakness — it’s a setup.
2️⃣ FMFR (Final Move for Reversal) + Instant Reaction
At the end of that drop, the market printed a sharp bullish engulfing candle from the lows — this is known as the Final Move for Reversal (FMFR).
This marks:
The end of the accumulation phase
Entry of smart money into the market
The beginning of a new bullish cycle
The size and speed of this move indicate high-volume orders were filled — classic sign of institutional presence.
3️⃣ 5x Demand Push – Start of Expansion Phase
After the FMFR, price explodes upward with 5 consecutive bullish candles. This is your expansion phase — the market is moving fast, breaking structure, and flipping direction.
Key takeaways from this leg:
Strong displacement confirms a new trend
High momentum candles reflect institutional interest
Price breaks above previous structure levels
📈 This is no longer random — it’s planned and executed by bigger players.
4️⃣ Volume Absorption in Tight Wedge – Smart Money Re-Accumulation
After the breakout, price doesn’t just continue flying — instead, it compresses in a tight triangle. This is a key phase called volume absorption or re-accumulation.
What’s happening here:
Institutions are absorbing retail orders
Low volume = no resistance = easier breakout
Price is “charging” before the next move
🔋 Think of this like coiling a spring — it’s getting ready to pop again.
5️⃣ Bullish Pattern Repeats – MMC Confirmed
Interestingly, we now see the same bullish pattern forming again on the right side of the chart, similar to the first FMFR.
This is powerful because:
Pattern repetition means consistent order flow
Smart money is using the same blueprint
It gives us confidence to follow the trend
⚠️ When the same bullish setup happens twice — it’s not by chance.
6️⃣ Structural Mapping – Road to Reversal Zone
On the far right, we’ve entered clean bullish structure, making higher highs and higher lows.
We are now targeting:
The next Reversal Zone near 1.16800
This zone could act as resistance or another trap
A strong reaction from this zone can trigger either profit-taking or short-term reversal
Price is currently in the "continuation" part of MMC, heading toward premium levels.
📈 Trading Plan Based on This Setup:
✅ Primary Bullish Plan:
Price respects current structure
Breaks minor highs with strong volume
Entry on retracement to broken structure
Target: 1.16800 reversal zone
⚠️ Alternate Bearish Setup (If Price Rejects Reversal Zone):
Sharp rejection from reversal zone
Break of structure (BOS) on lower timeframe
Entry on lower high retest
Target: Liquidity areas below 1.16200
🧵 Conclusion:
This EUR/USD chart is a blueprint of institutional market flow. From the liquidity sweep, to volume absorption, to repeating bullish patterns, we’re seeing a textbook Market Maker Cycle (MMC) play out.
Here’s what makes this chart powerful:
✔️ Volume confirms structure
✔️ Reversal zones are clearly defined
✔️ Same bullish pattern = smart money roadmap
✔️ Trade setups are clean with defined risk
✅ This is the kind of setup you wait days for — don’t rush, follow structure, and execute with confirmation.
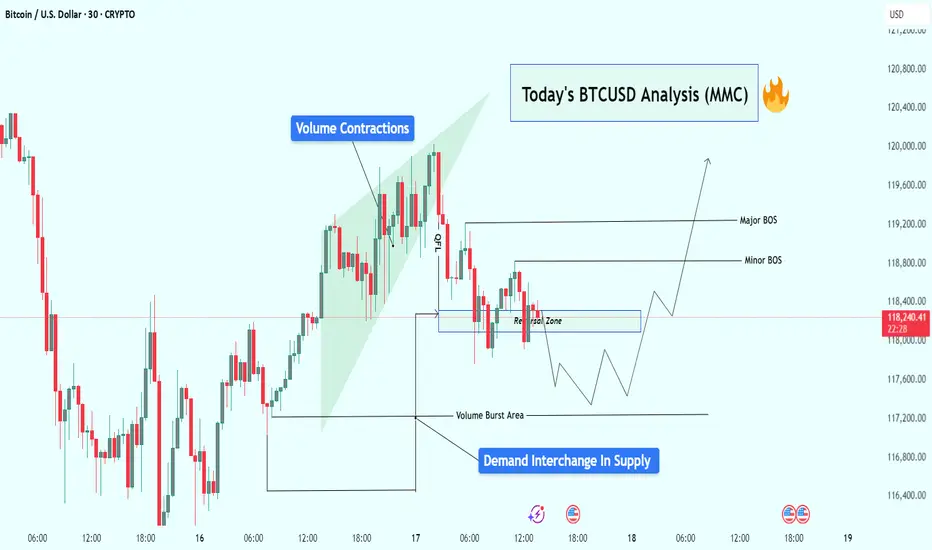
BTCUSD Analysis : Reversal Brewing from Volume Burst Demand Zone🧠 Overview:
Bitcoin is currently showing signs of a potential bullish reversal, following a classic Market Maker Cycle (MMC) pattern. The price action has been clean, respecting both volume dynamics and structural levels, setting the stage for a possible breakout above key areas of interest.
Let’s dive into the detailed breakdown:
🔍 Key Technical Elements:
1️⃣ Volume Contractions – Early Sign of Momentum Shift
At the top left of the chart, we observe a sharp upward move, followed by volume contraction within a rising wedge. This typically represents:
Absorption of orders
Reduced volatility
Market indecision
This kind of structure often precedes a reversal or aggressive breakout, depending on how price behaves near liquidity zones.
2️⃣ Fakeout/Trap Above – Classic MMC Manipulation Phase
After the rising wedge formed, BTC experienced a quick fakeout (stop hunt) just above the highs, then dropped sharply. This was the manipulation leg — a clear signal that liquidity above the wedge was taken and smart money is now repositioning.
🧠 Market makers love to trap breakout traders before moving the opposite way. The drop confirms manipulation is complete.
3️⃣ Reversal Zone + Demand Interchange into Supply
Price then entered a marked reversal zone which was previously an area of demand — now interchanging into supply. This zone is critical because:
It aligns with volume burst zones
It acted as support turned resistance
Multiple rejections confirm order flow shift
This tells us smart money is now testing this area to accumulate or trap sellers.
4️⃣ Volume Burst Area – Institutional Involvement Confirmed
We can clearly identify a Volume Burst Area, where price spiked with strong momentum — this is not retail trading. This zone is now being revisited for a potential bullish re-accumulation.
Expect reaction from this area, as it likely contains unmitigated buy orders from institutions.
5️⃣ Break of Structure (BOS) Mapping:
Minor BOS: Breaks short-term lower highs, showing early intent.
Major BOS: Breaks significant structure, confirming shift in trend direction.
A successful retest of demand and then break of both BOS levels will likely lead to a strong bullish continuation.
📈 Trade Plan & Potential Price Path:
There are two potential bullish entry strategies forming:
✅ Scenario 1: Clean Breakout Plan
Price holds the current reversal zone
Breaks Minor BOS, then Major BOS
Retest of BOS confirms continuation
📍 Target: $119,600+
✅ Scenario 2: Liquidity Sweep Entry
Price dips lower into Volume Burst Area
Sweeps liquidity below and prints a bullish reaction
Enters from discount zone
Same upside targets apply
🧠 This would be a smart money entry — entering from the lowest point of pain for retail traders.
🧵 Final Thoughts:
BTC is setting up beautifully for a reversal continuation pattern within the MMC framework. We’ve seen:
📉 Initial drop (accumulation phase)
🎭 Fake breakout (manipulation phase)
📈 Upcoming expansion (breakout phase)
All signs point to a high-probability move upward, especially if price confirms with BOS + retest. Be patient, wait for price action to align with structure and volume clues.
MARA Is Waking Up And Looks Promising For The Crypto MarketMARA Is Waking Up And Looks Promising For The Crypto Market, as it can send the price even higher this year from a technical and Elliott wave perspective.
Marathon Digital Holdings with ticker MARA nicely and sharply recovered away from the strong support after a completed projected higher degree abc correction in wave B/2. So, similar as Crypto market, even MARA can be forming a bullish setup with waves »i« and »ii« that can soon extend the rally within wave »iii« of a five-wave bullish cycle within higher degree wave C or 3, especially if breaks above 21 first bullish evidence level. It could be easily supportive for the Crypto market if we consider a positive correlation.

MarketBreakdown | EURAUD, GBPJPY, WTI CRUDE OIL, SILVER
Here are the updates & outlook for multiple instruments in my watch list.
1️⃣ #EURAUD daily time frame 🇪🇺🇦🇺
The market is trading in a bullish trend.
The price is steadily growing within a rising parallel channel.
A recent test of its support triggered a strong bullish reaction.
I think that a rise may continue at least to a current high - 1.8035
2️⃣ #GBPJPY daily time frame 🇬🇧🇯🇵
The market is consolidating within a narrow horizontal
parallel channel.
Consider consolidation, trading within its boundaries.
The next bullish wave will be confirmed with a breakout and a
daily candle close above its resistance.
3️⃣ CRUDE OIL #WTI daily time frame 🛢️
The market remains weak and consolidation continues.
I see a wide horizontal range where the price is now stuck.
I think that we may see a pullback from its support.
4️⃣ #SILVER #XAGUSD daily time frame 🪙
The market is retracing after a formation of a new higher high.
I see a strong demand zone ahead: it is based on a rising trend line
and a recently broken horizontal resistance.
The next trend following movement will most likely initiate from there.
Do you agree with my market breakdown?
❤️Please, support my work with like, thank you!❤️
I am part of Trade Nation's Influencer program and receive a monthly fee for using their TradingView charts in my analysis.

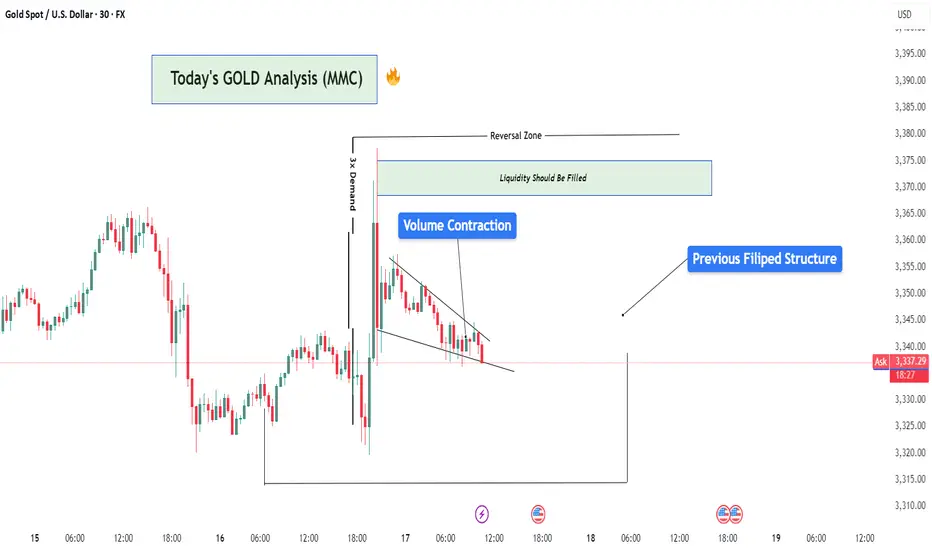
Gold Market Analysis (XAU/USD) – MMC Analysis + Liquidity Target🧠 Market Context Overview:
Gold recently experienced a highly impulsive move from a major demand zone, suggesting strong smart money activity. The market is currently in the redistribution phase of the MMC (Market Maker Cycle), transitioning between a reversal impulse and a liquidity targeting move.
Let’s dissect the key zones, structure, and confluences that support the ongoing market narrative.
📍 1. Strong Demand Reaction (3X Demand Spike):
We start with a triple-tap demand rejection, where the price sharply reversed to the upside. This kind of movement typically represents:
Institutional Entry Points
Stop-Hunt Below Previous Lows
Liquidity Grab Before Expansion
This strong bullish engulfing candle signifies position building by smart money, often the beginning of a significant leg up.
🧱 2. Reversal Zone & Liquidity Imbalance:
The highlighted green zone between $3,370–$3,375 is crucial. Why?
It’s an inefficiency zone where price moved too fast with low resistance.
This created a liquidity void that typically needs to be revisited (also known as FVG – Fair Value Gap).
The area also coincides with structural resistance, making it a high-probability target for price to revisit and reject again or break through with intent.
📌 Smart money always returns to areas of unfilled liquidity to close their positions or trap late retail entries.
🔺 3. Volume Contraction (Wedge Pattern Formation):
After the explosive push upward, the market started compressing, forming a descending wedge — a classical volume contraction pattern.
What does this mean?
Volatility is decreasing
Liquidity is building up
Big breakout is expected
It’s like pulling a slingshot — the more it contracts, the stronger the release will be. The direction will depend on which side breaks first.
🔁 4. Previous Structure Flipped (Support turned Resistance):
You’ll notice a key level around $3,353–$3,355 acting as a flipped structure.
This was previously a support zone that got broken.
Now it’s acting as resistance — a classic example of support/resistance flip.
This adds confluence to the idea of a possible rejection or reaction in this area.
🧠 Structure flipping is a smart money trick — break structure, retrace to trap liquidity, and then run the opposite direction.
📊 5. MMC Logic – Market Maker Cycle in Play:
Here’s how the MMC is flowing:
Accumulation (bottom consolidation)
Manipulation (liquidity sweep below demand)
Expansion (aggressive upward move)
Contraction (volume dies, price slows down)
Now we’re waiting for the next manipulation or expansion phase.
The current wedge is the pause before the next move, which could fill liquidity in the reversal zone or go lower to sweep resting sell-side liquidity.
🎯 Trading Scenarios:
✅ Bullish Bias (if breakout happens):
Break and close above the wedge
Retest previous flipped structure successfully
Target: Liquidity zone at $3,370–$3,375
🎯 This move would fill the imbalance and potentially tag sell-side liquidity sitting at the top.
❌ Bearish Bias (if rejection holds):
Failure to break above flipped structure
Breakdown from the wedge
Target: Demand origin around $3,325–$3,315
🧲 A move lower would make sense if liquidity remains uncollected beneath the range.
🧵 Final Thoughts:
Gold is currently in a high-probability setup zone. We have:
✅ Clear demand reaction
✅ Imbalance above
✅ Volume contraction
✅ Flipped structure
✅ Strong MMC confluence
Now it's a waiting game. Let the market show its hand — either a clean breakout with volume or a fakeout/rejection and reversal.
📌 "Trade what you see, not what you think. Let the levels and liquidity guide your decision."