Dow Jones Potential DownsidesHey Traders, in today's trading session we are monitoring US30 for a selling opportunity around 44,450 zone. Dow Jones is trading in a downtrend and currently is in a correction phase in which it is approaching the trend at 44,450 support and resistance area.
Trade safe, Joe.
Technical Analysis

XAGUSD Analysis : Squeeze + Curved Support Break + Bearish SetupThe XAGUSD 4-hour timeframe presents a structurally rich bullish setup, displaying signs of smart money accumulation and directional bias toward a potential breakout. Price action is currently compressing beneath a major horizontal resistance, supported dynamically by a Black Mind Curve, indicating progressive demand absorption by larger players.
This structure — characterized by rounded, ascending support and multiple rejections off a flat resistance — resembles a re-accumulation cup-like formation beneath a key supply level. These conditions often precede high-probability breakouts, driven by liquidity engineering and retail trap setups.
🔍 Key Technical Elements:
🟢 1. Black Mind Curve Support (Dynamic Demand Zone)
The curved trendline support represents an institutionally significant accumulation level, respected over multiple sessions. Note the price’s consistent reaction at this curved support, producing long lower wicks and bullish engulfing candles — both signs of liquidity grabs followed by strong buyer commitment.
This curve essentially acts as a visual footprint of algorithmic buying interest — creating a controlled, higher-low structure leading into the resistance wall.
🔵 2. Major Horizontal Resistance Zone (~37.20–37.40)
This level has served as a historical sell-side liquidity pool, having rejected multiple attempts to break higher over the past weeks. Each approach has been met with selling pressure, but the gradual compression of price against this zone hints at an impending breakout. Repeated testing of resistance with higher lows builds pressure — a classic ascending re-test model.
🟡 3. Break of Structure (BOS) Levels: Confirmation Zones
Minor BOS (~36.20): Confirmed. Indicates bullish intent and short-term trend shift.
Major BOS (~35.80): The ultimate invalidation level. If broken, the bullish thesis is compromised, and price may re-enter the lower consolidation zone.
A bullish BOS above 37.40 would mark a true breakout and open the door to 38.00+ levels.
🔴 4. Liquidity & Smart Money Behavior
The long wicks and deep retests into the Black Mind Curve suggest stop-loss hunts and liquidity inducement. Institutions often use such zones to trap breakout traders early, accumulate orders below swing lows, and then reverse the move. The price action around July 3–10 reflects this behavior clearly.
⚫ 5. Volume & Momentum Consideration
While not shown in the chart, volume confirmation is critical here. A breakout above resistance should ideally be supported by increased volume and momentum divergence on RSI/MACD. A failure to confirm could indicate a fakeout trap, which is not uncommon in commodity markets like Silver.
📌 Strategic Trade Scenarios:
🟢 Bullish Continuation Setup:
Trigger: Break and 4H candle close above 37.40 resistance
Retest Entry: Wait for price to retest broken resistance (now support) with bullish confirmation (engulfing, pin bar, etc.)
Targets:
TP1: 38.00 (psychological round number)
TP2: 38.60–38.90 (measured move target from structure base)
TP3: 39.50 (extension target)
Invalidation: Break below 36.00 with strong bearish volume
🔻 Bearish Rejection Scenario:
Trigger: Sharp rejection from resistance zone followed by breakdown below the Black Mind Curve and BOS levels
Confirmation: Close below 36.20 with high volume
Targets:
TP1: 35.80
TP2: 35.20 (curve base)
TP3: 34.80 (range bottom liquidity zone)
Invalidation: Return above 36.80 after rejection
📘 Market Context & Professional Insight:
This is a high-probability continuation pattern in a bullish macro context. With interest rates stabilizing and commodity demand remaining firm, silver often trails gold in performance but catches up with volatility. Traders must watch the behavior around the resistance level, as that’s where smart money will show their hand.
Institutional traders typically accumulate below resistance and engineer a breakout with controlled price action — and this chart is a textbook display of that setup. The Mind Curve structure mimics Wyckoffian schematics in the re-accumulation phase.
Timing is crucial — breakout traders should be patient and disciplined, avoiding premature entries before a valid confirmation of strength.
✅ Conclusion:
Silver (XAGUSD) is approaching a critical juncture. The chart structure suggests an imminent breakout above major resistance, supported by institutional behavior along the Black Mind Curve Support. However, traders must remain agile — watch for breakout confirmation or signs of a false move followed by distribution.
This chart embodies a calculated bullish bias, and offers a great risk-to-reward opportunity for both trend followers and breakout traders.

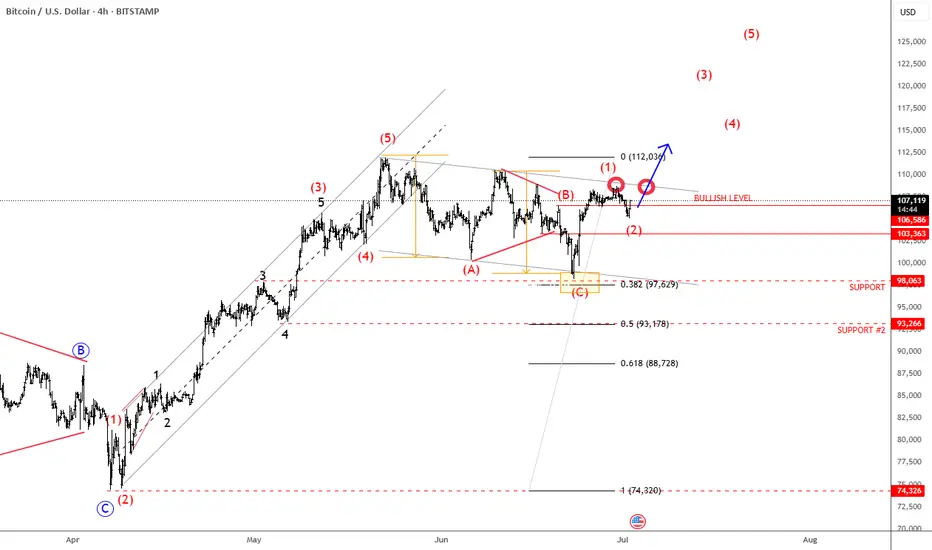
Bitcoin Is Looking For A Bullish ContinuationMorning all! Bitcoin has impulsive characteristics on 4h time frame, and we can clearly see five waves up that can send the price even higher after recent projected ABC correction. With the current impulsive recovery back above 106k area, it confirms that bulls are still here and we should be aware of further rally in July, especially if breaks above channel resistance line near 110k area. Seems like it's in wave (1) of a new five-wave bullish impulse, so after current wave (2) pullback, we can expect more gains within wave (3).
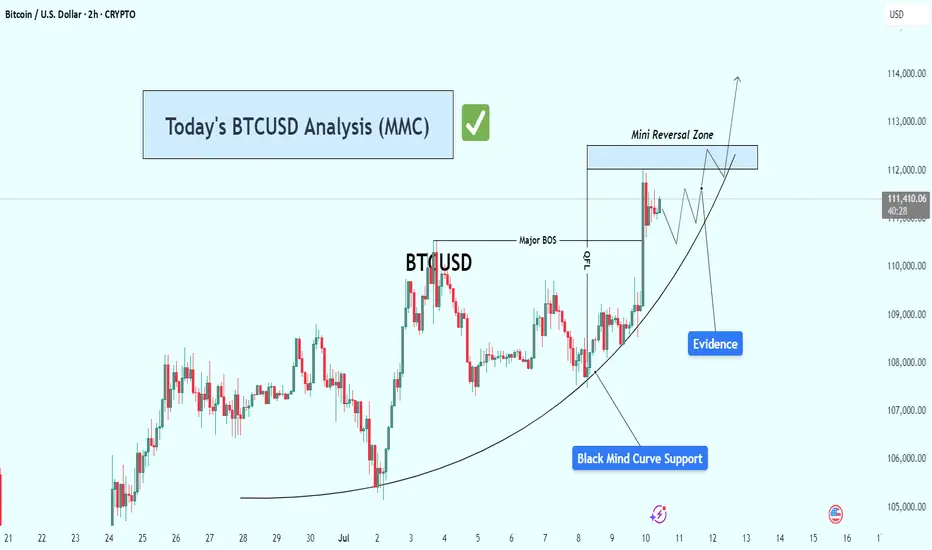
BTCUSD Analysis – Riding the Mind Curve & Bullish Setup Target🔎 Technical Narrative & Market Structure Analysis
Bitcoin is currently respecting a textbook parabolic support structure represented by the Black Mind Curve—a dynamic visual model reflecting the psychology of crowd behavior transitioning from uncertainty to confidence. This curved structure often precedes strong bullish continuation patterns, especially when paired with evidence of smart money involvement.
The current price action shows sequential higher lows, each of which is supported directly by the Mind Curve. These bounces confirm demand stepping in consistently at higher levels, a strong sign of controlled accumulation and momentum building.
🧠 Key Chart Components Explained
✅ 1. Mind Curve (Dynamic Support)
A custom-drawn parabolic curve reflects the ongoing upward force from buyers.
Bitcoin has tested and bounced from this curve multiple times, showing it is respected by market participants.
As price hugs the curve more tightly, the compression could lead to a volatility breakout.
✅ 2. Major BOS (Break of Structure)
A significant market structure break occurred as price took out a previous swing high.
This BOS confirms a shift in market sentiment from ranging/sideways to uptrend formation.
The BOS now acts as a reference point for bullish momentum and could serve as support on a potential retest.
✅ 3. QFL Zone (Quantity following line )
Located just below the BOS, this zone marks the last area where aggressive buyers stepped in before the breakout.
These levels are often defended on a retest and are used by institutional traders to re-enter positions.
✅ 4. Evidence Candle
This sharp bullish impulse candle is what we call an "evidence candle"—it pierces minor resistances with strength and volume.
It represents institutional-level interest and confirms smart money accumulation.
Such candles typically precede either continuation or minor pullback for re-accumulation.
✅ 5. Reversal Zone (Target Zone)
This zone lies ahead at approximately 112,500 to 113,000, a confluence of previous supply, key psychological level, and potential liquidity pool.
It's the next logical area where price may pause, react, or break through if momentum sustains.
⚔️ Scenarios to Watch
🟩 Bullish Scenario:
Price continues riding the curve support upward.
Breaks and closes above the Reversal Zone, ideally with volume and continuation candle.
Potential upside extension toward 114,000–115,000.
🟨 Neutral/Consolidation Scenario:
Price consolidates just below the Reversal Zone.
May form a flag/pennant or triangle structure.
Bullish continuation likely if the curve holds beneath.
🟥 Bearish/Invalidation Scenario:
Price breaks below the Mind Curve and BOS, closing below with momentum.
This would signal a potential breakdown of the bullish structure.
Invalidation zone likely sits below 110,000, and a breakdown could open room to revisit the 108,500–109,000 area.
📌 Confluence Factors Supporting the Bullish Bias:
Respect of Mind Curve over time = hidden institutional support
Presence of BOS and QFL = structure and order block confluence
Evidence candle = high-volume trigger point
Reversal Zone = logical magnet for price, supported by liquidity and previous reactions
📈 Summary & Trading Thesis
Bitcoin is currently in a bullish microstructure within a larger range. The parabola-style Mind Curve suggests that this structure is maturing toward an inflection point. The break above BOS, evidence of strength, and alignment with demand zones all support a move toward the 112,500–113,000 Reversal Zone. If momentum sustains, this could become the start of a broader bullish leg.
📢 Final Thought:
While the setup is bullish, discipline and patience are key. Watching how price behaves around the Reversal Zone will be critical. A clean breakout or solid rejection will provide the next high-probability signal.
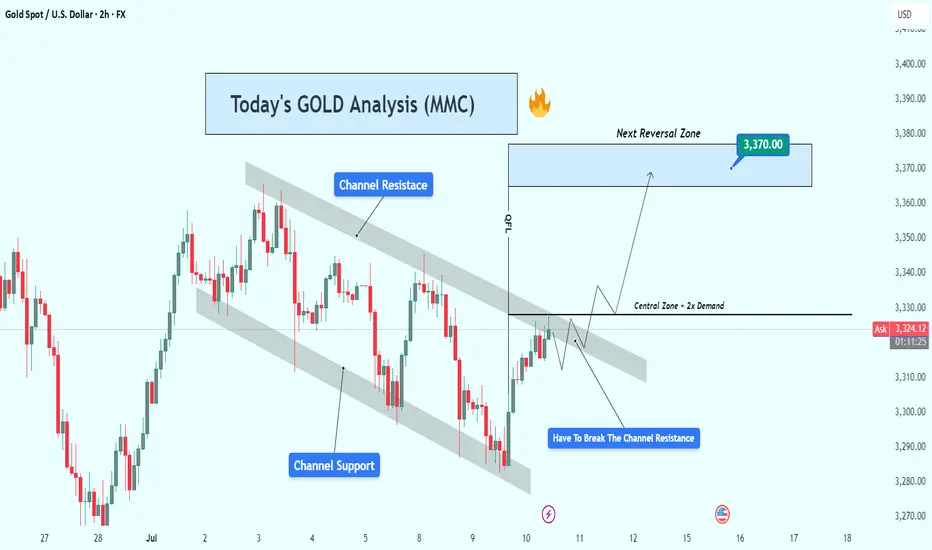
Gold (XAUUSD) Analysis : Bullish Structure Setup + Target🧠 Gold (XAUUSD) Technical Analysis
Gold has recently been trading within a clearly defined descending channel, which has governed price action over the past several sessions. This structure is characterized by a series of lower highs and lower lows, forming well-established channel resistance and channel support levels. However, recent bullish pressure has led price to aggressively test the upper boundary of this channel, signaling the potential for a structural breakout.
We are now at a technical inflection point, where a successful breakout and retest could mark the beginning of a significant trend reversal and short-to-medium term bullish move.
🔍 Key Technical Levels & Zones
🔷 Channel Resistance (~3,325)
The price is currently testing the descending trendline acting as channel resistance.
This area has previously rejected price several times, increasing its significance.
A confirmed break and close above this level may shift the market bias from bearish to bullish.
🔷 Central Zone – Dual Demand (~3,325–3,330)
This horizontal zone intersects with the channel resistance and aligns with two previous demand zones, now acting as a key decision area.
The market must validate this zone as new support before any sustained upward movement can occur.
🔷 Next Reversal Zone – Target (~3,370)
The next major area of interest lies around 3,370, a zone identified by previous swing highs and visible liquidity pools.
This level is likely to act as a magnet for price if bullish structure is confirmed.
📈 Price Structure Outlook
The potential breakout is supported by a strong bullish impulse off the channel support, followed by a series of higher lows suggesting growing bullish momentum. The projected movement scenario is as follows:
Break above the channel resistance
Retest and confirm the central zone as support
Continuation toward the 3,370 reversal zone
This would complete a classic break–retest–continuation pattern.
✅ Trade Considerations (Not Financial Advice)
Entry Type Entry Condition Target Stop Loss
Aggressive Break & 2H close above 3,330 3,370 Below 3,320
Conservative Retest & bullish confirmation above 3,325 3,370 Below 3,310
Risk Management:
Use position sizing aligned with your risk tolerance (max 1–2% per trade).
Monitor volume closely during breakout and retest for confirmation.
⚠️ Invalidation Scenario
If price fails to break above the channel and is rejected strongly, especially with a bearish engulfing or long upper wick, the downside could resume. In such a case, price may revisit the channel midline or even the lower boundary around 3,290.
📝 Summary
Gold is at a critical juncture, testing long-standing channel resistance.
A break above and successful retest of the 3,325–3,330 zone could lead to a rally toward 3,370.
This setup reflects a potential shift in structure from bearish to bullish on the 2H timeframe.
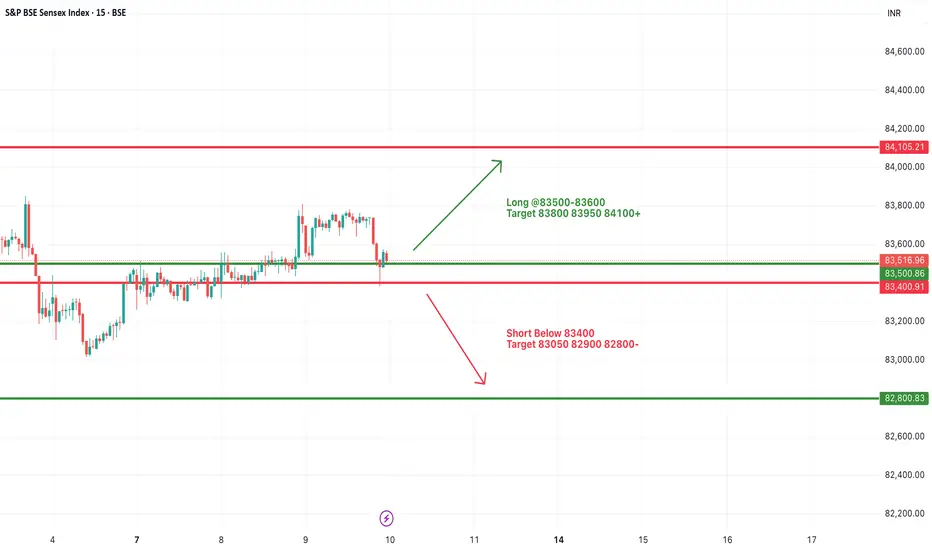
#SENSEX Intraday Support and Resistance Levels - 10/07/2025Sensex is expected to open flat today, continuing the consolidation observed in the past few sessions. The price action remains range-bound with key support near 83400 and resistance around 83600 levels.
Currently, Sensex is hovering near its critical range with buyers and sellers struggling for control. A breakout above the 83500–83600 zone may trigger fresh bullish momentum with targets at 83800, 83950, and 84100+. Sustained movement above 84100 could signal a stronger trend reversal.
On the downside, a breakdown below the 83400 level could lead to weakness, with immediate targets at 83050, 82900, and 82800-.
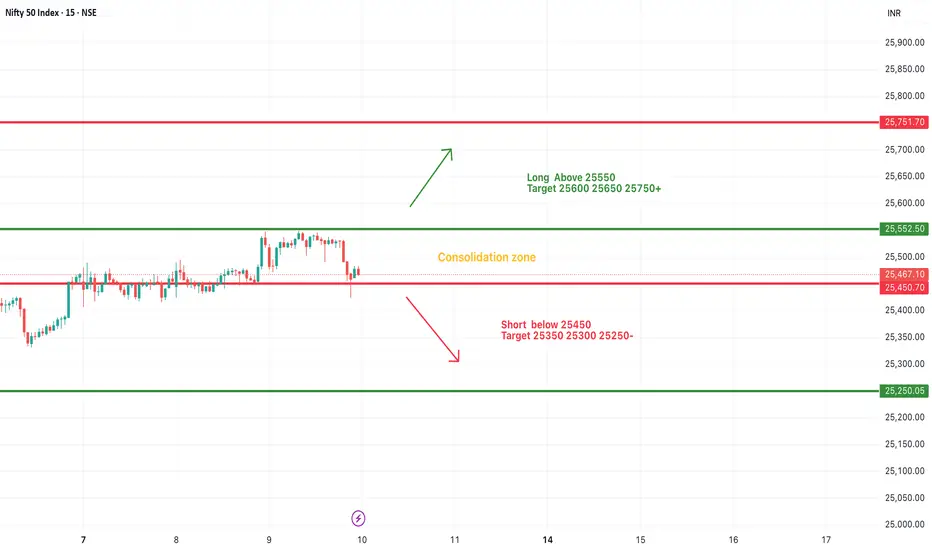
#NIFTY Intraday Support and Resistance Levels - 10/07/2025Nifty is also expected to open flat today, reflecting a similar consolidation pattern observed in recent sessions. The index continues to trade within a tight range, signaling indecisiveness among traders and lack of strong directional momentum.
Currently, Nifty is oscillating in a consolidation zone between 25550 resistance and 25450 support. A breakout above 25550 could trigger fresh long entries, with potential upside targets at 25600, 25650, and 25750+. Sustained strength above 25750 may open the way for extended bullish movement.
Conversely, a breakdown below the 25450 level may lead to short opportunities, with downside targets at 25350, 25300, and 25250-.
Until the index decisively breaks out of this range, sideways movement is likely to persist. Traders should wait for confirmation before taking aggressive directional positions.
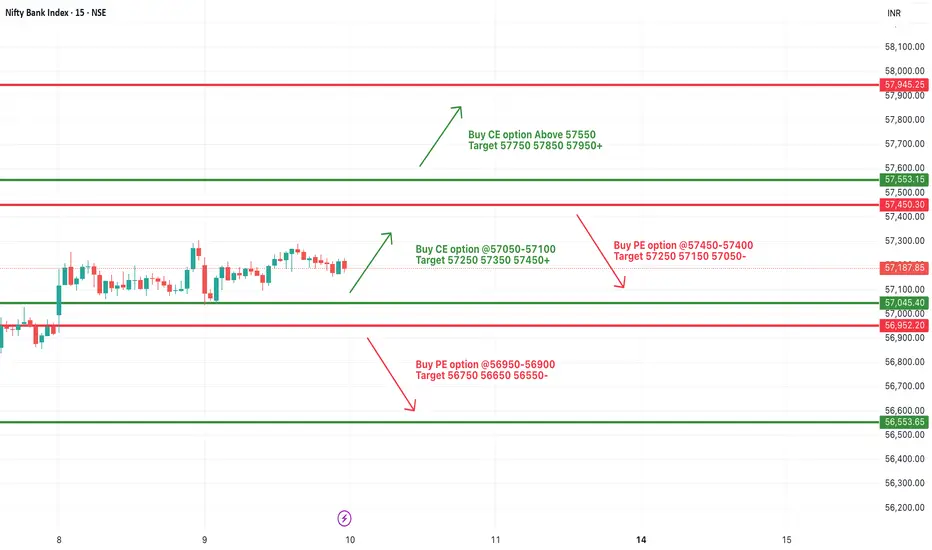
[INTRADAY] #BANKNIFTY PE & CE Levels(10/07/2025)Bank Nifty is expected to open flat today due to the continued consolidation seen over the last few sessions. The index is trading within a tight range between 57450 on the upside and 57050 on the downside, indicating indecision in the market.
A sustain above the 57050–57100 zone could initiate fresh buying momentum, potentially pushing prices towards the targets of 57250, 57350, and 57450+. Sustained move above 57550 may further lead to an extended rally toward 57750, 57850, and even 57950+ levels.
On the other hand, if the index breaks below the 56950–56900 level, it may invite fresh selling pressure. In such a scenario, downside targets are seen at 56750, 56650, and 56550-.
Until a decisive move happens beyond the upper or lower bounds, expect sideways action within the current consolidation range. Traders are advised to wait for a breakout from the range for directional trades.
XAUUSD – Bearish Pressure Continues Below the TrendlineGold remains in a downtrend as price consistently gets rejected at the long-term descending trendline. After a short-term rebound toward the $3,341.300 level – near the trendline – XAUUSD is likely to resume its decline toward the support area at $3,254.400. The visible FVG zones indicate that selling pressure is still dominant.
In terms of news, the upcoming U.S. CPI data release on July 11 is the key event that could trigger strong volatility in gold prices. Previously, market sentiment turned cautious after the U.S. government delayed new tariffs on 14 countries, reducing risk-off demand and pulling capital away from gold. If the CPI data comes in hotter than expected, it could further fuel the downside momentum.
Keep an eye on the $3,254.400 level – this is the final support before gold potentially extends its drop to lower price zones.

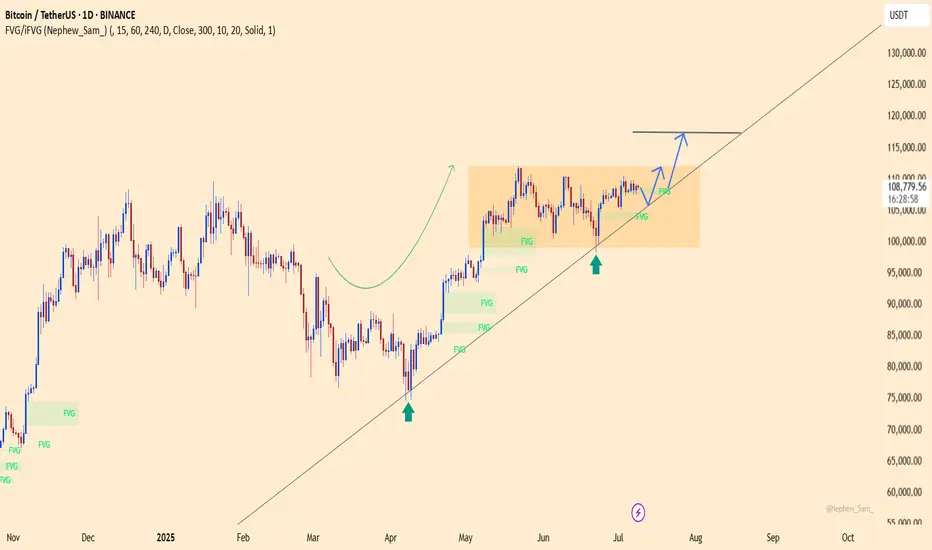
BTCUSDT – Calm Before the BreakoutBitcoin is holding firmly above the ascending trendline, consolidating within the accumulation range of $98,000 to $117,000. The current structure suggests that buyers remain in control, especially after a strong rebound from the $98,450 support zone.
In terms of news, BTC has been slightly affected by market concerns over new U.S. tariffs. However, on-chain data still shows strong accumulation around the $108,000 level. If this base holds, BTCUSDT could break out toward the $117,424 target in the near term. Conversely, if the trendline fails, the $98,000 level will be the final stronghold for the bulls.
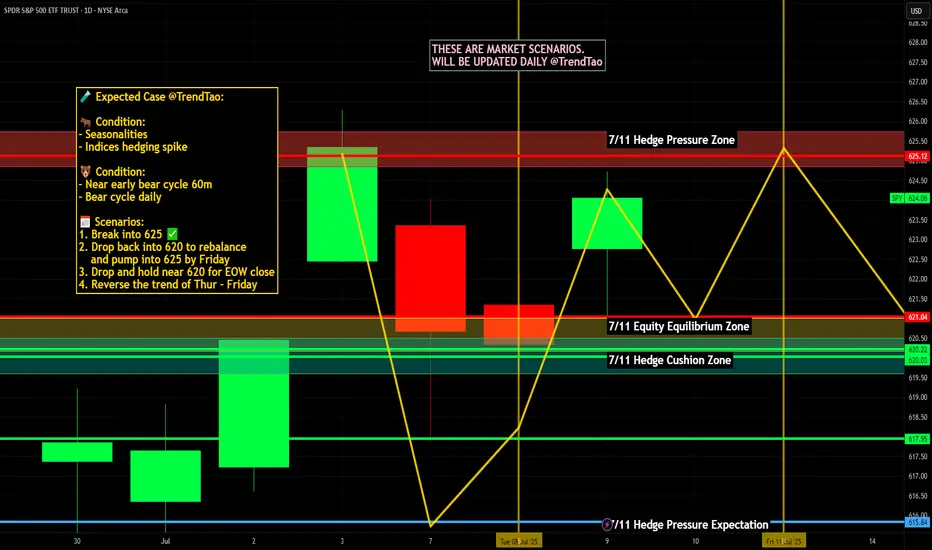
Nightly $SPY / $SPX Scenarios for July 10, 2025🔮 Nightly AMEX:SPY / SP:SPX Scenarios for July 10, 2025 🔮
🌍 Market-Moving News 🌍
🏦 Global Banks Profit from Tariff Volatility
Major banks like JPMorgan, BofA, and Citigroup are expected to see ~10% growth in trading revenue in Q2, fueled by volatility from President Trump’s tariff policy shifts. Treasury trading volumes hit record highs as markets priced in policy swings
📈 S&P 500 Nears Lull Amid Bull Market Strains
Despite record highs in 2025, investors are warning that the rally may be reaching its limit. Bullish sentiment is strong, but analysts caution that sluggish consumer spending, rising inflation from tariffs, and few rate-cut signals from the Fed could cap downside momentum
🐻 Bear Case Gains Ground
Stifel’s Barry Bannister projected a potential ~12% correction in the second half of 2025. Key risks include slowing consumer spending, weak capital investment under tariff uncertainty, and persistent core inflation above 3%, negatively impacting earnings and growth outlooks
⚖️ “One Big Beautiful Bill” Could Add Trillions in Debt
The new fiscal package signed July 4 will add $3–4 trillion to national debt over the next decade while extending tax cuts and revising EV incentives. Bond market and Fed policy implications may become more pronounced if growth fails to keep pace
📊 Stocks vs Bonds: Diverging Signals
While equities climb and megacaps extend gains, Treasury yields have risen five days straight—signaling growing caution over real growth prospects. The yield curve steepening hints at mixed signals: growth optimism in stocks, but bond market signaling economic risk ahead
📊 Key Data & Events
📅 Thursday, July 10:
No major scheduled economic releases. Markets remain driven by tariff headlines, bank earnings reactions, and evolving Fed signals.
⚠️ Disclaimer:
This is for informational and educational purposes only—not financial advice. Consult a licensed advisor before making investment decisions.
📌 #trading #marketvolatility #tariffs #banks #Fed #debt #technicalanalysis
Gold is Nearing The Daily TrendHey Traders, in today's trading session we are monitoring XAUUSD for a buying opportunity around 3,260 zone, Gold is trading in an uptrend and currently is in a correction phase in which it is approaching the trend at 3,260 support and resistance area.
Trade safe, Joe.

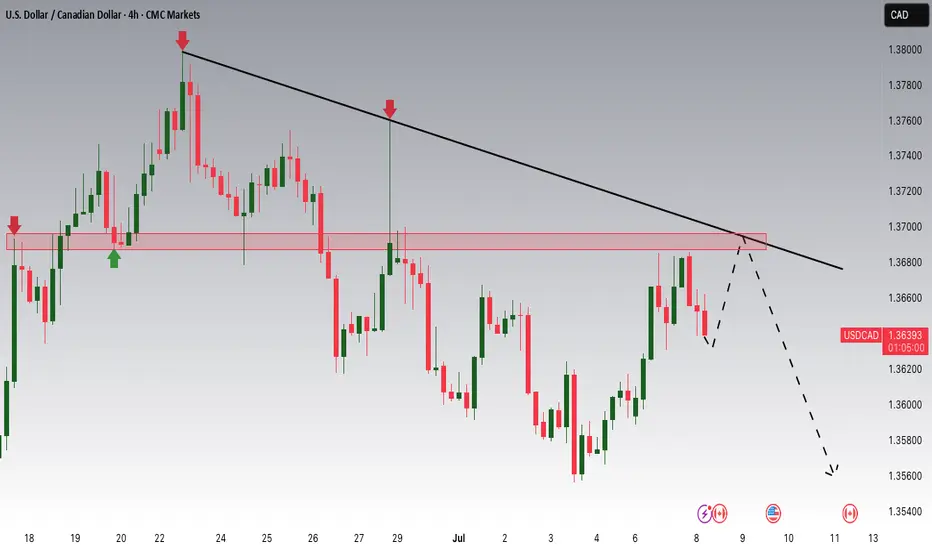
USDCAD Potential DownsidesHey Traders, in today's trading session we are monitoring USDCAD for a selling opportunity around 1.36900 zone, USDCAD is trading in a downtrend and currently is in a correction phase in which it is approaching the trend at 1.36900 support and resistance area.
Trade safe, Joe.
Quick take o sugar futuresThe technical picture is starting to look quite interesting. Let's see if seasonality will kick in as well. Let's dig in.
MARKETSCOM:SUGAR
ICEUS:SB1!
Let us know what you think in the comments below.
Thank you.
75.2% of retail investor accounts lose money when trading CFDs with this provider. You should consider whether you understand how CFDs work and whether you can afford to take the high risk of losing your money. Past performance is not necessarily indicative of future results. The value of investments may fall as well as rise and the investor may not get back the amount initially invested. This content is not intended for nor applicable to residents of the UK. Cryptocurrency CFDs and spread bets are restricted in the UK for all retail clients.

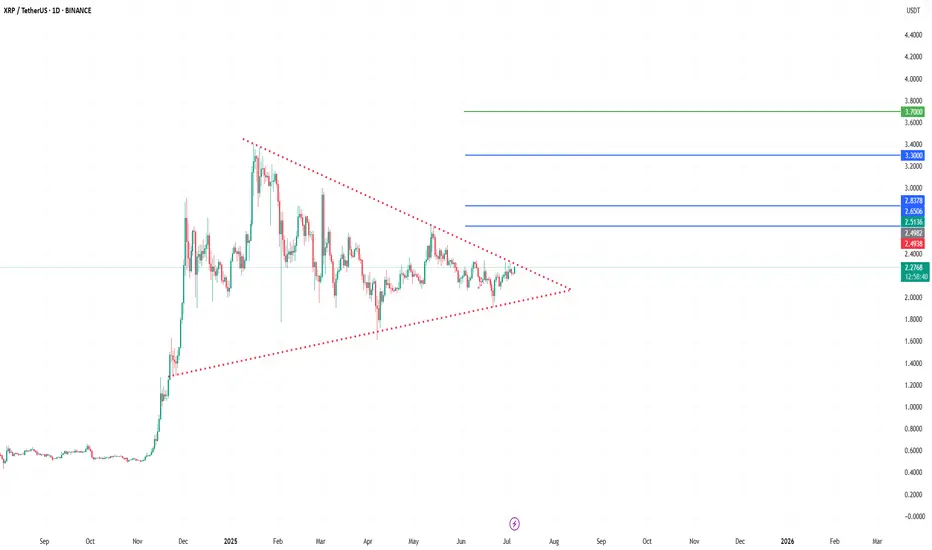
XRP/USDT| Targeting $3.3 to $3.7📝 Description:
XRP has been consolidating inside a large symmetrical triangle on the daily chart since early 2025. Price is now approaching the apex, suggesting a potential breakout move is near.
🔹 Upper trendline resistance: ~$2.49
🔹 Lower trendline support: ~$1.90
🔹 Breakout level to watch: $2.45–$2.50
✅ If a breakout is confirmed with strong volume, potential upside targets include:
🎯 $3.30 – mid-range target
🎯 $3.70 – full breakout objective
A spike in volume will be key to confirming the move. Until the breakout is validated, this setup remains neutral.
📌 This is not financial advice – please do your own research before making any trading decisions.
💬 What’s your target for XRP if this breaks out?
There’s a higher probability of an upward breakout.🚨 Bitcoin Technical Update – Key Levels Ahead! 🚨
Bitcoin is currently forming a symmetrical triangle pattern, a classic setup that often signals a strong move ahead. At the moment, the market is leaning toward the upside, showing early signs of bullish momentum.
📈 If we see a breakout to the upside, it's crucial to wait for a retest of the breakout level. A successful retest could confirm the move, setting the stage for a strong upward rally. However, if the breakout fails, don’t rush in — just observe the price action closely to see how the market reacts.
⚖️ There’s a higher probability of an upward breakout, as liquidity is still building above, and there are strong support levels holding below. This combination could act as a springboard for price to move higher.
🔍 As always, Do Your Own Research (DYOR) before entering any trade. Stay alert and manage your risk wisely!

What is Dynamic Support and Resistance Levels & Zones in Forex
Dynamic supports and resistances play a crucial role in technical analysis.
Unlike classic supports and resistances, these zones change and adapt to a market price action in real time.
Learn what is dynamic support and resistance in Forex, Gold trading and how to find it easily.
Discover its main types and real market examples.
Let's start with the basics.
There are 2 major types of supports and resistances in technical analysis.
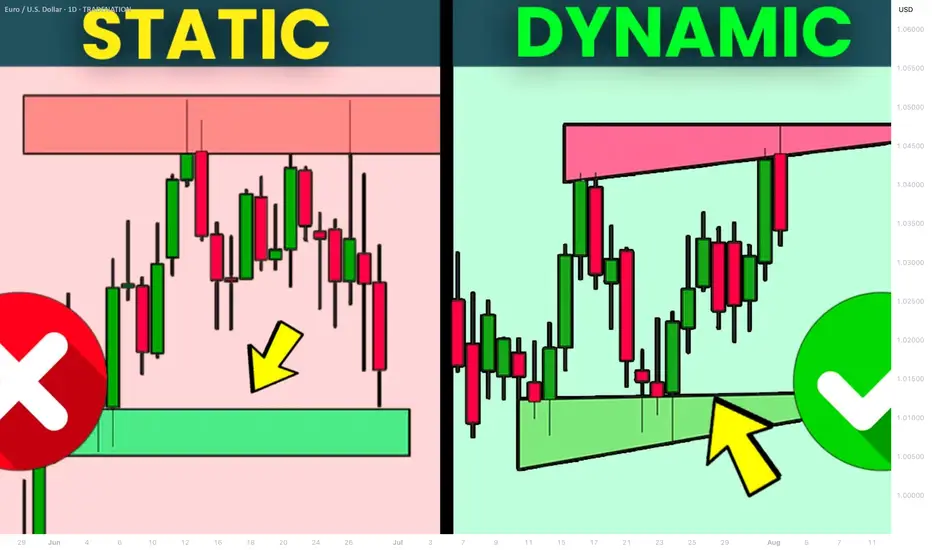
The first type is called static .
Such supports and resistances are fixed and don't change with time.
It should be strictly horizontal key levels or the zones.
Market price action and momentum beyond them do not affect these supports and resistances.
In the example above, you can find static supports and resistances on Gold. The market may return to one of those levels or the zones today, tomorrow or in a month, but it will not move.
In comparison to static supports and resistances, the dynamic ones shift with time. They constantly change and adjust as the time flies.
One of the obvious types of dynamic supports and resistances is a trend line.
Above is the example of a dynamic rising support based on trend line.
As the time goes, a support shifts and becomes higher and higher.
I found a great example of a dynamic resistance on Dollar Index.
Depending on the moment when the price tests that, the resistance will be on different levels.
The later the price tests the trend line, the lower is the resistance.
When newbie traders learn dynamic supports and resistances, they usually stop on trend lines.
But it is just a beginning.
Really significant dynamic supports are resistances will be the zones .
The areas based on static horizontal supports and resistances and trend lines.
Examine a price action on GBPCHF forex pair.
We have a static horizontal support area and a dynamic rising trend line.
Two supports intersect, composing a contracting dynamic support zone.
With time, it will become narrower, accumulating buy orders within.
On NZDCAD forex pair, I underlined a contracting dynamic resistance zone that is based on an intersection of a static horizontal resistance area and a falling trend line.
Selling orders will be distributed within.
The 2 dynamic support and resistance zones that we discussed are narrowing , but that is not always the case.
A dynamic support zone that I found on GBPNZD is expanding and broaden with time.
It is based on a dynamic falling trend line and a static horizontal support.
With time its boundaries will be wider and a bullish reaction may initiate from any level within that.
A dynamic resistance area that I spotted on EURCAD forex pair is a great example of an expanding resistance.
It is based on a static horizontal resistance and a rising trend line.
We can easily recognize how it grows with time.
Of course, another types of dynamic supports and resistances exist. But they are more nuanced and rare.
As soon as you learn to recognize the clusters that we discussed in this article, you will be able to recognize the less obvious ones as well.
Next time, when you execute a support and resistance analysis, try to find a dynamic zone. You can find it on any time frame, and forex pair and gold, and it will completely change your perspective on the market.
❤️Please, support my work with like, thank you!❤️
I am part of Trade Nation's Influencer program and receive a monthly fee for using their TradingView charts in my analysis.
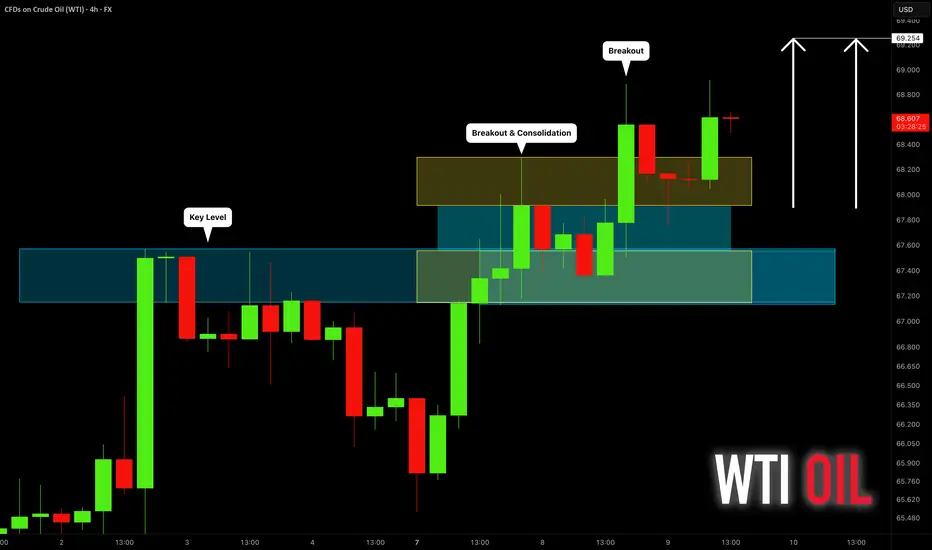
CRUDE OIL (WTI): Will It Rise More?
Quick update for my yesterday's analysis for WTI Crude Oil.
As I predicted yesterday, the price went up to the target.
We got one more strong bullish confirmation after a New York
session opening:
the price violated a resistance of a horizontal range on a 4H time frame.
I think that the market may rise even more and reach 69.25 level.
❤️Please, support my work with like, thank you!❤️
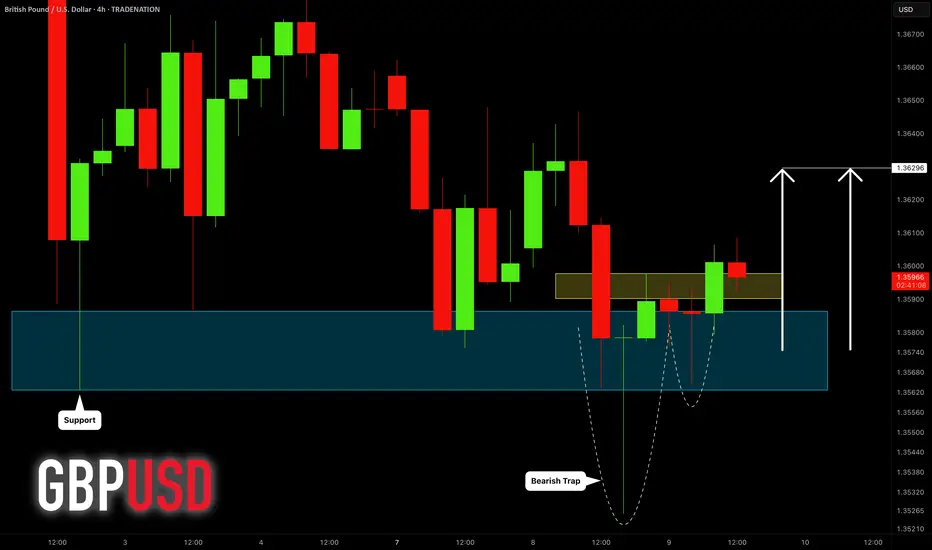
GBPUSD: Bullish Move After Liquidity Grab 🇬🇧🇺🇸
GBPUSD formed a bullish high range candle with a long lower wick going
below a key horizontal demand zone on a 4H.
A consequent recovery and a bullish London session opening suggest
a highly probable rise today.
Goal - 1.363
❤️Please, support my work with like, thank you!❤️
I am part of Trade Nation's Influencer program and receive a monthly fee for using their TradingView charts in my analysis.
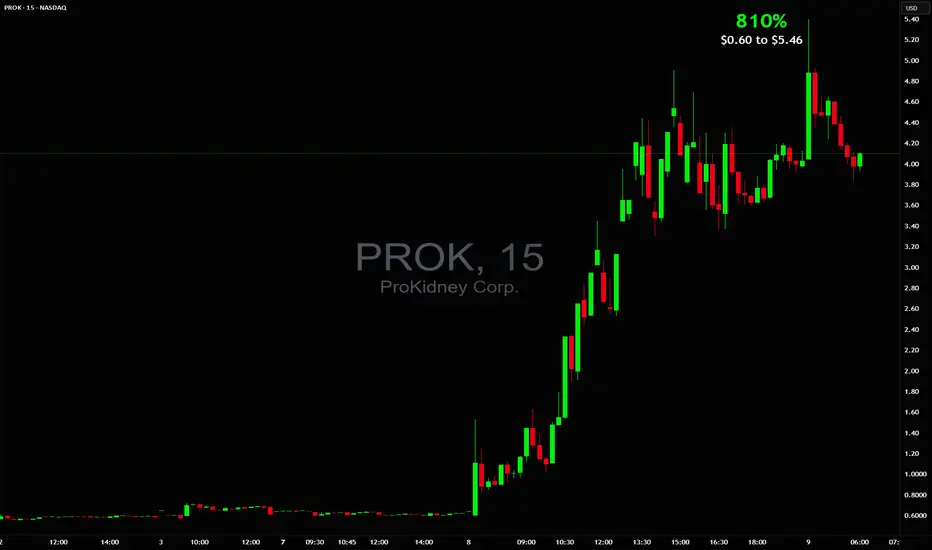
BIG 810% in 1 day $0.60 to $5.46💥BIG 810% in 1 day 📈 $0.60 to $5.46 there were almost more halts than candlesticks that's how wildly it traded NASDAQ:PROK
Other active stocks: NASDAQ:SCAG NASDAQ:BTCS NYSE:SRFM NASDAQ:BMGL NYSE:WOLF
#stocks #stockmarket #trading #trader #daytrade #strategy #teamwork #chart #analysis
Analyzing the Market with Fundamental and Technical AnalysisAnalyzing the Market with Fundamental and Technical Analysis
In addition to technical analysis, it's important to consider fundamental factors that could influence the market. News releases, economic reports, and central bank decisions can significantly impact price movements.
Fundamental Analysis:
Keep an eye on major economic indicators like NFP, CPI, and interest rate decisions. These factors can drive the market and change its trend direction.
Technical Analysis:
Use tools like EMA, Fibonacci, and Price Action to confirm the trend and identify entry points.
For daily updates and comprehensive market analysis, join my MMFLowTrading TradingView channel, where I combine both technical and fundamental analysis to give you the most accurate insights.
Conclusion:
Identifying market trends in one day doesn’t have to be complicated. By using the right tools like EMA, Fibonacci, and Price Action on TradingView, you can make better trading decisions every day. To take your trading to the next level, join my MMFLowTrading TradingView channel for daily updates, real-time trend analysis, and expert trading signals.
Ready to start trading with precision? Join my MMFLowTrading TradingView channel today for daily market insights and trading setups. Stay updated with real-time analysis, get actionable trading signals, and take your trading skills to the next level. Follow me now on TradingView!
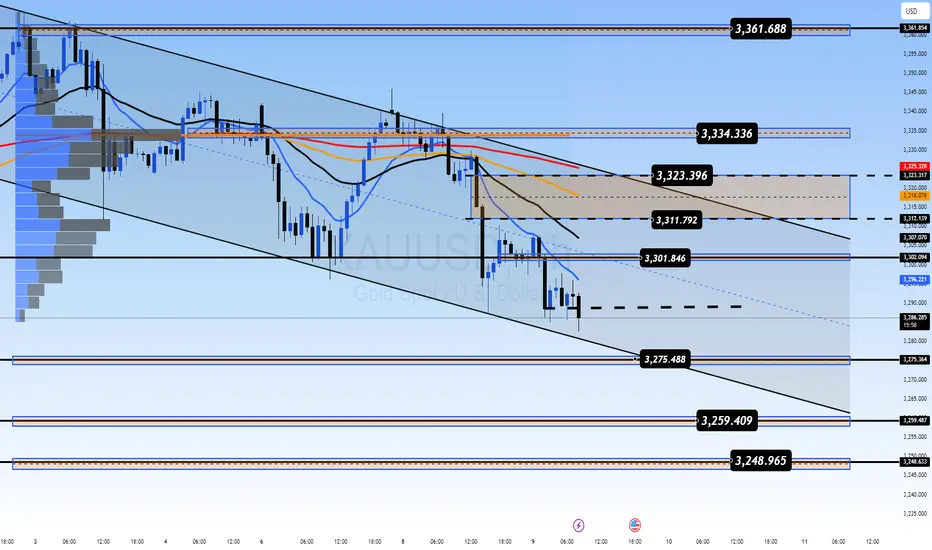
Is a Reversal on the Horizon or a Deeper Correction? 🔘Gold Faces Strong Resistance at 3300 – Is a Reversal on the Horizon or a Deeper Correction? ⭐️
Gold has recently faced a significant price correction after bouncing off key resistance levels. As geopolitical events settle and economic data comes in, the market is now testing crucial support levels. Today’s session could provide important insights into whether gold will maintain its bullish momentum or continue to correct further.
🔹Market Overview – USD Rebounds, Creating Short-Term Pressure on Gold
The US dollar has seen a strong rebound following positive developments in the global trade talks. Several key agreements between major nations, including the US, have been signed, which seem to support the USD in the short term. This has put downward pressure on gold, as traders shift their focus towards a stronger dollar and risk appetite returning to the market.
🔹US inflation data has come in lower than expected, creating room for the Fed to hold off on rate hikes, which helps the dollar further.
🔹FOMC meeting minutes later this week could reveal insights into the Fed's stance on interest rates, which could be key for market direction.
🔹Geopolitical tensions are cooling off slightly, which has reduced demand for safe-haven assets like gold.
🔹Technical Analysis – Gold in a Range-Bound Market, Testing Key Levels
On the H1 chart, gold is forming a clear downward channel between 3360 and 3290, suggesting that the price could continue its correction within this range. If the price stays within this zone, we might see a deeper pullback toward the 3250 region.
However, as always, waiting for confirmation signals before entering any trades is crucial. The false breakout risk is high when the price moves quickly and without clear confirmation from higher timeframes.
🔹Buy Bias in the Short-TermGiven the current technical structure, a buy bias seems more likely than further selling. The market may test 3320-3325 in the near term, with the potential to bounce back if the buying momentum continues to build. Additionally, the rejection wick on the D1 candle from yesterday suggests that sellers are losing control, and we may see more buying pressure in the coming sessions.
🔹Resistance and Support Levels to Watch:
🔺Key Resistance Levels: 3302 – 3310 – 3324 – 3335 – 3361
🔻Key Support Levels: 3275 – 3259 – 3248
⬜️Trading Strategy – Buy and Sell Zones
🔺BUY ZONE:3250 – 3248
🔹Stop Loss: 3244
✔️Take Profit: 3254 → 3258 → 3262 → 3266 → 3270 → 3280 → ????
🔺SELL SCALP: 3303 – 3305
🔹Stop Loss: 3310
✔️Take Profit: 3298 → 3294 → 3290 → 3286 → 3280 → 3270 → 3260
🔺SELL ZONE:3334 – 3336
🔹Stop Loss: 3340
✔️Take Profit: 3330 → 3326 → 3320 → 3315 → 3310 → 3305 → 3300 → ????
🕖Important Notes for Today: FOMC and Trade Policy Updates
With FOMC minutes and other important trade policy updates expected today, it’s crucial to stay alert for any sudden changes in market sentiment. Always ensure that you are adhering to your TP/SL levels to safeguard your account.
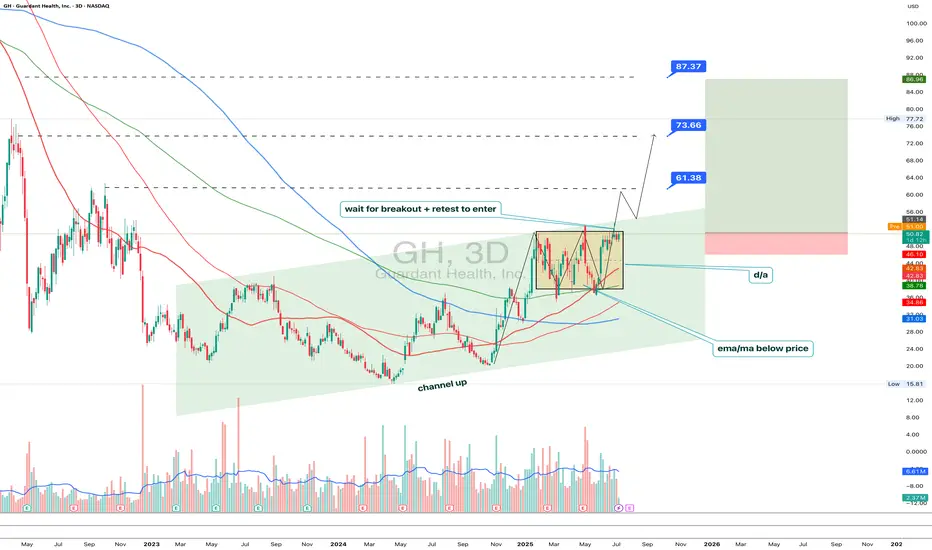
GH 3D: breakout forming inside ascending channelThe price of GH continues consolidating within the top of an ascending channel, confirming bullish structure. The rectangular accumulation has lasted for over three months, with price staying above all major EMAs and MAs - a strong trend confirmation. On the last impulse, volume increased, and now the price is compressing again. A breakout with a retest would serve as a valid entry. First target lies near 61.38, second at 73.66, and third at 87.37 - aligned with the upper range of the medium-term Fibonacci extension. Fundamentally, GH remains a promising biotech pick amid sector rotation and potential Fed easing. EMAs and MAs sit below price, and D/A supports the breakout scenario. Waiting for confirmation before entering.