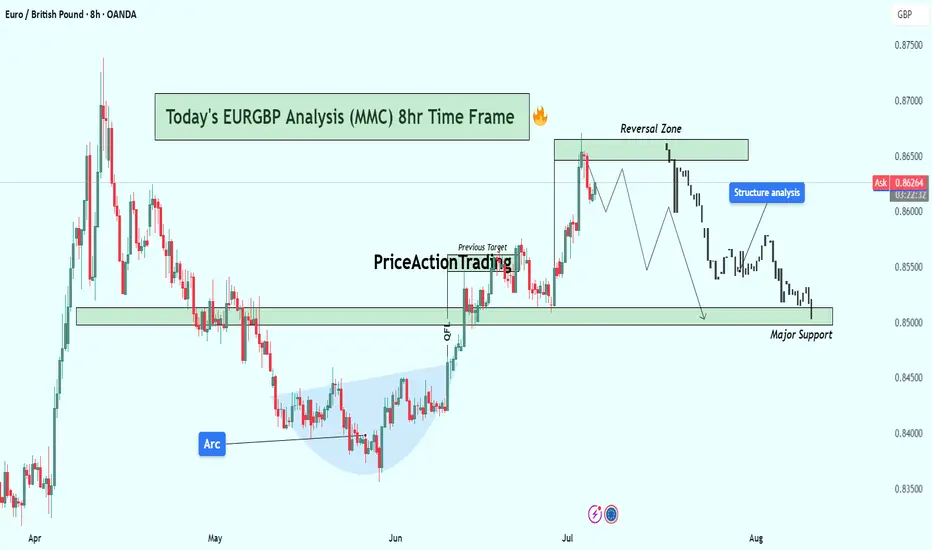
EURGBP 8H Analysis : Breakdown + Smart Money Structure + Target🧠 Phase 1: Arc Formation – Accumulation by Smart Money
The arc (May to June) reflects an accumulation base where price made higher lows with consolidative wicks and slow momentum, ideal conditions for institutional orders to build long positions.
Liquidity is swept below swing lows, stopping out early longs — this is classic smart money accumulation.
Volume compression during the arc followed by expansion on breakout confirms smart interest.
🔑 Psychology: Retail was likely selling here due to lower highs, while smart money was accumulating quietly at the bottom of the arc.
🚀 Phase 2: Breakout & Rally to Previous Highs
Price cleanly breaks above the arc’s neckline and previous resistance (labeled as Previous Target).
Momentum accelerates rapidly toward the reversal zone, likely due to stop hunts and FOMO buyers entering after confirmation.
Structure shifts bullish, creating strong impulsive candles — but these are often final exit points for smart money.
📌 Key Sign: Breakout aligns perfectly with market inefficiencies being filled, often a sign of a short-term top formation brewing.
🔄 Phase 3 : Reversal Zone – Distribution Phase
Inside the Reversal Zone (0.8650–0.8680), price shows exhaustion with multiple upper wicks and slowing bullish momentum.
Distribution signs: choppy movement, lower highs, and eventual breakdown.
Retail is often caught entering longs here on confirmation, while institutions offload their positions.
🧠 MMC Insight: This is where Mind Market Curve transitions from bullish impulse to corrective leg down — phase of deception.
📉 Phase 4: Structure Breakdown & Bearish Market Behavior
Price breaks through short-term higher low structure — confirmation of bearish intent.
The formation of lower highs and lower lows marks the beginning of a bearish trend shift.
Market is now targeting Major Support (0.8500–0.8520 zone), which is currently being tested.
🧭 If price breaks below 0.8500 with volume and aggression, next level is likely near 0.8430–0.8450.
⚖️ Current Price Location: Major Support Test
We’re at a critical decision point.
If support holds → expect a bounce to 0.8600–0.8620.
If it breaks → expect continuation to next liquidity pool below 0.8450.
This zone is where buyers and sellers will battle. Wait for:
Bullish confirmation (reversal pattern / engulfing candle) to go long.
Bearish breakout (close below zone + retest) to go short.
🔁 Summary of Scenarios
Scenario Conditions Target
✅ Bullish Bounce Rejection at support with bullish engulfing/pin bar 0.8600–0.8620
❌ Bearish Break Close below 0.8500 + retest as resistance 0.8430–0.8450
🔖 Educational Takeaway
This chart teaches how to:
Identify accumulation via arc and understand smart money behavior.
Recognize false confirmation zones (where retail enters late).
Understand structure shift as a trend reversal signal.
Execute trades based on reaction zones, not emotions.
If you follow MMC (Mind Market Curve), this is a textbook transition from:
Accumulation →
Expansion →
Distribution →
Breakdown
Technical Analysis
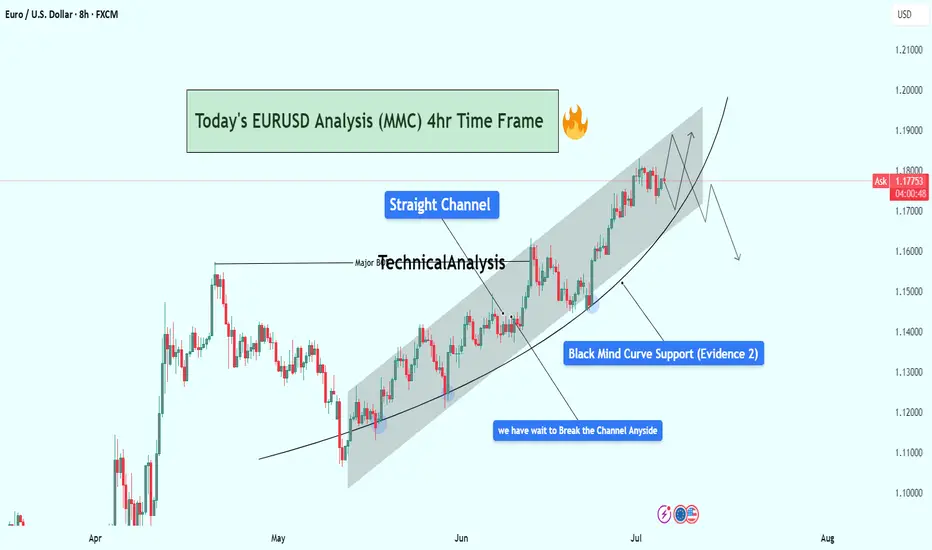
EURUSD 4H Structure Analysis | MMC Strategy + Channel + CurveIn this EURUSD 4-hour chart analysis using MMC (Market Mind Concept), we are observing a textbook rising channel structure accompanied by a black mind curve (evidence of psychological support behavior). Let's break it down:
📊 Structure Overview:
Straight Ascending Channel:
Price has been respecting a clean, straight rising channel, forming higher highs and higher lows over the past several weeks. This structure provides a controlled bullish bias, but we are approaching an inflection point.
Black Mind Curve Support (Evidence 2):
A curved trendline (Mind Curve) is providing dynamic support. This curve intersects with the lower boundary of the rising channel—creating a confluence zone, which is likely to act as strong short-term support or the base of a reversal.
Major BOS (Break of Structure):
A significant bullish BOS occurred earlier, confirming momentum strength. This previous break is acting as a reference point for bullish continuation scenarios.
📉 Bearish Scenario:
If the price breaks below the channel and mind curve support, this would invalidate the current bullish channel structure.
A clean breakout + retest below the support zone may invite strong selling pressure, targeting previous support zones around 1.1500 – 1.1350.
📈 Bullish Scenario:
If the price holds above the mind curve and continues upward, we may see a breakout above the top of the channel.
A confirmed breakout could send price toward the 1.1900 – 1.2000 resistance zone.
Patience is key—wait for a confirmed breakout from the channel (either side) before engaging.
⏳ Strategy Outlook:
✅ Wait for channel breakout confirmation (up or down)
⚠️ Watch for fakeouts or liquidity grabs near channel boundaries
🔁 Mind Curve Support adds another layer of decision-making structure
🧠 Trade with the trend, but remain adaptable to shift if channel breaks
🔍 Summary:
The EURUSD pair is in a decision-making zone—either we get a bullish continuation breakout, or the structure fails and we flip into a bearish correction. The confluence of the straight channel and mind curve makes this setup high-quality for both trend traders and breakout traders.
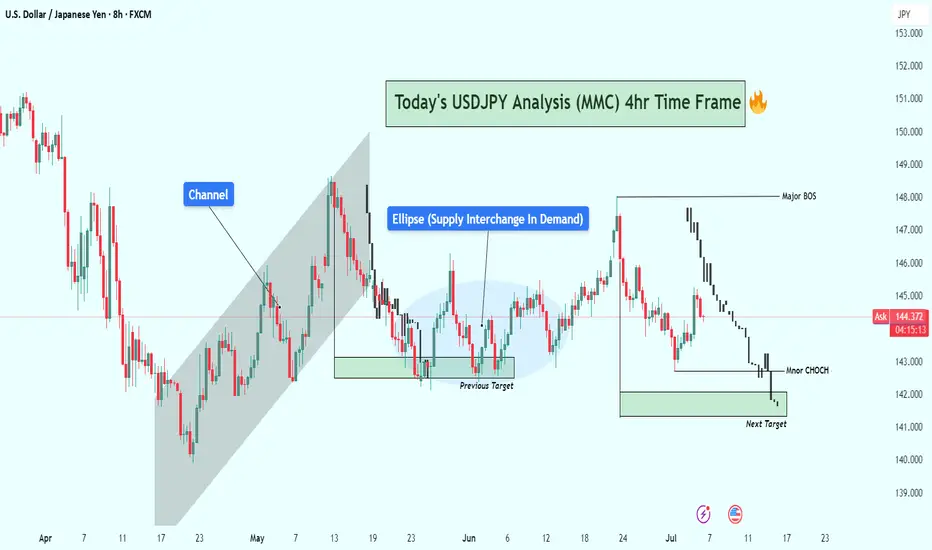
USDJPY 4-Hour Technical Analysis (Smart Money Concept Breakdown)📈 Overall Market Structure Overview:
The chart reflects a multi-phase Smart Money playbook, consisting of:
Bullish channel structure
Breakout followed by liquidity sweep
Supply zone flip to demand
Price mitigation and structure shift
Anticipated reaction zone for upcoming move
🔎 Phase-by-Phase Analysis:
🧱 1. Ascending Channel Formation
Price was moving upward in a controlled bullish ascending channel, suggesting institutional accumulation with planned distribution above highs.
The channel breakout was the first significant liquidity event, where early breakout traders were baited.
💧 2. Fakeout and Supply Interchange into Demand (Ellipse Zone)
Once the channel broke, price sharply reversed, retracing into a previous supply zone.
However, institutions defended this zone, flipping it into a demand area.
This behavior, marked with the blue ellipse, signals “Supply Interchange in Demand” – a core SMC concept.
Here, orders were absorbed
Liquidity was trapped below
A bullish push confirmed institutional intent
🎯 3. Previous Target Hit – Completion of Bullish Leg
Price made a strong rally from the demand zone, hitting the previous target near 147–148 zone.
This bullish leg created a Major Break of Structure (BOS) confirming bullish dominance at that phase.
⚠️ 4. Distribution Begins: Shift in Momentum
After reaching the Major BOS area, price failed to hold higher levels.
A decline followed, indicating distribution by smart money.
The reaction was sharp and consistent, creating lower highs, signaling weakness.
🔄 5. Minor CHoCH Formation – Early Reversal Signal
A Minor Change of Character (CHoCH) occurred around the 144.000–143.000 area.
This is a key transition, where smart money transitions from bullish intent to potential bearish delivery.
📦 6. Next Target Zone – Bullish POI (Point of Interest)
The chart identifies a next target demand zone around 141.800–141.200, marked in green.
This zone:
Holds unmitigated demand
Sits below a recent liquidity pool
Aligns with past support
This is where Smart Money could re-enter, offering a long opportunity if a bullish CHoCH or BOS forms from that zone.
📊 Trade Scenarios & Forecast:
🔻 Bearish Short-Term Play (Sell Setup):
If price respects current resistance (144.500–145), and a lower high forms:
Short entry opportunity
Target: 142.000–141.200 demand zone
Confirmation: Strong bearish candle, CHoCH below minor support
🔺 Bullish Reversal Play (Buy Setup):
At the demand zone:
Look for bullish reaction + CHoCH or BOS
Long entry potential
Target: Retest of 144.000 or even 147.000 if liquidity allows
🔐 Smart Money Tactics in Play:
Liquidity Engineering:
Price trapped both bulls (at highs) and bears (below ellipse zone)
Supply into Demand Flip:
A classic trap where supply becomes a launchpad for bullish delivery
Minor CHoCH:
Early signal of intent change
Next POI (Point of Interest):
Potential reaccumulation zone below major liquidity grab
🧠 Educational Takeaway:
This analysis illustrates:
Why breakouts are often traps without confirmation
How to identify real institutional zones
The role of CHoCH/BOS in planning ahead
Importance of waiting for price to come to your levels, not chasing
⚠️ Risk & Caution:
News catalysts can cause deviation from technical levels
Always use stop loss and proper risk management
SMC is about patience and precision, not prediction
✅ Summary:
USDJPY is showing early signs of a smart money distribution and a potential pullback toward demand.
Watch closely for confirmation at the key zone (141.800–141.200) before engaging long. Until then, short setups on rallies may be favorable.
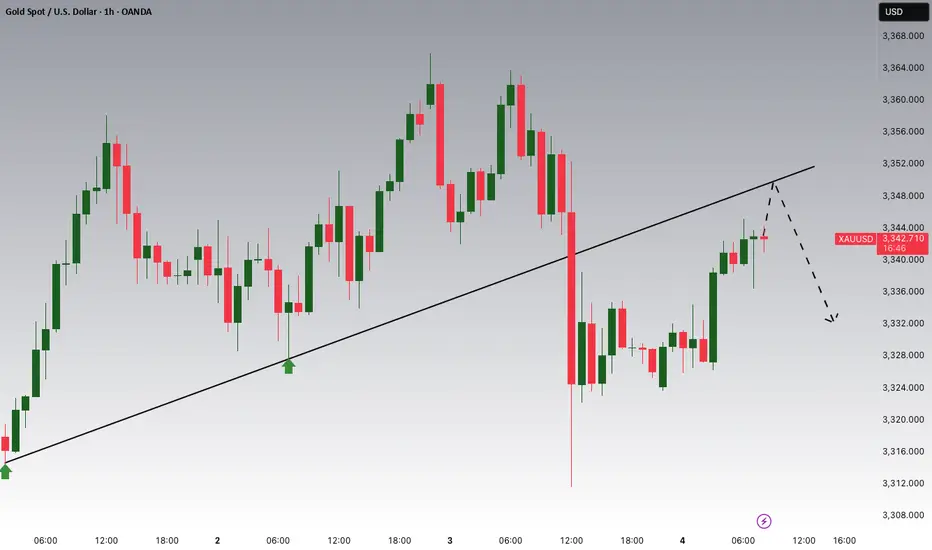
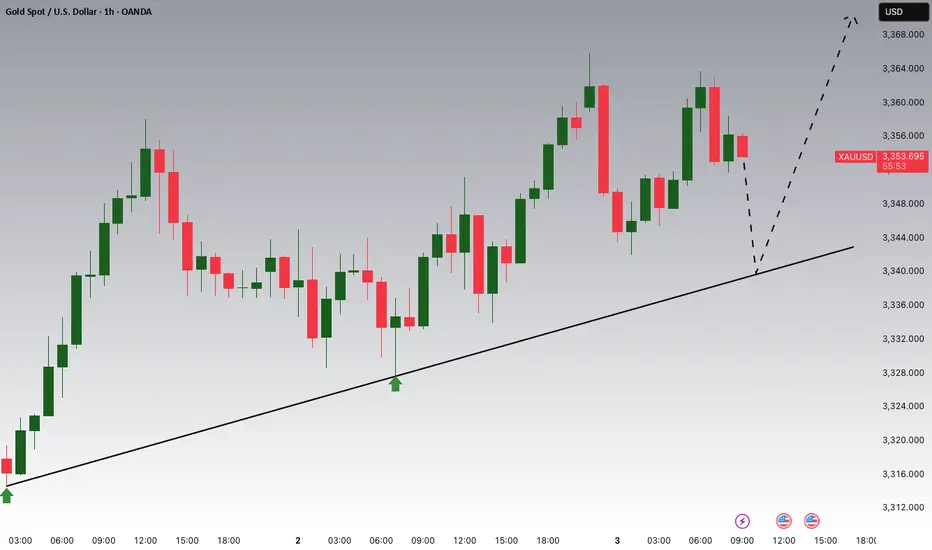
Gold Breakout and Potential RetraceHey Traders, in today's trading session we are monitoring XAUUSD for a selling opportunity around 3,350 zone, Gold was trading in an uptrend and successfully managed to break it out. Currently is in a correction phase in which it is approaching the retrace area at 3,350 support and resistance zone.
Trade safe, Joe.
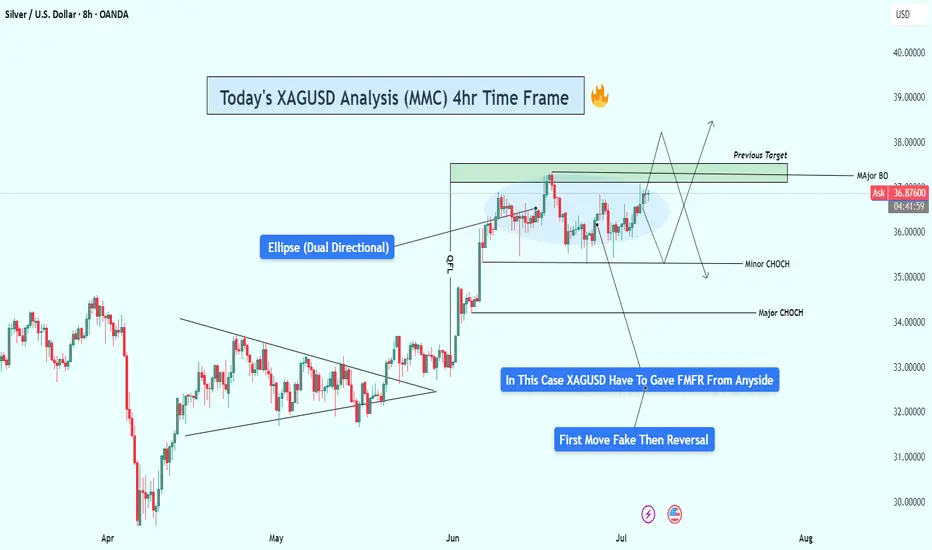
XAGUSD Analysis : Consolidation & FMFR Setup + Target🧭 Technical Overview:
Silver has had a strong bullish rally that started after the breakout of a long-term symmetrical triangle pattern. This breakout marked a Major Break of Structure (BOS) and shifted the overall market sentiment toward the bulls. Since then, price has been consolidating under a major resistance zone, forming a compression range, which is now shown as a blue elliptical zone in the chart.
This ellipse is not just a consolidation area — it represents a neutral compression zone where price can explode in either direction. The price action inside this area has been choppy and manipulative, sweeping both local highs and lows without real follow-through — a perfect environment for a Fake Move – then Reversal (FMFR) strategy.
🔍 Key Chart Components:
🔹 1. Ellipse (Dual Directional Zone)
This region shows indecision. Price is coiling inside, creating higher lows and lower highs — a volatility squeeze. A breakout from this ellipse is likely, but the first breakout move may be fake, followed by a quick reversal.
🔹 2. Major BOS (Break of Structure)
Price broke out of a long-term descending structure and pushed strongly upward, which marked a significant bullish shift. The pullback after that BOS was shallow — a sign of continued strength — but now we’re at a decision point.
🔹 3. Resistance Zone (Previous Target Area)
The price is now retesting a strong historical resistance around $37.00–$38.00, where we’ve seen rejections before. This is the liquidity zone where breakout traders enter long, but institutions may sweep them for liquidity before reversing.
🔹 4. Minor and Major CHoCH Levels
Minor CHoCH: Around $35.00–$35.50
Major CHoCH: Near $33.80–$34.00
These are reversal zones to watch if a fake move to the upside occurs and price rolls over.
📉 FMFR Setup Explained:
FMFR (First Move Fake Reversal) is a market behavior pattern where:
Price fakes a breakout in one direction (e.g., above resistance).
Attracts liquidity (traders’ orders).
Reverses rapidly in the opposite direction, trapping those who entered late.
In your chart, the blue notes say:
“In This Case, XAGUSD Have to Gave FMFR From Anyside”
“First Move Fake Then Reversal”
This highlights that no matter which direction the market initially breaks, it’s likely to reverse shortly afterward. This pattern is often seen before major moves when the market seeks to clear liquidity.
🔄 Scenarios to Watch:
🅰️ Bull Trap (Fake Breakout)
Price spikes above $37.80–$38.00.
Sweeps the highs and rejects sharply.
Reversal triggers below the ellipse, heading toward minor/major CHoCH.
🅱️ Bear Trap (Fake Breakdown)
Price dips below $35.00 (minor CHoCH).
Triggers panic sells.
Then rebounds quickly into the previous high zone or beyond.
⚙️ Trading Strategy Ideas:
Wait for Confirmation: Enter only after a confirmed breakout and retest OR a fakeout with reversal candles (e.g., engulfing, pin bar).
Use Tight Risk Management: Place stops outside sweep zones. This setup is volatile and can trap undisciplined trades.
Watch Volume & Wicks: Spikes with wicks and no close beyond the level usually confirm FMFR setups.
🔐 Key Levels to Watch:
Zone Price Level Action
Major Resistance $37.00–$38.00 Watch for fakeouts
Minor CHoCH ~$35.00–$35.50 Reversal entry zone
Major CHoCH ~$33.80 Last line of bullish defense
📝 Final Thoughts:
This is a textbook FMFR compression setup, where volatility is building inside a symmetrical price zone. The first aggressive move from this region is likely to be deceptive. Smart money traders look for trap setups, not the obvious direction. Silver is approaching a high-risk, high-reward decision zone, and staying patient will be key.
📊 Wait. Observe. React — don’t predict blindly.
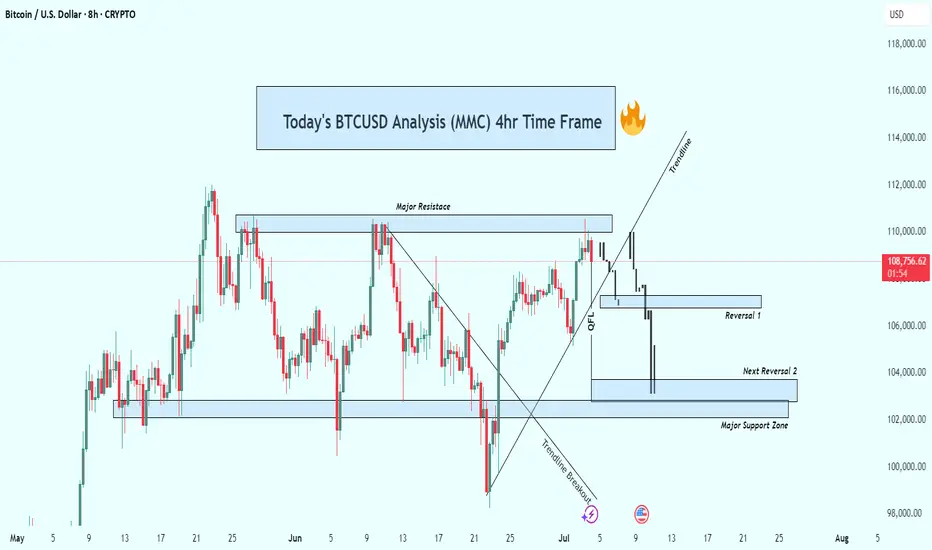
BTCUSD 4hr Technical Analysis : Rejects $110K - Next TargetsOverview:
Bitcoin is currently undergoing a significant technical correction after rejecting a strong resistance level. The 4-hour chart shows a decisive bearish breakdown, suggesting that the bulls are losing control and sellers are gaining momentum. As the price continues to fall, all eyes are now on the major support levels that could trigger a potential reversal—or further acceleration to the downside.
📊 Technical Breakdown:
1. Major Resistance Zone (~$110,000 – $111,000):
This zone has acted as a strong supply area, where price has repeatedly failed to break through. Multiple rejections from this zone confirm it as a key distribution area, where large sellers are stepping in. The repeated failure to close above it shows market exhaustion at the highs.
Multiple candle wicks and strong bearish closes around this area.
Bull traps occurred after brief moves above this resistance, followed by sharp sell-offs.
2. Trendline Breakout:
Previously, BTC had been respecting a rising ascending trendline, which served as dynamic support throughout the last rally. Recently, price broke below this trendline with strong bearish momentum.
This marks a break in market structure.
The trendline retest acted as resistance—textbook confirmation of the trend shift.
3. QFL (Quantity Following Line) Breakdown:
The QFL zone, typically a bullish defense level, has failed to hold. This breakdown confirmed that bulls lost a critical level of control.
Price briefly retested the QFL from below before continuing downward.
This zone now acts as resistance, reinforcing the bearish outlook.
🔻 Downside Targets & Reversal Zones:
✅ Reversal Zone 1 (~$106,000):
This minor support level provided minimal reaction and was quickly breached.
Lack of volume or candle confirmation suggests weak buying interest here.
✅ Next Reversal Zone 2 (~$104,000):
This zone has historical importance as a short-term demand area.
Monitor closely for bullish candlestick patterns, volume spikes, or bullish divergences to assess potential bounce scenarios.
✅ Major Support Zone (~$102,000 – $100,000):
This is the most critical level in the near term.
Historically, price has reversed strongly from this zone, indicating strong buyer interest.
If price breaks and closes below this level, expect a high-probability continuation towards the $98,000 psychological level or lower.
🧠 Market Psychology:
The breakdown from the trendline and QFL indicates panic or profit-taking.
Many late long positions are likely being liquidated.
Smart money may be waiting at the $100K zone to accumulate, depending on market conditions and macro factors.
🎯 Trading Strategy Ideas:
🛑 For Bears (Shorts):
Stay short below $110K resistance.
Trail stop-loss above QFL zone or trendline breakdown.
Look to take profit at $104K and $102K zones.
Add to positions on confirmed bearish retests of broken supports.
📈 For Bulls (Longs):
Wait for clear confirmation (e.g., bullish engulfing, double bottom, RSI divergence) near $104K or $102K before entering.
Avoid catching falling knives—patience is key.
Consider scaling in with smaller position sizes and tight stops.
Watch for a reclaim of the QFL zone or a strong bounce from the $100K psychological level.
🧭 Bias: Bearish
Structure: Lower highs & lower lows.
Momentum: Selling volume increasing, bulls losing steam.
Invalidation: A strong daily close above $111K would flip bias back to neutral/bullish.
🧩 Final Thoughts:
Bitcoin is currently in a fragile state as it retraces from a failed breakout. With multiple key support zones ahead, the next few sessions will be critical in determining whether bulls can reclaim control or if we see deeper downside movement. Watch for signs of exhaustion from sellers or fresh accumulation zones to position accordingly.
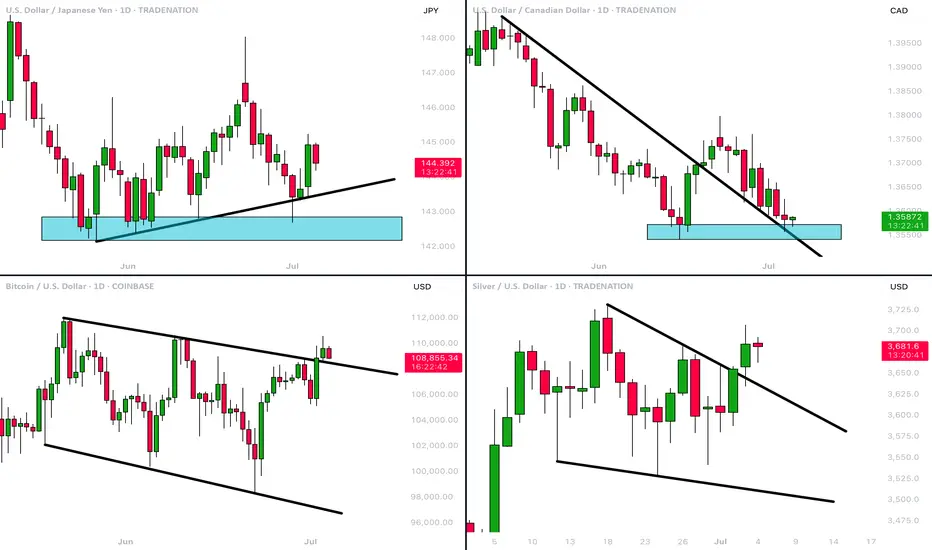
MarketBreakdown | USDJPY, USDCAD, BITCOIN, SILVER
Here are the updates & outlook for multiple instruments in my watch list.
1️⃣ #USDJPY daily time frame 🇺🇸🇯🇵
The market nicely respected a rising trend line
and bounced from that, forming a high momentum bullish candle.
I think that the pair will continue rising and reach 145.8 level soon.
2️⃣ #USDCAD daily time frame 🇺🇸🇨🇦
The price is currently approaching an important confluence
zone based on a falling trend line and a horizontal support.
I will expect a pullback from that.
3️⃣ #BITCOIN #BTCUSD daily time frame
The price successfully violated a resistance line of a bullish
flag pattern and closed above that.
It is a critical bullish signal. I believe that the price will test
a current high then and will violate that with a high probability.
4️⃣ #SILVER #XAGUSD daily time frame 🪙
The market broke a resistance line of a bullish flag.
Uptrend is going to continue, and the price is going to reach 37,14 level soon.
Do you agree with my market breakdown?
❤️Please, support my work with like, thank you!❤️
I am part of Trade Nation's Influencer program and receive a monthly fee for using their TradingView charts in my analysis.
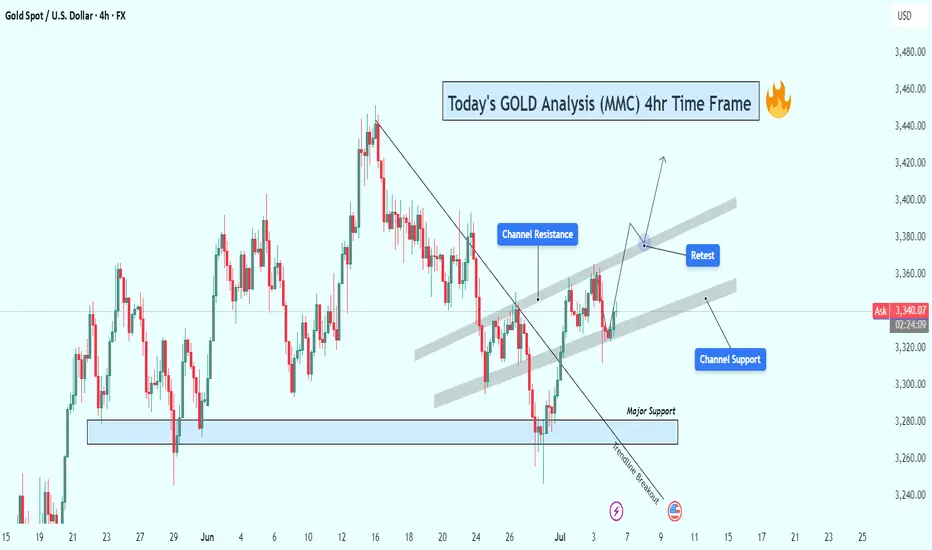
GOLD (XAUUSD) 4H Technical Analysis – Channel Breakout & Target🧠 Executive Summary:
The GOLD market has completed a key structural shift following a successful bearish trendline breakout, and is now trading within a well-formed ascending price channel. Price action has recently bounced from the channel support area, which aligns closely with a retested zone that was previously resistance. All signs now point to a potential continuation of the bullish leg—but only if the current structure holds.
This analysis outlines the technical foundation, key trading zones, price action psychology, and risk management factors that define this setup.
🔍 Technical Breakdown
🔸 1. Trendline Breakout – The Structural Shift
The bearish trendline, which previously capped multiple upside moves throughout June, has finally been broken.
The breakout was accompanied by higher volume and larger bullish candles, indicating momentum.
After the breakout, price pulled back near the trendline and respected the newly flipped support zone.
This forms a classic Breakout–Retest–Continuation pattern, one of the most reliable in trend reversal scenarios.
🔸 2. Formation of Ascending Channel – A New Bullish Structure
After the breakout, price action established a consistent pattern of higher highs and higher lows, confirming the birth of a new ascending channel.
The channel support (around 3,320–3,330) has been tested multiple times and held strong.
The channel resistance lies between 3,390–3,400, which is now the next short-term target if bulls maintain control.
The channel offers both trend direction and entry timing opportunities as price bounces between its boundaries.
🔸 3. Retest Zone – Buyer’s Territory
The price is currently bouncing off the mid-channel zone, where the previous downtrend resistance overlaps with current channel support.
This confluence area is where smart money often enters after institutional accumulation at the base (around 3,270).
The bullish wick rejections around this zone signal a likely continuation toward the upper channel.
📈 Price Behavior & Market Psychology
What’s happening here isn't just lines and candles—there’s a psychological story unfolding:
Fear drove the market lower, respecting the bearish trendline until late June.
Hope and buyer aggression surged once the breakout confirmed.
Now we’re in the "belief" phase, where traders await confirmation of the new trend.
Many are watching for entry confirmation at support zones, and as long as fear doesn’t return (i.e., price breaking below 3,320), the structure remains valid.
🧭 Key Technical Levels to Watch
Level Type Price Range Notes
Major Support Zone 3,270–3,285 Key buyer zone, invalidation of bullish case below this
Channel Support 3,320–3,330 Retest zone after breakout, current active level
Mid-Channel Area 3,350–3,360 Decision zone – price may build momentum here
Channel Resistance 3,390–3,400 First bullish target, potential breakout area
Breakout Target 3,420–3,440 If price breaks channel resistance with volume
🧮 Trade Setup Ideas (Educational – Not Financial Advice)
🟢 Long Setup Option 1:
Entry: Upon confirmation above 3,340–3,345 with bullish engulfing candle or breakout bar.
Stop-Loss: Below 3,320 or slightly below channel support.
Take Profit: Partial at 3,390 (channel top), full at 3,420–3,440 breakout zone.
R:R Ratio: 1:2.5+ (highly favorable)
🔴 Bearish Scenario (Risk Management)
If price closes below 3,320 with momentum, expect a revisit to the 3,270–3,285 support.
This invalidates the current bullish channel structure and might bring in short-term bearish pressure.
Avoid long positions until new structure is formed.
🧠 Educational Takeaway for Traders
This analysis highlights the importance of:
Structure-based entries: Instead of chasing candles, you wait for confluence and entry triggers.
Multiple timeframe confirmation: Higher timeframes also show bullish bias, giving confidence to 4H trades.
Risk management: The current setup allows tight stop losses relative to potential reward, making it attractive.
By combining trendline breakouts, channel formations, and support/resistance flips, you significantly increase the probability of a successful trade.
📌 Final Thoughts:
Gold is giving traders a clean and structured opportunity. The market has shown strength through structure, not just random price spikes. With the ascending channel intact and price respecting support zones, there is a solid foundation for a bullish continuation toward 3,400 and beyond.
But as always, confirmation is key. Wait for price action to validate your bias, and never ignore risk management.
MUKANDLTDMUKAND Daily Chart | CMP ₹152.78
Massive breakout with volume. Price holding above previous resistance ₹150.5.
Structure bullish
TP1 near ₹176.
SL below ₹137.
Trend: Strong Bullish

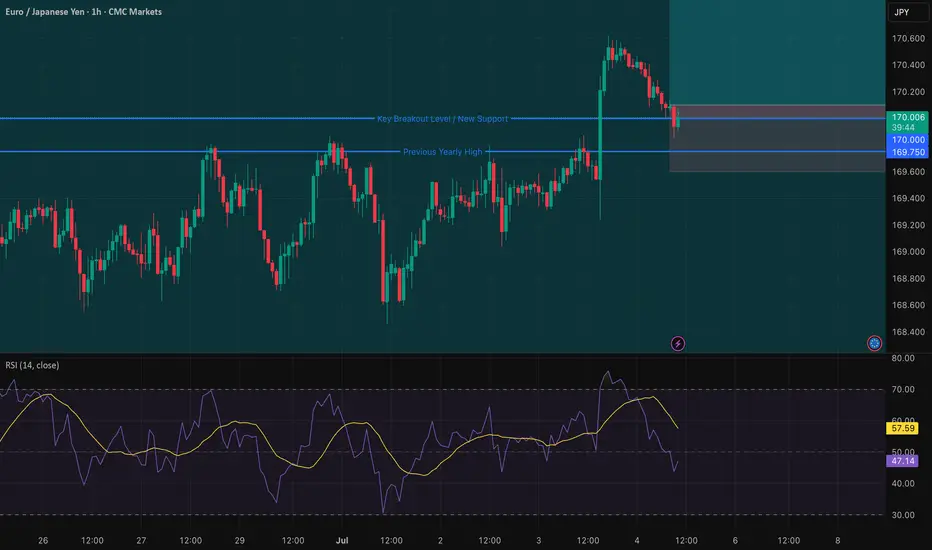
EUR/JPY: Bullish Setup on 170.00 Breakout & Dovish BoJWe've identified a compelling, high-conviction long trade setup on EUR/JPY, perfect for a limit order right now. This trade leverages a powerful combination of fundamental divergence and a confirmed technical breakout, setting the stage for quick execution and potential profit! 🎯💰
Fundamental Rationale: 🌍📊
Japanese Yen (JPY) Weakness: The JPY is under significant bearish pressure. 📉 The Bank of Japan's (BoJ) persistently dovish monetary policy, keeping interest rates at historic lows, creates a wide interest rate differential. This fuels "carry trades," where investors borrow low-yielding JPY to invest in higher-yielding currencies like the Euro, increasing JPY supply. Recent weak economic data, including a decline in Tokyo CPI, reinforces expectations that the BoJ will not hike rates in 2025. Additionally, a global "risk-on" sentiment diminishes the JPY's safe-haven appeal, leading to capital outflow and sustained Yen depreciation. 🐻📉
Euro (EUR) Stability: While the Euro isn't showing explosive bullish momentum, its relative stability provides a crucial counter-balance to the weakening Yen. 🇪🇺 The European Central Bank (ECB) is inclined to maintain its current policy, and recent Eurozone inflation data hasn't significantly altered expectations for further rate cuts in H2 2025. This steady footing, paired with the pronounced JPY weakness, creates a compelling bullish case for EUR/JPY. The Euro's role is to be a stable anchor against a fundamentally weak JPY, allowing the cross to climb. ⚖️
Technical Setup: 📊✨
Decisive Breakout Confirmed: EUR/JPY has achieved a powerful and decisive breakout above the critical psychological resistance of 170.00 and its previous yearly high of 169.75. This is a monumental technical event! Such a sustained move above key long-term barriers signals strong underlying buying pressure and confirms a "new trigger for the bulls," indicating a high probability of continued uptrend. 🚀⬆️
High-Probability Entry Strategy: Our entry strategy is designed for a quick and successful fill. Following the confirmed breakout, we anticipate a classic "breakout and retest" phenomenon, where price pulls back to retest the former resistance (now new support). By placing a limit order slightly below the current market price, at 170.10, we aim to catch this anticipated pullback, securing an optimal entry with a tighter risk profile. 🔄🎯
Clear Resistance Target: Our single Take Profit target is strategically set at 170.90, just below the next significant resistance: the 78.6% Fibonacci retracement level at 170.93. This level, derived from a previous long-term decline, represents a key area where price might encounter resistance. Targeting slightly below it increases the probability of the TP being hit before any potential reversal. 🎯✅
Trade Parameters: 📋✨
Currency Pair: EUR/JPY 💶🇯🇵
Direction: Long (Buy) ⬆️
Entry (Limit Order): 170.10
Take Profit (TP): 170.90
Stop Loss (SL): 169.60
Risk-Reward Ratio: 1.6:1 (A favorable ratio for a high-probability setup!) ✅
#NIFTY Intraday Support and Resistance Levels - 04/07/2025Nifty is expected to open with a gap-up near the 25500 zone. This places it right around the consolidation zone seen in the previous sessions, between 25400 and 25550. If Nifty sustains above 25550, it may trigger a fresh upward move with immediate targets at 25600, 25650, and potentially 25750+. This breakout level should be watched closely for bullish confirmation before entering long positions.
However, if the index fails to hold above the consolidation zone and slips below 25400, it could open the door for a downside move. A short opportunity may arise below 25400, targeting levels at 25350, 25300, and 25250. This would indicate a breakdown from the consolidation and suggest renewed selling pressure.
Traders should remain cautious within the consolidation range and act only on confirmed breakout or breakdown levels.

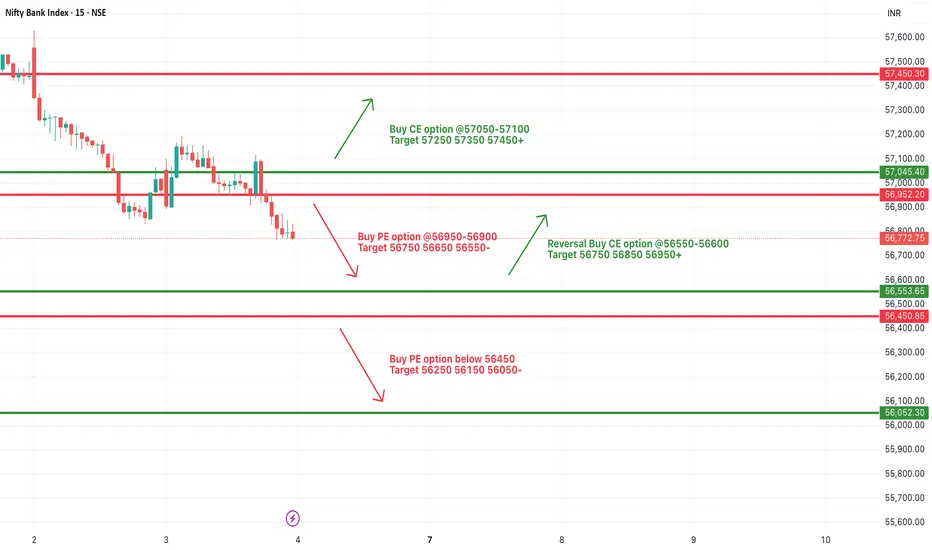
[INTRADAY] #BANKNIFTY PE & CE Levels(04/07/2025)Bank Nifty will open with a gap-up near the 56950 zone, placing it close to an immediate resistance area. If the index sustains above the 57050–57100 level, it indicates bullish strength and could trigger a further upward move toward 57250, 57350, and potentially 57450+. This level acts as a breakout zone for upside momentum. On the other hand, if the price faces resistance around 56950–57000 and starts reversing, a short opportunity opens below 56950–56900, with targets placed at 56750, 56650, and 56550.
In case Bank Nifty falls further and breaches the 56450 mark, it may signal a strong breakdown and continuation of the downtrend, leading to lower targets around 56250, 56150, and 56050. However, if the index takes support at the 56650–56600 zone and shows signs of reversal, it can provide a buying opportunity for a bounce back toward 56750, 56850, and 56950.
Overall, the day’s strategy should be reactive to these key levels, with trades initiated only upon proper price action confirmation. Use trailing stop-loss to protect profits and exit partially at key target levels.
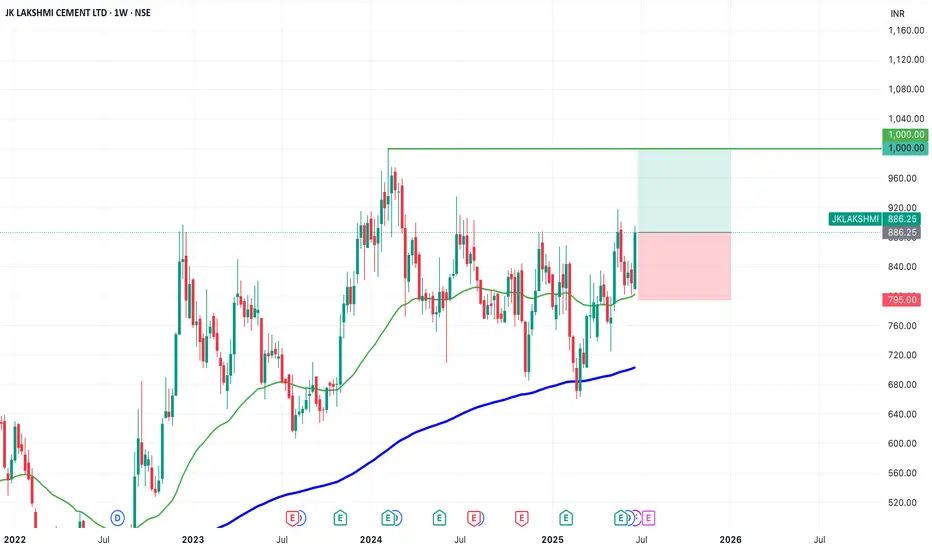
SWING IDEA - JK LAKSHMI CEMENT JK Lakshmi Cement , a key player in India’s cement sector under the JK Group showing strong technical confluence making this a swing-worthy setup.
Reasons are listed below :
Formation of a bullish engulfing candle on the weekly chart, indicating a potential trend reversal
Strong support from the 50-week EMA , reinforcing medium-term trend strength
Breakout from a consolidation range that lasted over a year, suggesting renewed momentum
Inverse Head & Shoulders breakout , a classic bullish pattern
Target - 1000
Stoploss - weekly close below 795
DISCLAIMER -
Decisions to buy, sell, hold or trade in securities, commodities and other investments involve risk and are best made based on the advice of qualified financial professionals. Any trading in securities or other investments involves a risk of substantial losses. The practice of "Day Trading" involves particularly high risks and can cause you to lose substantial sums of money. Before undertaking any trading program, you should consult a qualified financial professional. Please consider carefully whether such trading is suitable for you in light of your financial condition and ability to bear financial risks. Under no circumstances shall we be liable for any loss or damage you or anyone else incurs as a result of any trading or investment activity that you or anyone else engages in based on any information or material you receive through TradingView or our services.
@visionary.growth.insights
EUR/USD: A Perfect Storm for BullsThis is a high-conviction long setup based on a powerful combination of macroeconomic divergence and a confirmed multi-year technical breakout.
The Non-Farm Payrolls report has now been released, and the resulting price dip has created what I believe is an ideal entry opportunity to align with the dominant bullish trend.
The Fundamental Why 📰
NFP Aftermath: Yesterday's NFP report was a mixed bag that ultimately reinforces the case for Fed rate cuts. The headline number beat expectations, causing an initial USD rally and a dip in EUR/USD. However, the underlying details like wage growth were soft. Crucially, the market continues to price in a 96% probability of a Fed rate cut by September, a figure that was unchanged by the data. The core driver of USD weakness—a dovish Fed—remains firmly intact.
Resilient EUR 🇪🇺: In contrast, the ECB has signaled it is at or near the end of its easing cycle. Economic data from core Eurozone countries is stabilizing, providing the Euro with relative strength.
Risk-On Sentiment 💹: The broader market remains in a "risk-on" mood, which is typically negative for the safe-haven USD. Gold is soaring and equities are near all-time highs, confirming the anti-dollar flow.
The Technical Picture 📊
The Secular Breakout 🚀: The most significant event is the breakout of a decade-long downtrend resistance line. This is a major structural shift. The pair has also achieved a monthly and quarterly close above the critical 1.1500 handle, turning a historic resistance level into a new support floor.
The Impulsive Uptrend 🌊: On the 4-hour chart, the price is in a clear ascending channel. The post-NFP dip represents a healthy correction within this uptrend, bringing price back toward key support.
Key Levels 🔑:
Support Zone: The dip has brought price directly into the key support confluence between 1.1700 and 1.1760, making this an ideal area to enter long.
Resistance Zone: Major resistance still sits at 1.1900, making it a prudent take-profit target.
Strategy & Risk Management 🧠
The stronger-than-expected NFP headline has provided the exact pullback this strategy was designed for. The dip presents a prime opportunity to buy into the dominant uptrend at a more favorable price. Instead of chasing the market, we are now positioned to enter on a technically sound correction.
Good luck, and trade safe!
Trade Parameters ✅
Pair: EUR/USD
Direction: Long / Buy 🟢
Entry Type: Limit Order
Entry Price: 1.1745
Stop-Loss: 1.1685 (60 pips) 🔴
Take-Profit: 1.1895 (150 pips) 🎯
Risk/Reward Ratio: 2.5 : 1

Gold is Nearing an Important Support AreaHey Traders, in today's trading session we are monitoring XAUUSD for a buying opportunity around 3,340 zone, Gold is trading in an uptrend and currently is in a correction phase in which it is approaching the trend at 3,340 support and resistance area.
Trade safe, Joe.
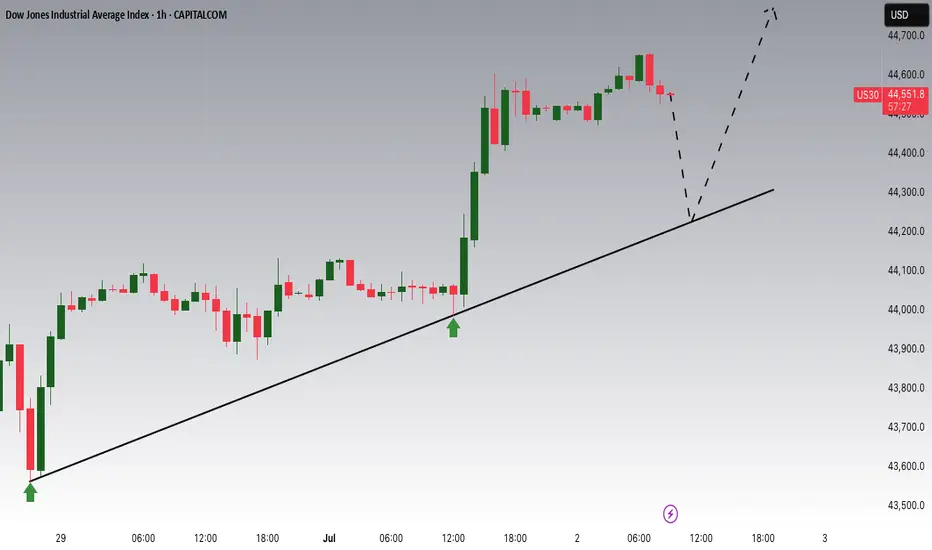
US30 Potential UpsidesHey Traders, in today's trading session we are monitoring US30 for a buying opportunity around 44,230 zone, Dow Jones is trading in an uptrend and currently is in a correction phase in which it is approaching the trend at 44,230 support and resistance area.
Trade safe, Joe.
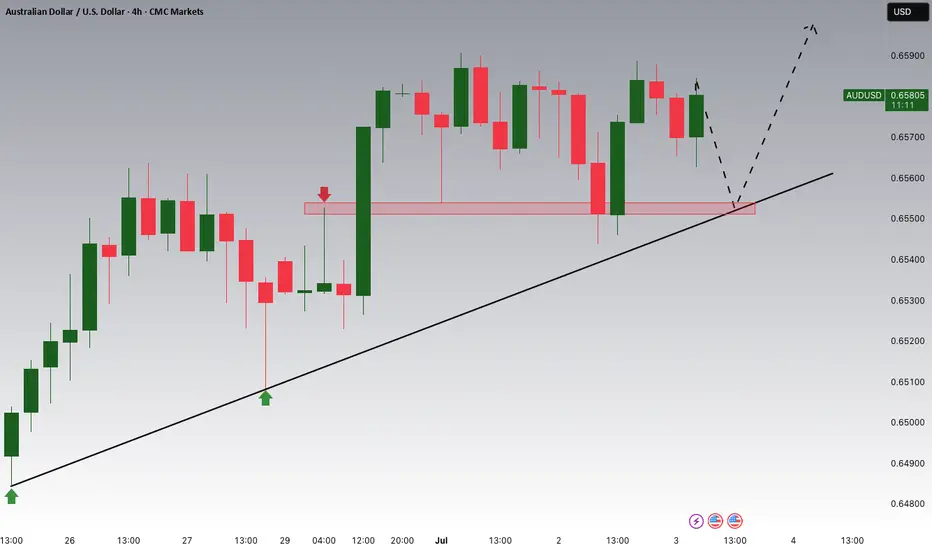
AUDUSD Potential UpsidesHey Traders, in today's trading session we are monitoring AUDUSD for a buying opportunity around 0.65500 zone, AUDUSD is trading in an uptrend and currently is in a correction phase in which it is approaching the trend at 0.65500 support and resistance area.
Trade safe, Joe.
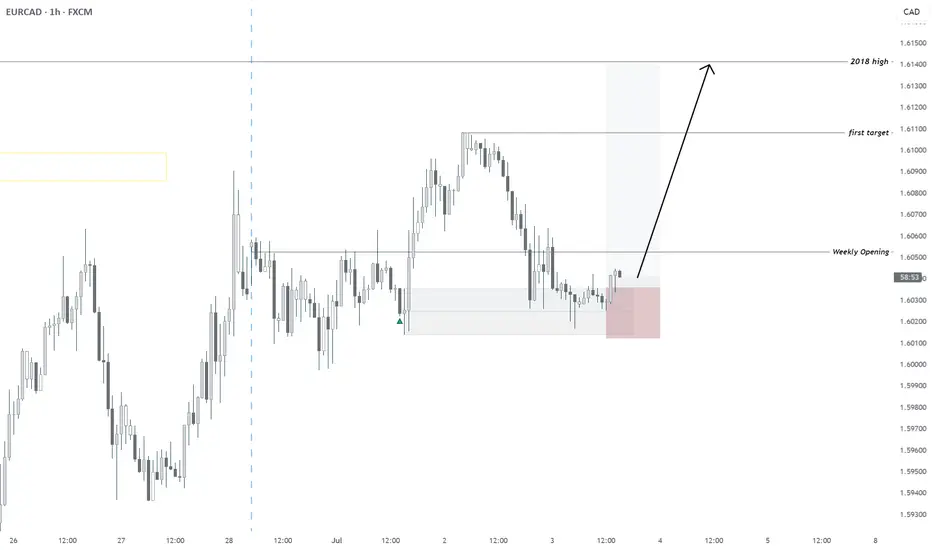
07/02/2025 | EURCAD | BULLISH - REACHING MULTI-YEAR HIGHDaily FX Outlook today:
All timeframes Bullish
Invalidation: 1.60055
First TP: on chart
Second: 2018 High
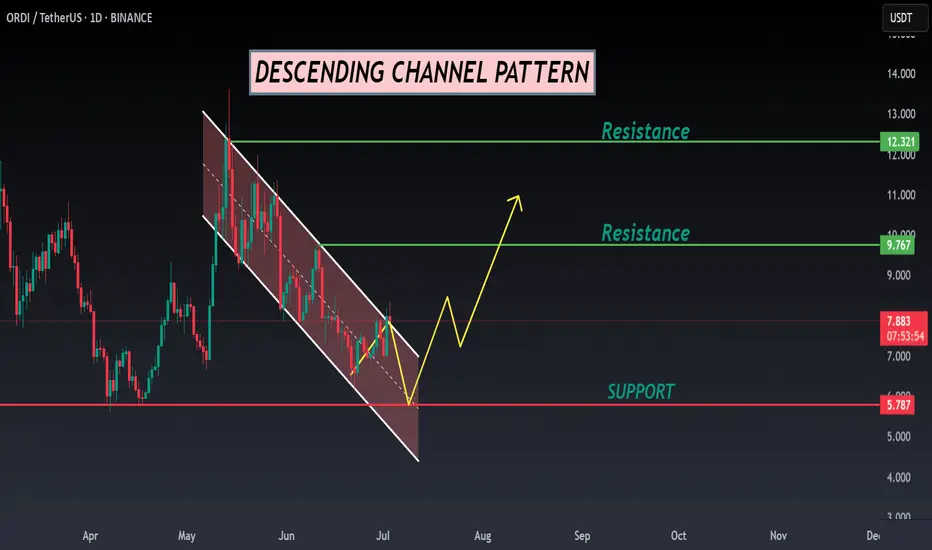
ORDI ANALYSIS📊 #ORDI Analysis
✅There is a formation of Descending Channel Pattern in daily time frame.
After a breakout of the pattern we would see a bullish momentum and can Target for $9.5 in few weeks🧐
👀Current Price: $7.890
🎯 Target Price : $9.500
⚡️What to do ?
👀Keep an eye on #ORDI price action and volume. We can trade according to the chart and make some profits⚡️⚡️
#ORDI #Cryptocurrency #Breakout #TechnicalAnalysis #DYOR
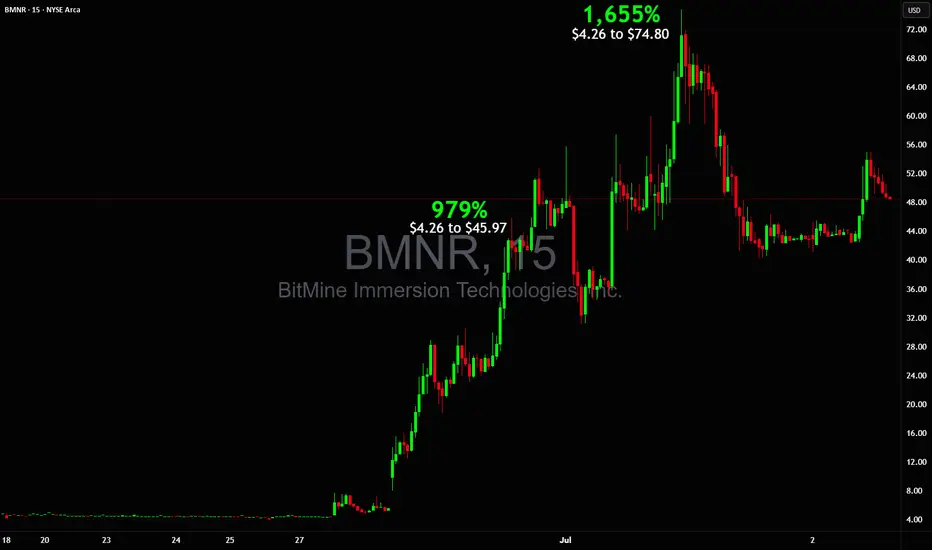
WOW $4 to $74 Big 1,655% in just 2 daysGet ready for new power runners to emerge from this AMEX:BMNR move
Gold Ready to Explode Ahead of NFP and Trump’s “Super Bill”?Gold Ready to Explode Ahead of NFP and Trump’s “Super Bill”? | Global Macro Focus
🌍 MACRO UPDATE – What the World is Watching:
Gold continues its bullish trajectory as the USD weakens sharply following last night’s disappointing ADP jobs report (-33K vs expected +99K). This soft labour data has fueled further speculation that the Fed could begin rate cuts as early as September, with a 90% probability now being priced in.
In the political arena, Donald Trump’s recent statement that House Republicans are aligned to push forward a so-called “Super Bill” has triggered fresh uncertainty around US fiscal policy. This could elevate safe-haven demand for gold, especially if it leads to increased tensions over debt ceilings or government spending.
With the US Non-Farm Payrolls (NFP) due later today and the UK and US markets heading into a long weekend, traders should brace for heightened volatility and liquidity gaps.
📈 TECHNICAL OUTLOOK – What the Charts Are Saying:
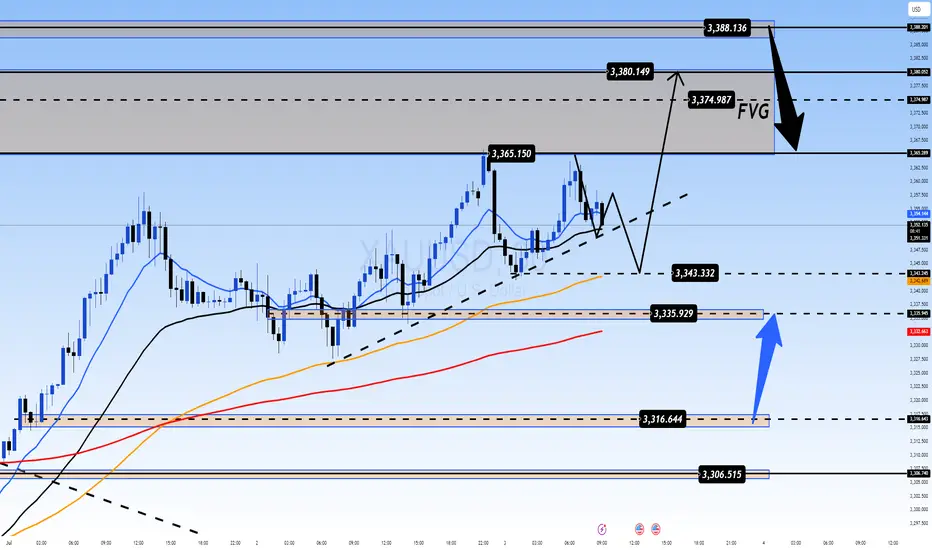
Overall Trend: Bullish structure remains intact as gold breaks and holds above 3365.
EMA Setup: Price trades above EMA 13/34/89/200 – signaling strong upside momentum.
Fair Value Gap (FVG): 3374 – 3388 area remains an unfilled FVG zone; possible magnet for short-term price action.
Key Resistance Levels: 3365, 3374, 3380, 3388, 3393
Key Support Levels: 3343, 3335, 3325, 3316, 3304
Trendline & Structure: The ascending trendline from 3316 remains unbroken, providing a potential bounce point if price corrects.
🎯 TRADE SETUPS – Strategic Zones to Watch:
🔵 Buy (Short-Term Scalp):
Entry: 3335 – 3333
SL: 3329
TP: 3340 → 3350 → 3360 → 3370
🟢 Buy Zone (Swing Perspective):
Entry: 3316 – 3314
SL: 3310
TP: 3320 → 3336 → 3350 → 3360
🔴 Sell Scalp (Reversal Zone)
Entry: 3374 – 3376
SL: 3380
TP: 3370 → 3360 → 3350
⚠️ Sell Zone (High-Risk Rejection):
Entry: 3388 – 3390
SL: 3394
TP: 3380 → 3370 → 3360
🔎 NOTE FOR GLOBAL TRADERS:
With UK markets partially closed and US session shortened ahead of the Independence Day holiday, liquidity may be thin and volatility could spike unexpectedly. Always place stop-loss and avoid emotional entries near key resistance.
💬 Do you believe gold can break and close above the FVG zone (3388) before the weekend volatility hits full throttle? Let’s discuss.
XAUUSD $3500 Recovery? Reverse Heads and Shoulders? 🔎 STRUCTURE & TECHNICAL ELEMENTS
1. Pattern:
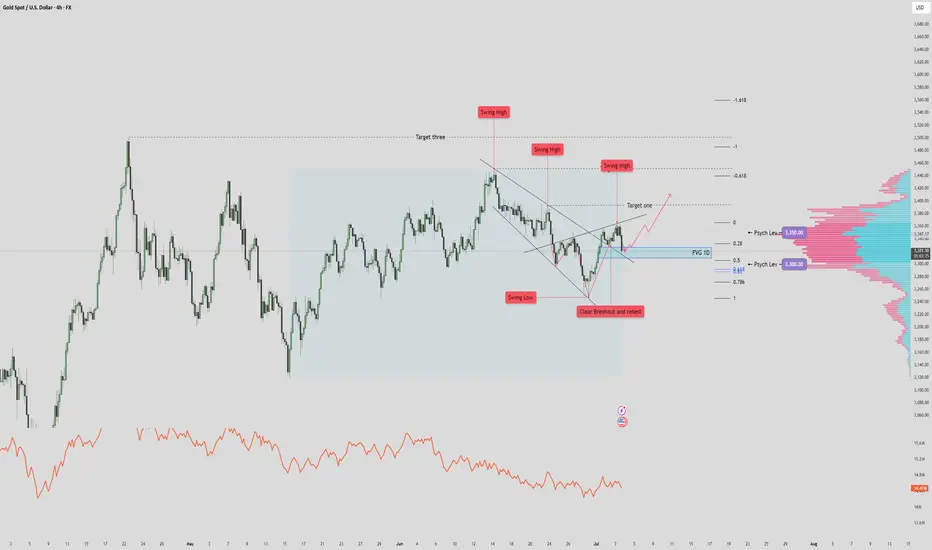
A falling wedge was formed and broken cleanly to the upside → bullish reversal structure.
Breakout was followed by a successful retest at prior structure lows (marked “Clear Breakout and Retest”).
2. Fair Value Gap (FVG 1D) Zone:
Currently being tested. This zone coincides with:
Minor support from prior consolidation
Fib retracement (0.5 level)
Potential demand area (watch for bullish reaction/candle structure here)
3. Volume Profile:
3,350 = POC (Point of Control) → heavy resistance.
3,300 = Secondary HVN → strong support below current price.
Low-volume nodes just under current price → if broken, price likely accelerates into the GP zone.
4. Fibonacci & Liquidity Confluence:
Golden Pocket (3287) just below 3,300 = ideal liquidity draw if FVG fails.
Target 1 / 2 / 3 above are Fibonacci-based projections + historical swing zones.
✅ SCENARIO 1: Bullish Case – FVG Holds
If price respects the FVG 1D zone, expect:
Continuation up toward Target One (~3,430)
Extension to Target Two (~3,470) and even Target Three (~3,540+) possible
Confirmation: Bullish engulfing / high-volume bounce / sweep of intraday lows without close below FVG
Bias: Bullish continuation as long as price holds above FVG/0.5 Fib
🚨 SCENARIO 2: Bearish Case – FVG Breaks Down
If price closes below FVG zone, particularly below 3,312:
High probability drop toward 3,300 (psych level)
Liquidity sweep and deeper correction into Golden Pocket (~3,287) likely
This area can act as a high-probability long re-entry zone
Bias: Short-term bearish if close below FVG + swing structure invalidation
⚖️ REFINED SUMMARY
Price rejects off FVG - we can expect target 1 and 2 tagged.
Price breaks & closes below FVG zone - we can expect it to drop/wick to 3,300
GBPUSD politics and the upcoming NFPFX_IDC:GBPUSD trading was influenced by politics in UK. The pair recovered half of the losses, but the downside risk still remains. NFP could be a trigger. Let's dig in.
MARKETSCOM:GBPUSD
Let us know what you think in the comments below.
Thank you.
77.3% of retail investor accounts lose money when trading CFDs with this provider. You should consider whether you understand how CFDs work and whether you can afford to take the high risk of losing your money. Past performance is not necessarily indicative of future results. The value of investments may fall as well as rise and the investor may not get back the amount initially invested. This content is not intended for nor applicable to residents of the UK. Cryptocurrency CFDs and spread bets are restricted in the UK for all retail clients.
