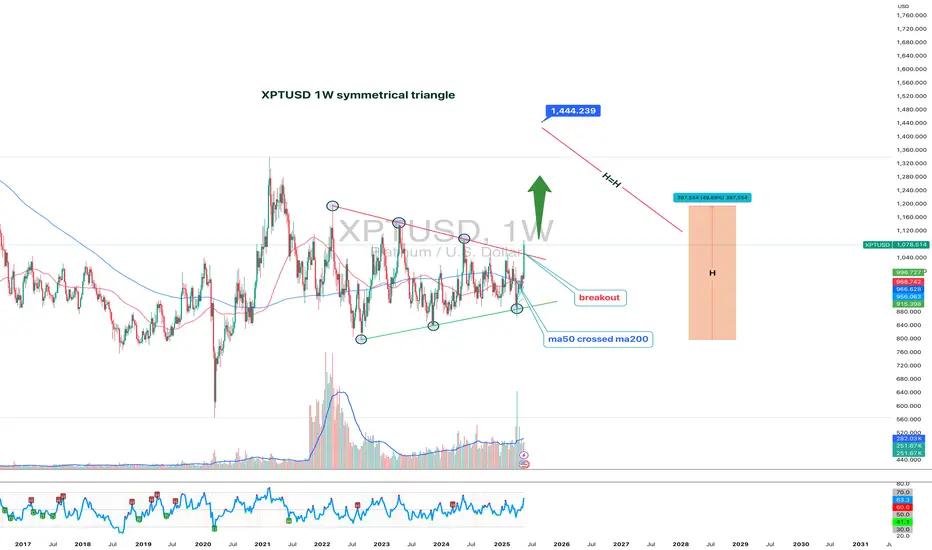
XPTUSD 1W:While Everyone Watches Gold, Platinum Quietly Wakes UpGold gets the headlines — but platinum just broke two years of silence with a clean, high-volume breakout from a symmetrical triangle on the weekly chart. And this isn’t noise — this is the structural shift traders wait for.
Price has been coiled inside a compressing wedge since early 2022. Equal highs. Equal lows. Stop hunts both ways. The classic “shake out before take off.” Now? The breakout is in. And the weekly candle closed above resistance with volume confirmation. Oh, and while we're at it — the 50MA just crossed above the 200MA, signaling a long-term trend reversal.
Target? Measure the triangle height: ~398 points. That projects a breakout target of 1440 USD, which aligns perfectly with previous institutional rejection zones.
But this isn’t just about the chart.
🔹 South Africa, the top global supplier, is struggling with energy and production cuts;
🔹 The Fed is pausing rate hikes — the dollar weakens, metals rally;
🔹 Demand from hydrogen tech, clean energy, and industrial catalysts is on the rise.
Translation? Smart money has been accumulating. The move from 965–1070 was just the ignition. The drive hasn’t started yet.
So while everyone fights over gold highs, platinum sits at the base of a move no one's prepared for — except those who know how accumulation ends.
🧭 Key support: 965–985
📍 Resistance zone: 1150–1180
🎯 Measured target: 1440+
Technical Analysis
XAUUSD: Gold's Muted Ascent Below $3350 XAUUSD: Gold's Muted Ascent Below $3350 – Navigating Key Levels Amidst USD Weakness!
Hello TradingView Community!
Let's delve into the intricate world of Gold (XAUUSD) today. The yellow metal is showing a subtle positive bias, largely influenced by a weaker US Dollar, yet a decisive bullish breakout above the $3350 mark remains elusive.
🌍 Macroeconomic Landscape: Forces Shaping Gold's Path
Gold has maintained a slight positive stance for the second consecutive day, but it's struggling to find significant follow-through, staying below the $3350 level in early European trading.
USD Under Pressure – A Tailwind for Gold: The primary driver for Gold's recent strength is the weakening US Dollar. Reports suggesting President Trump is considering replacing Fed Governor Jerome Powell have sparked concerns about the US central bank's future independence. This speculation has fueled market expectations for further Fed rate cuts this year, pushing the USD to its lowest point since March 2022, thereby providing support for non-yielding assets like Gold.
Cautious Outlook Prevails: Despite USD weakness, a definitive bullish trend for Gold is not yet confirmed. The ongoing ceasefire between Israel and Iran holds firm, with prevailing optimism limiting significant safe-haven rallies. This complex environment necessitates caution before confirming a definitive bottom for Gold or positioning for a substantial recovery from levels below $3300.
Key Data Ahead: Traders are keenly awaiting upcoming US macroeconomic data and speeches from FOMC members. These insights will be crucial in influencing XAU/USD, particularly ahead of Friday's pivotal US Personal Consumption Expenditures (PCE) Price Index release.
📊 XAUUSD Technical Outlook: Pinpointing Strategic Zones
Based on recent technical analysis (referencing image_e9d325.png for key levels), Gold is in a consolidation phase after a recent sharp decline, trading around the $329X mark. Price action below shorter-term moving averages suggests either lingering bearish pressure or an accumulation phase.
Strong Support Zones (Potential Buy Areas): Critical demand areas are identified around 3294.414, 3276.122, and notably 3264.400. These levels are crucial for potential price bounces.
Key Resistance Zones (Potential Sell Areas): Significant supply zones are found at 3313.737, 3321.466, 3330.483, and 3341.947. These are points where selling pressure may emerge.
🎯 XAUUSD Trading Plan: Your Actionable Strategy
Here's a breakdown of the strategic entry and exit points for your XAUUSD trades:
BUY ZONE (Strong Support - Long-Term Bias):
Entry: 3266 - 3264
SL: 3270
TP: 3280 - 3284 - 3290 - 3295 - 3300 - 3305 - 3310 - 3320
BUY SCALP (Quick Buy at Intermediate Support):
Entry: 3284 - 3282
SL: 3278
TP: 3288 - 3292 - 3296 - 3300 - 3305 - 3310 - 3320 - 3330
SELL ZONE (Key Resistance):
Entry: 3331 - 3333
SL: 3337
TP: 3326 - 3320 - 3316 - 3310 - 3305 - 3300
SELL SCALP (Quick Sell at Near Resistance):
Entry: 3313 - 3315
SL: 3320
TP: 3310 - 3305 - 3300 - 3295 - 3290 - 3280
⚠️ Key Factors to Monitor Closely:
US Macro Data: Friday's US Personal Consumption Expenditures (PCE) Price Index is paramount for market direction.
FOMC Member Speeches: Any official comments on monetary policy or inflation outlook will significantly impact USD and Gold.
Geopolitical Stability: Developments related to the Israel-Iran ceasefire can influence safe-haven demand.

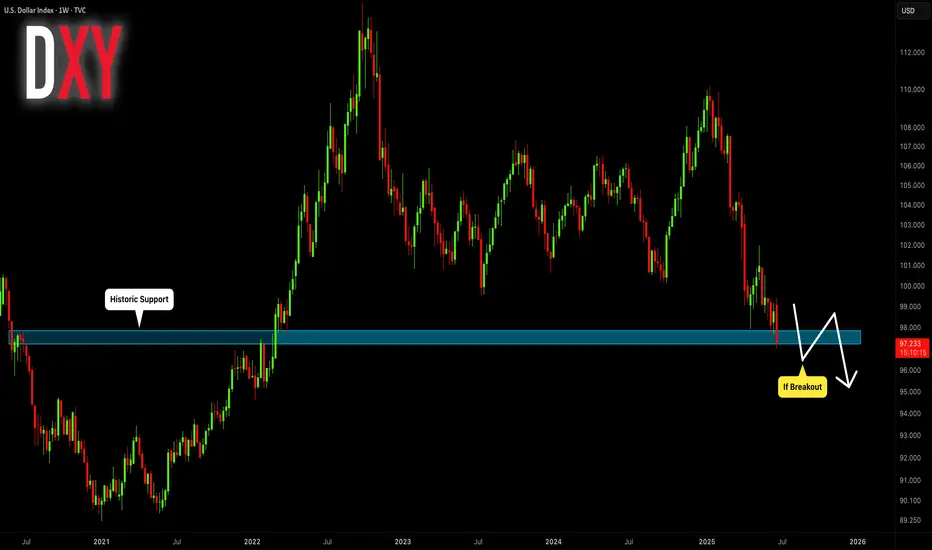
DOLLAR INDEX (DXY): Critical Moment
With an unprecedented pace of weakness of US Dollar,
DXY Index is now testing a historic weekly support cluster.
If the market breaks it today and closes below that, it will
open a potential for much more depreciation.
Next historic support will be 95.5 and a downtrend will continue.
Today's US fundamentals can be a trigger.
Please, support my work with like, thank you!
GRAB — Breakout Confirmation and Strong Upside PotentialGrab Holdings (GRAB) is currently forming a promising technical setup supported by a breakout from long-term consolidation. After printing a strong low and breaking out of a multi-year range, the price action confirms a bullish reversal with clear structure.
Technical Analysis
– Trendline breakout and bullish market structure shift
– Price is consolidating above the breakout level, forming a continuation zone
– Valid entries: market execution above $4.50 or limit orders near $4.00 support
– First profit target: $6.60 (around 40% growth)
– Second target: $10.15 (over 100% from entry)
The setup suggests increasing bullish momentum. A clean consolidation above previous resistance strengthens the case for a breakout continuation toward $6.60 and potentially $10.15.
Fundamental Backdrop
Grab is a Southeast Asian tech leader operating across ride-hailing, food delivery, and digital payments. The company continues to reduce losses, improve margins, and expand its fintech arm. With rising digital adoption in the region and a shift toward profitability, GRAB is gaining investor attention. Its most recent earnings report showed improving revenue trends and narrowing net losses — a strong signal of long-term sustainability.
Conclusion
Grab Holdings presents a well-aligned opportunity from both a technical and fundamental perspective. With a clear structure, breakout confirmation, and fundamental turnaround, this setup fits both swing and midterm investment strategies. Risk management is still key — stops should be placed below consolidation lows or key structure levels.

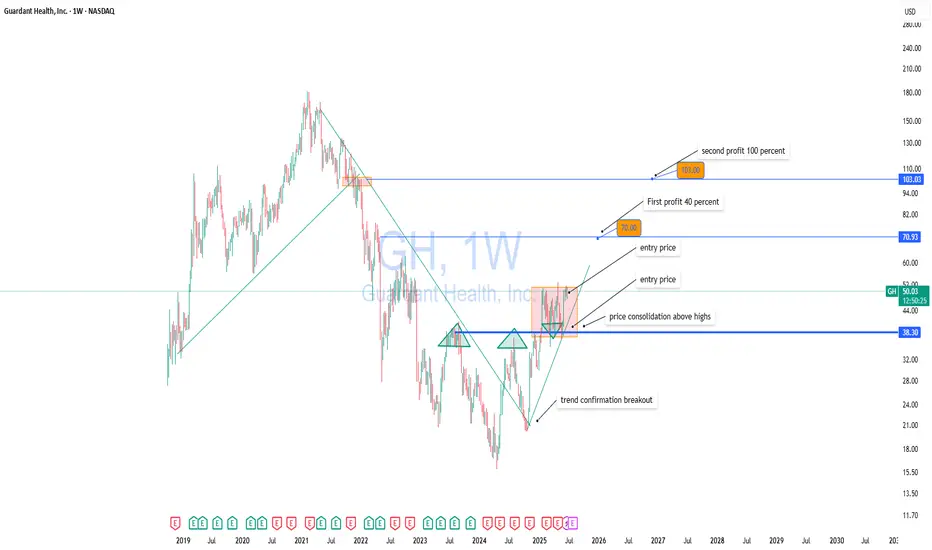
GH (Guardant Health) — Breakout Setup with Strong Upside PotentiGuardant Health (GH) is showing signs of completing a long-term accumulation phase and transitioning into a bullish trend. After breaking out of a major descending trendline and holding above key resistance at $38.30, the stock entered a tight consolidation range — a classic base formation before a potential breakout.
Technical Highlights:
– Confirmed trendline breakout
– Price is consolidating above previous highs
– Entry zone around $50–$51
– First target: $70 (+40%)
– Second target: $103 (+100% from current levels)
Fundamental Support:
Guardant Health is a leading precision oncology company specializing in liquid biopsy technologies for cancer screening and monitoring. The company continues to expand its product offerings, especially in early cancer detection — a market with huge long-term growth potential. Recent news includes positive developments in clinical trials and expanded partnerships, which could significantly boost revenue.
Institutional interest in GH has also been rising, with increased buying activity visible in the most recent 13F filings. The overall market sentiment toward biotech stocks with strong data pipelines is improving, which further supports the bullish outlook.
Conclusion:
GH is a strong candidate for medium- to long-term growth. The technical setup aligns with a fundamental narrative of innovation and market expansion. Partial profit-taking could be considered at $70 and $103. Due to the volatility of biotech stocks, proper risk management and position sizing are essential.
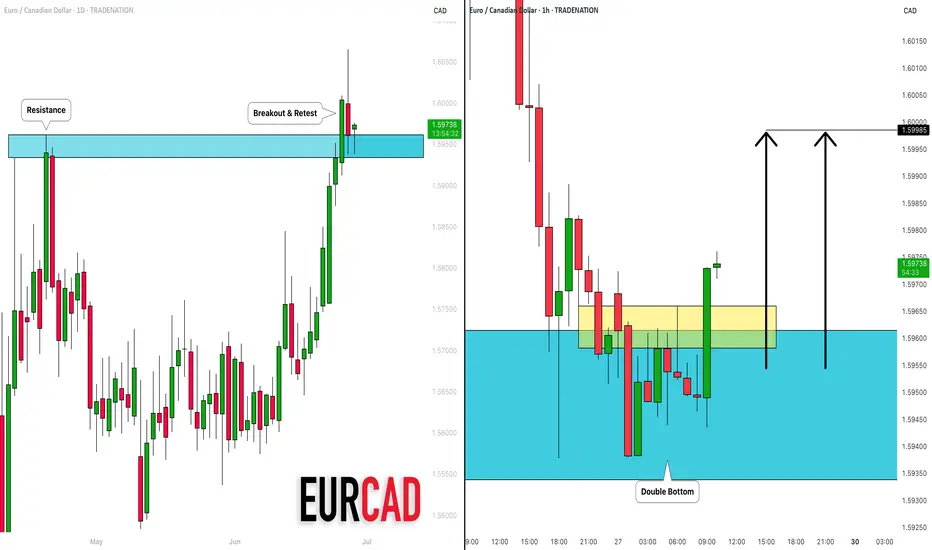
EURCAD: Pullback Trade From Support 🇪🇺🇨🇦
EURCAD is going to bounce from a recently broken
key daily horizontal resistance that turned into support after a violation.
The price violated a neckline of a double bottom pattern with
a bullish imbalance candle on an hourly time frame as a confirmation.
Goal - 1.5998
I am part of Trade Nation's Influencer program and receive a monthly fee for using their TradingView charts in my analysis.
DOW JONES INDEX (US30): Consolidation is Over
Dow Jones Index completed a bullish accumulation on a daily.
The price violated a key horizontal resistance cluster and closed above that.
Next goal for bulls is 43790.
❤️Please, support my work with like, thank you!❤️
I am part of Trade Nation's Influencer program and receive a monthly fee for using their TradingView charts in my analysis.

#NIFTY Intraday Support and Resistance Levels - 27/06/2025Nifty is expected to open with a strong gap up near the 25,750 level, indicating bullish sentiment continuation from the previous sessions. If Nifty sustains above this 25,750 mark, it could trigger a breakout setup. In that case, long positions can be considered above 25,750 with targets placed at 25,850, 25,900, and 25,950+. This zone aligns with a potential resistance-turned-breakout level, and a move beyond it could bring in further momentum on the upside.
On the other hand, if Nifty fails to hold above the 25,750 level and shows signs of rejection, then it may consolidate or experience mild profit booking. Key intraday support lies near the 25,550–25,600 range. A break below this can drag the index down to 25,450 or even 25,250.

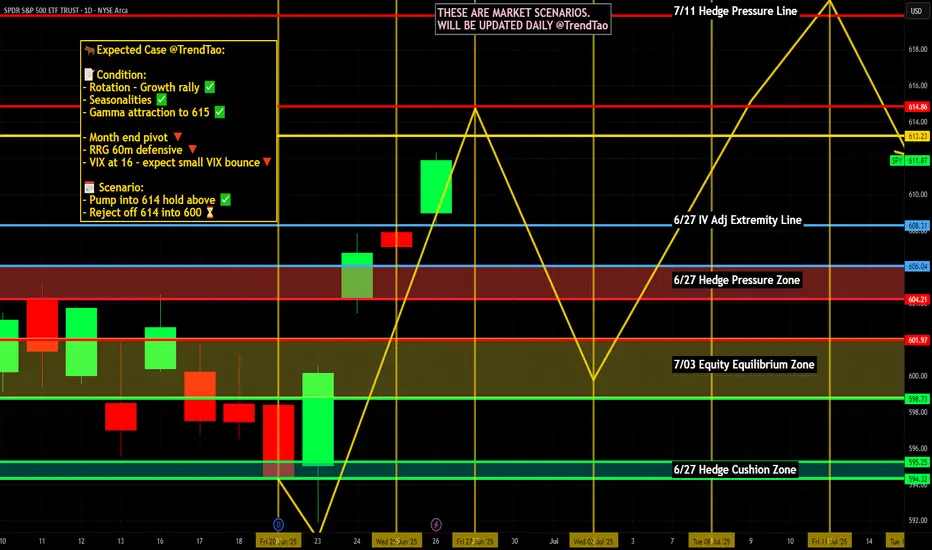
Nightly $SPY / $SPX Scenarios for June 27, 2025🔮 Nightly AMEX:SPY / SP:SPX Scenarios for June 27, 2025 🔮
🌍 Market-Moving News 🌍
📉 Global Markets Bet on Dovish Fed Pivot
Markets are pricing in more aggressive Federal Reserve rate cuts—approximately 125 bps by end-2026—due to speculation that President Trump may replace Chair Powell with a dovish successor. Investors caution excessive political influence could jeopardize Fed independence
🏦 Fed Governor Warns of Tariff Risks
Fed’s Michael Barr emphasized that tariffs could trigger inflation and unemployment, reinforcing the Fed’s wait‑and‑see approach. Expect modest rate cuts later this year, contingent on economic signals
📉 Q1 GDP Revised Sharply Lower
First-quarter U.S. GDP was downgraded to an annualized contraction of 0.5%, a deeper fall than previously reported. The revision underscores drag from weak consumer spending and trade disruptions
📃 Trade Deficit Widens in May
U.S. goods trade deficit expanded 11% to $96.6 billion, driven by a $9.7 billion drop in exports. Trade gap dynamics remain a headwind for growth projections
🐘 JPMorgan Sees Stagflation Risks
JPMorgan revised its U.S. GDP growth forecast down to 1.3%, warning that tariff-related “stagflationary impulse” is complicating growth and inflation outlooks—and making recession risks more real
📊 Key Data Releases 📊
📅 Friday, June 27:
8:30 AM ET – U. of Michigan Consumer Sentiment – June (Prelim.)
Expected to reflect growing economic caution. The index fell in May; traders will watch for further weakness.
10:00 AM ET – Fed Stress Test Results
Fed to release annual bank stress-test outcomes. Strong results support financial stability, while weak spots could unsettle markets
⚠️ Disclaimer:
This information is for educational and informational purposes only and should not be construed as financial advice. Always consult a licensed financial advisor before making investment decisions.
📌 #trading #stockmarket #economy #Fed #inflation #macro #charting #technicalanalysis
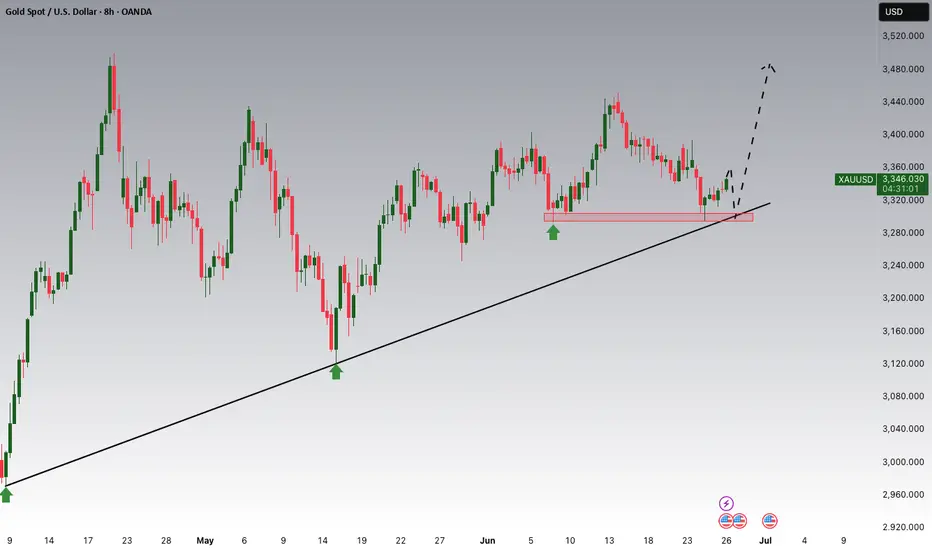
Gold Potential UpsidesHey Traders, in today's trading session we are monitoring XAUUSD for a buying opportunity around 3,300 zone, Gold is trading in an uptrend and currently is in a correction phase in which it is approaching the trend at 3,300 support and resistance area.
Trade safe, Joe.
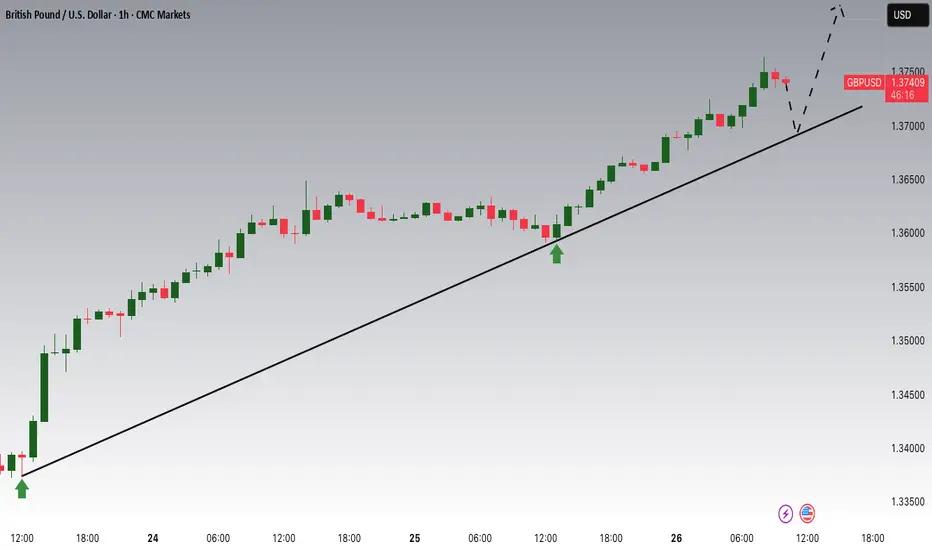
GBPUSD Potential UpsidesHey Traders, in today's trading session we are monitoring GBPUSD for a buying opportunity around 1.37000 zone, GBPUSD is trading in an uptrend and currently is in a correction phase in which it is approaching the trend at 1.37000 support and resistance area.
Trade safe, Joe.
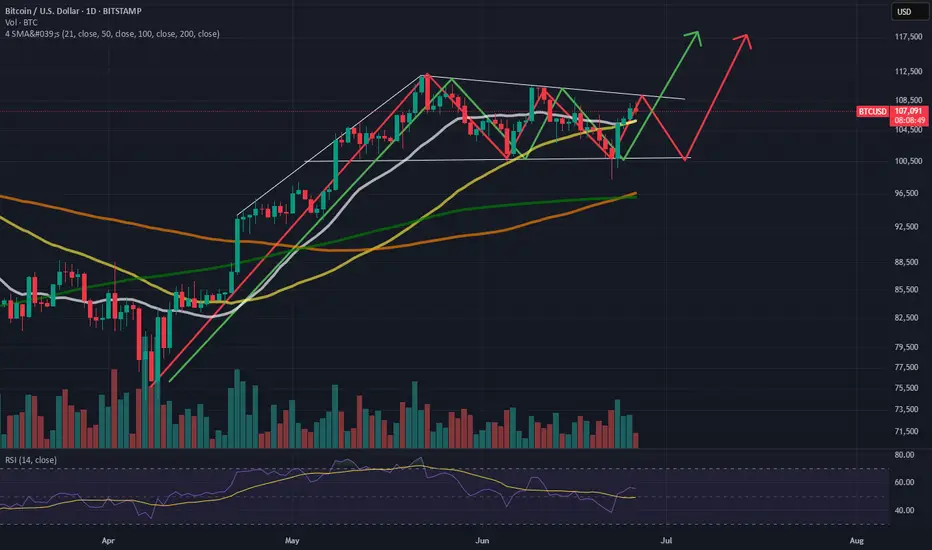
BTC daily bull flag formationBTC is looking bullish on the daily chart in my opinion. One more pullback might be in order before we test new highs on the daily chart. The 100 sma has crossed over the 200 sma and the 50 sma is crossing the 21 sma. The rsi is neutral at time of publication. This bullish breakout could occur in late july after a pullback in the near term.
I think bitcoin is setting up to make another all time high push as summer draws on.
Not financial advice. Do your own DD.
Thanks for viewing the idea.
Comment what you think is going to happen over the course of this summer.
$5 to $32 vertical over 500% $CYN🔥 $5 to $32 vertical over 500% since market open NASDAQ:CYN on news mentioning NASDAQ:NVDA

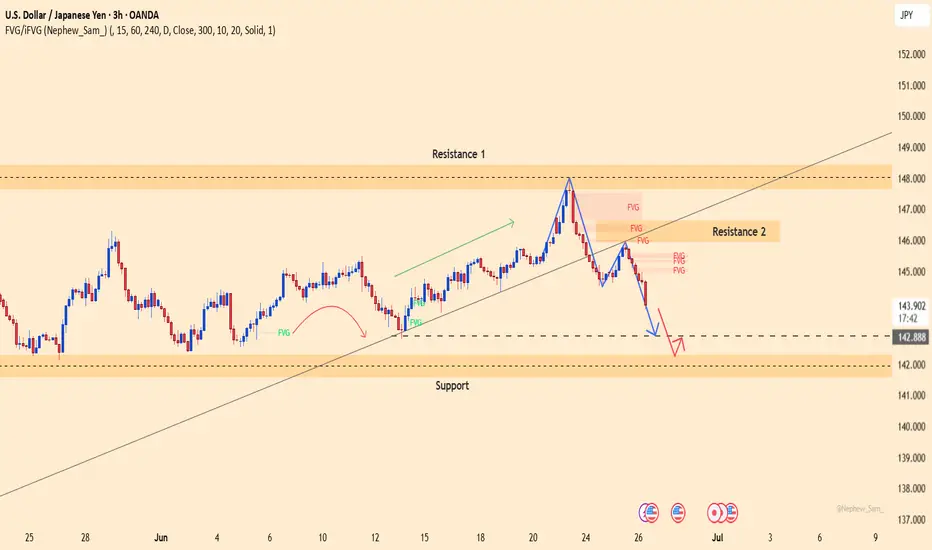
USDJPY – Uptrend Still Intact, But Waiting for a BounceUSDJPY is currently pulling back toward the key support zone at 142.244 after being rejected from the 148.000 resistance area. This recent drop reflects strong selling pressure from the dense FVG zones near Resistance 2.
However, the overall structure remains bullish, with a series of higher highs and higher lows still intact. The current support zone is crucial—if it holds, USDJPY could rebound toward 145.800 and potentially retest the 148.000 level.
On the news front:
– A fragile ceasefire between Iran and Israel has improved global risk sentiment, reducing demand for USD as a safe haven.
– The Bank of Japan kept interest rates unchanged and signaled caution in reducing bond purchases—supporting the yen, but not enough to reverse the dollar's edge.
– The wide interest rate differential still favors the USD.
Strategy: Watch for bullish confirmation at 142.244. If buyers step in clearly, it may present a long opportunity in line with the dominant uptrend.
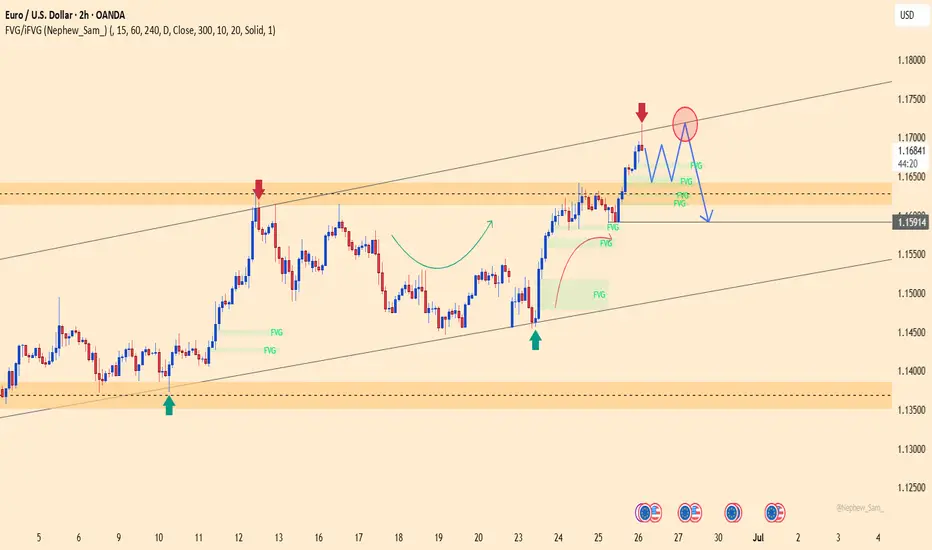
EURUSD – Short-Term Top Signal, Sellers Getting ReadyEURUSD has reached the upper boundary of the ascending channel around 1.17190 and immediately faced selling pressure. This zone previously acted as a strong reversal area, and with a rejection candlestick and a forming FVG, the risk of a downward correction is increasing.
Currently, the price is moving sideways just below the high, forming lower highs — suggesting a possible distribution pattern before breaking the bullish structure. If price breaks below the FVG zone near 1.165–1.166, the move could extend toward the technical target at 1.15900 — aligning with the channel bottom and a historical liquidity area.
Recent fundamental drivers:
U.S. economic data remains strong (Jobless Claims, Core PCE) → supports USD strength
The ECB remains cautious and hasn’t committed to further rate hikes → slightly weakens the euro
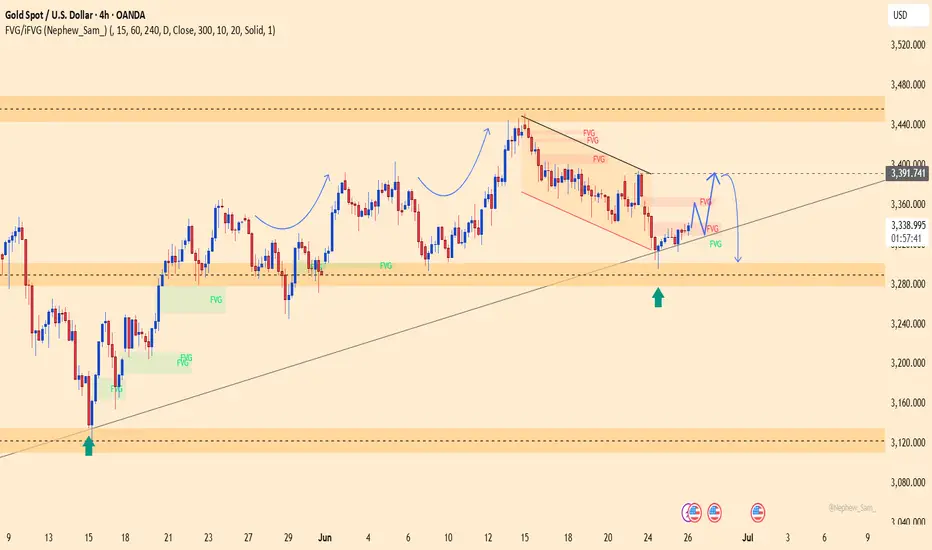
Is Gold Setting a Trap for Traders?Gold is currently retesting the FVG zone around 3,392 after breaking below a key trendline — a classic sell-trigger area if price gets rejected.
Bearish momentum is supported by:
U.S. jobless claims: 244K < 245K forecast → Stronger USD
Iran–Israel ceasefire → Reduced demand for safe-haven assets
If price fails to break above 3,392, the next downside target is the 3,299 support zone.
Trade idea: Watch for a rejection around 3,390–3,392 to consider short positions.
Bearish bias remains valid as long as price stays below 3,392.
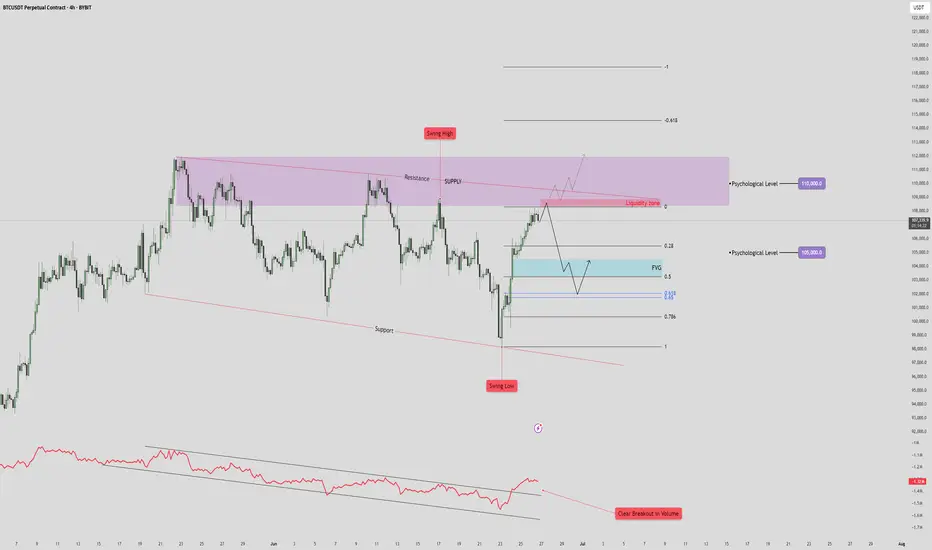
BTC/USDT Drop to 101k?🧠 High Time Frame Context
Trend: Consolidation within a broad range (support and resistance clearly defined).
Key Psychological Levels:
105,000 USDT – minor level, acting as a magnet in short-term PA.
110,000 USDT – major supply confluence and liquidity target.
🟪 Supply & Resistance Zone
Zone: Marked in purple (108.5k-112k).
Key Observation:
Swing high formed inside this zone, indicating liquidity trap.
Potential fake-out or strong rejection from this area.
Strong confluence with a descending resistance trendline, adding to the selling pressure.
🔵 Fair Value Gap (FVG) & Retracement Targets
FVG identified just below the current price (~103.5k-104.5k).
Price is projected to:
Reject from the current high.
Drop to fill the FVG zone.
Possibly bounce between FVG and Fibonacci retracement levels:
0.5
0.618
0.786
🔴 Volume & RSI Divergence
Volume breakout is noted on the last push down (bottom red annotation), followed by a retrace.
OBV shows bullish divergence with price:
🔻 Support Structure
Lower red trendline is a key long-term support.
Previous swing low aligns with this trendline – buyers showed strong interest here.
If FVG fails to hold, expect a retest of this trendline near 97,000–98,000.
📈 Likely Scenarios
Base Case (Neutral-Bearish):
Price rejects current zone (~107,000).
Pullback into FVG (101–104K).
Bounce to 105K (minor resistance), then decide next direction.
Bullish Breakout:
If price breaks and closes above 110K, it invalidates supply zone.
Opens door to 115–118K range.
Bearish Breakdown:
Fails FVG zone.
Tests previous swing low and support (~97K).
Below that, structure becomes macro bearish.
🧩 Summary
Short-Term: Retracement into FVG likely. Monitor reaction.
Medium-Term: Bearish bias while price is below 110K.
Invalidation for bears: Clean break and hold above 110K.
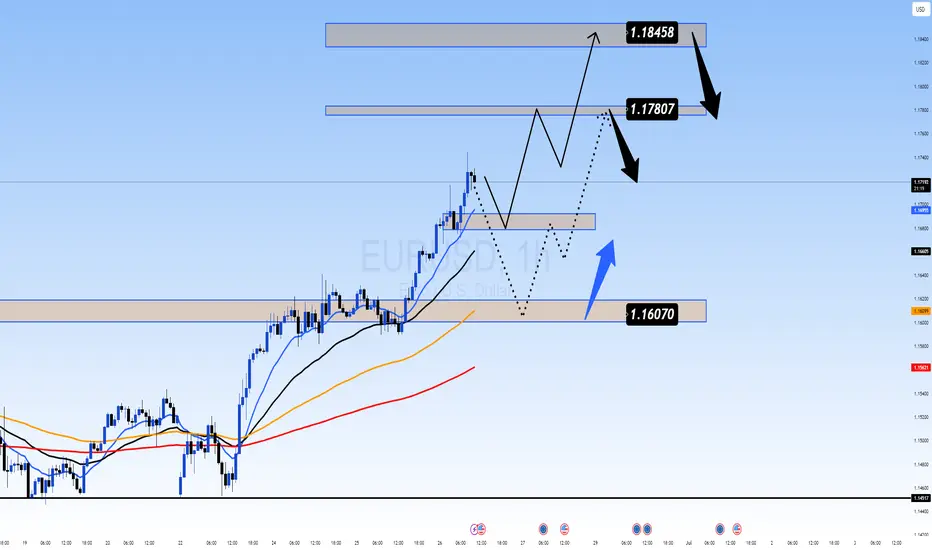
Euro's Surge on USD Weakness – Is 1.20 the Next Stop?EURUSD: Euro's Surge on USD Weakness – Is 1.20 the Next Stop?
Hello TradingView Community!
The EURUSD pair is currently commanding significant attention with its strong upward momentum.
🌍 Fundamental Highlights: Euro's Tailwinds & USD's Headwinds
The Euro has demonstrated notable strength, recently breaching the 1.17 mark to hit its highest level in over 3.5 years. According to ING, if this momentum holds, the next target could be 1.20, contingent on continued USD weakness.
The US Dollar faces considerable pressure following news that President Trump intends to name a successor to Fed Chair Powell soon, sparking concerns about the Fed's independence. Such speculation often leads to expectations of a more 'dovish' monetary policy, weakening the USD.
Adding to the Euro's support are the NATO agreement to increase defense spending targets to 5% and President Trump's seemingly "less aggressive" stance towards the EU.
In summary: Should USD depreciation persist, not only the Euro but other asset classes might also attract capital inflows, particularly given the ongoing uncertainties surrounding inflation risks and monetary policy.
📊 EURUSD Technical Outlook (H4/M30 Chart):
Our technical analysis of the EURUSD chart (image_b73298.png) confirms a clear and robust uptrend, characterized by successive higher highs and higher lows. The EMAs are in a bullish alignment, reinforcing this upward trajectory.
Upside Targets (Potential BUY Zones):
1.17807: The initial potential target if the bullish momentum continues.
1.18458: A higher target representing the next potential resistance zone.
Key Support Levels (Potential BUY Zones for pullbacks):
1.16070: A strong support level where demand could emerge after a correction.
An implied intermediate support around 1.166xx (visually suggested by price action between current levels and 1.16070) could also offer buying opportunities after minor pullbacks.
🎯 EURUSD Trading Plan:
BUY Zone 1 (Intermediate Pullback):
Entry: 1.16600 - 1.16700
SL: 1.16450
TP: 1.16800 - 1.17000 - 1.17200 - 1.17500 - 1.17807 - 1.18000 - 1.18300 - 1.18458
BUY Zone 2 (Strong Support):
Entry: 1.16070
SL: 1.15900
TP: 1.16200 - 1.16400 - 1.16600 - 1.16800 - 1.17000 - 1.17300 - 1.17600 - 1.17807 - 1.18458
SELL Zone (Consider only at upside targets with clear reversal signals):
Entry: 1.18458 (This is an upside target, but also a potential resistance for selling if strong reversal signals appear).
SL: 1.18600
TP: 1.18300 - 1.18000 - 1.17807 - 1.17500 - 1.17200 - 1.17000 - 1.16800
⚠️ Key Factors to Monitor:
Fed Leadership News: Any official announcements regarding the Fed Chair succession will trigger significant USD volatility.
Eurozone Economic Data: Upcoming inflation, GDP, and employment reports.
ECB Statements: The European Central Bank's stance on monetary policy.
Geopolitical Developments: Major tensions or agreements can influence market sentiment.
Trade smart and always manage your risk effectively! Wishing everyone a profitable trading day!
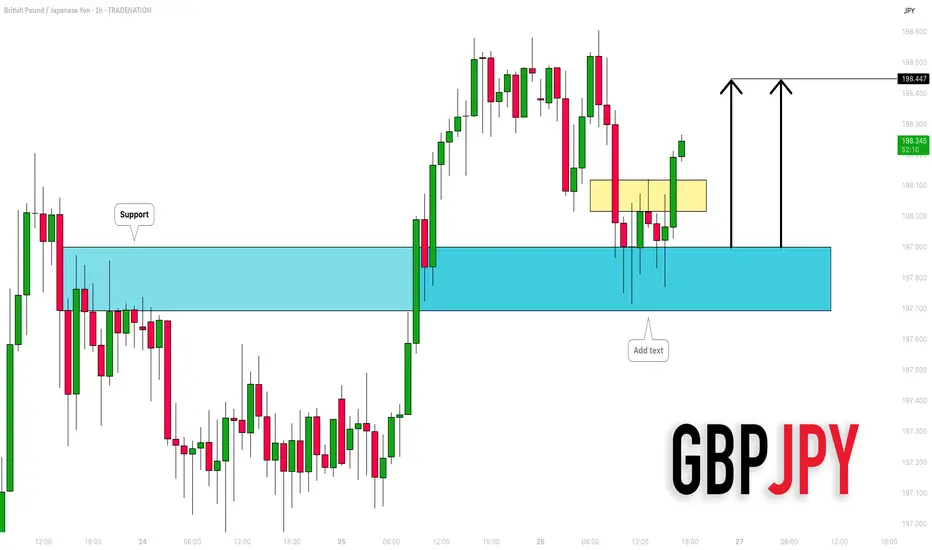
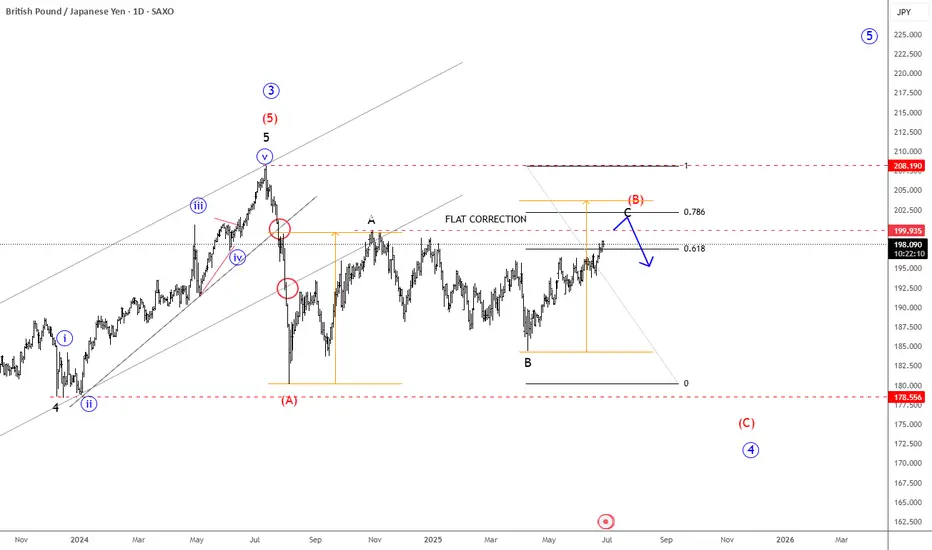
GBPJPY Keeps Recovering, But It’s Approaching ResistanceGBP/JPY is on the rise but is approaching the upper boundary of the 2024–2025 range, which could present strong resistance around the 200 level. Keep in mind that the decline from the 2024 highs to the July lows near 180 was impulsive, while the current rebound appears slow and corrective—possibly a wave B within a flat correction or even part of a triangle formation. In either case, we believe some further sideways price action is likely, followed by a potential downward turn from this prior subwave A resistance zone.
Riding the Wave or Facing a Pullback? Key Levels to WatchGBPUSD: Riding the Wave or Facing a Pullback? Key Levels to Watch!
Hello TradingView Community!
The GBPUSD pair is currently under the spotlight, experiencing significant movements driven by a mix of market sentiment and economic indicators.
🌍 Fundamental Snapshot: GBP's Lift vs. Underlying Pressures
The British Pound has seen a notable surge, climbing near 1.3765 against the US Dollar. This uplift is primarily fueled by market hopes for an imminent announcement of Fed Chair Powell's successor by President Trump, hinting at potential future dovish shifts in Fed policy. Such speculation could dampen USD's strength, benefiting GBPUSD.
However, the outlook isn't entirely clear-cut for the Pound. Fed Chair Powell has cautioned that tariff-induced inflation might prove persistent, adding a layer of complexity to the broader USD sentiment. Domestically, UK employers are reportedly planning workforce reductions to offset rising social security contributions, which could weigh on the GBP.
In essence, GBPUSD is benefiting from potential USD weakness linked to Fed policy expectations, but traders should remain vigilant about internal economic pressures within the UK.
📊 GBPUSD Technical Analysis (H4/M30 Chart):
Our technical analysis of the GBPUSD chart (image_b6d4de.png) reveals a clear uptrend, marked by consistent higher highs and higher lows. The EMAs are also in a bullish alignment, reinforcing this upward momentum.
Key Resistance (Potential Sell Zone): We identify significant resistance at 1.38366. This level could attract selling pressure, suggesting a potential price reversal or consolidation after hitting this mark.
Key Support Levels (Potential Buy Zones):
Initial support lies at 1.36648.
A stronger support area is at 1.36158. These levels could act as bounce points after any corrective moves.
🎯 GBPUSD Trading Plan:
BUY Zone 1 (Near Current Support):
Entry: Consider entries around 1.36648.
SL: 1.36500 (just below support).
TP: Target incremental gains towards 1.36800, 1.37000, 1.37200, 1.37400, 1.37600, 1.37800, 1.38000, and potentially 1.38300 (just shy of major resistance).
BUY Zone 2 (Stronger Support):
Entry: Look for entries around 1.36158.
SL: 1.36000 (below strong support).
TP: Target incremental gains towards 1.36300, 1.36500, 1.36700, 1.37000, 1.37300, 1.37600, 1.38000, and 1.38300.
SELL Zone (At Resistance):
Entry: Consider short entries around 1.38366.
SL: 1.38500 (just above resistance).
TP: Target incremental declines towards 1.38200, 1.38000, 1.37800, 1.37500, 1.37200, 1.37000, 1.36800, and 1.36648 (targeting support).
⚠️ Key Factors to Monitor:
Fed Leadership News: Any official announcement regarding the Fed Chair succession will trigger significant USD volatility.
UK Economic Data: Upcoming reports on employment, inflation, and GDP will directly impact the Pound.
BoE Statements: Monetary policy stances from the Bank of England.
US Inflation/Employment Data: Continues to influence overall USD strength.
Trade wisely and always prioritize robust risk management! Wishing everyone a successful trading day!

XAUUSD: Gold's Inflationary Tug-of-WarXAUUSD: Gold's Inflationary Tug-of-War – Navigating Powell's Remarks & Key Levels
Hello TradingView community!
Let's dive into Gold (XAUUSD) today, as its price action continues to be shaped by the Federal Reserve's (Fed) cautious stance on inflation and interest rates. Recent comments from Fed Chair Jerome Powell are particularly noteworthy.
🌍 Macroeconomic Drivers: Tariffs, Inflation, and Fed's Deliberation
The market finds itself in a complex situation following key statements from Fed Chair Jerome Powell:
Powell indicated that substantial tariffs could trigger a prolonged wave of inflation, potentially moving beyond conventional economic models. This introduces a new and significant factor into the inflation outlook.
Despite recent inflation moderation, Powell stressed the necessity of more data from June and July before considering any rate cuts. This underscores the Fed's cautious approach and lack of immediate urgency.
He also cautioned about the risk of "price shocks turning into persistent inflation".
In this environment, where market sentiment is stretched between hopes for rate cuts and the emerging risk of tariff-driven inflation, Gold maintains its role as a crucial psychological anchor. Should the Fed be slow to react to this potential new inflationary pressure, Gold's appeal could intensify.
📊 XAUUSD Technical Analysis & Trading Plan:
Based on the XAUUSD charts (H4/M30 timeframe) you provided (e.g., image_008403.png): Gold is currently undergoing a corrective or consolidating phase after a notable pullback. The price is trading below shorter-term moving averages, suggesting either bearish momentum or an accumulation phase.
Key Resistance Zones (Potential SELL Areas):
3,352.383 - 3,353.860: An immediate resistance point, coinciding with the 0.5 Fibonacci level.
Higher up: 3,391.750 - 3,395.000: This represents a very strong previous peak and a major resistance barrier.
Key Support Zones (Potential BUY Areas):
3,317.738 - 3,311.214: An intermediate support area, close to the 0.236 Fibonacci level.
3,302.939 - 3,302.857: A strong demand zone, aligning with the recent low.
Further down: 3,286.257: This is the next significant support level if preceding zones are breached.
🎯 XAUUSD Intraday Trading Plan:
Here are our refined zones and targets for today's trading:
BUY SCALP:
Entry: 3316 - 3314
SL: 3310
TP: 3320 - 3324 - 3328 - 3332 - 3336 - 3340
BUY ZONE:
Entry: 3304 - 3302
SL: 3298
TP: 3308 - 3312 - 3316 - 3320 - 3330 - 3340 - 3350
SELL SCALP:
Entry: 3353 - 3355
SL: 3360
TP: 3350 - 3345 - 3340 - 3335 - 3330
SELL ZONE:
Entry: 3390 - 3392
SL: 3396
TP: 3386 - 3382 - 3378 - 3374 - 3370 - 3360
⚠️ Key Factors to Monitor:
Fed Official Speeches: Any new comments from Fed officials regarding inflation or monetary policy outlook.
US Economic Data: Upcoming inflation (CPI, PCE) and employment reports (NFP) will be crucial for policy expectations.
Geopolitical Developments: Ongoing global tensions consistently bolster Gold's safe-haven appeal.
Trade wisely and always manage your risk effectively! Wishing everyone a profitable trading day!

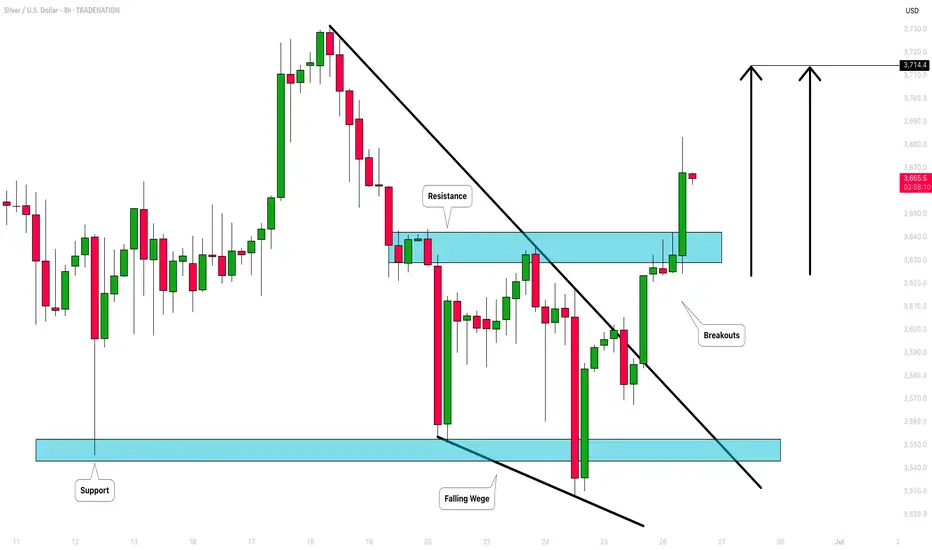
SILVER (XAGUSD): Buyers Show Strength
Silver is going to rise more, following a strong bullish sentiment this morning.
The price violated a strong falling trend line and an intraday horizontal resistance.
These 2 breakouts indicate a strong buying pressure.
The price may grow more today and reach 37.14 level.
❤️Please, support my work with like, thank you!❤️
I am part of Trade Nation's Influencer program and receive a monthly fee for using their TradingView charts in my analysis.