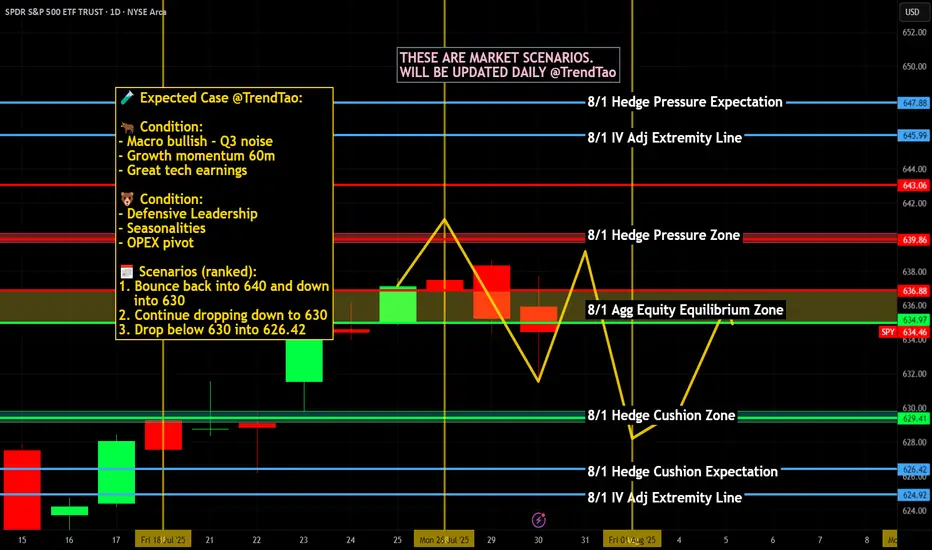
Nightly $SPY / $SPX Scenarios for July 31, 2025🔮 Nightly AMEX:SPY / SP:SPX Scenarios for July 31, 2025 🔮
🌍 Market-Moving News 🌍
🏦 Fed Holds Rates — Dissent Indicates Division
The Federal Reserve maintained its benchmark rate at 4.25%–4.50%. Notably, two governors—Christopher Waller and Michelle Bowman—dissented in favor of a 25 bp rate cut, underscoring internal divisions amid growing political pressure
📈 Strong Q2 Growth, But No Rate-Cut Signal
U.S. GDP expanded at a 3.0% annualized rate in Q2, rebounding sharply from Q1's contraction. Despite this, Powell emphasized persistent inflation, particularly from tariffs, reinforcing the Fed’s cautious policy stance
🛢️ Oil Climbs as Tariff Tensions Rise
Brent crude rose to ~$73.51 and WTI to ~$70.37 on fears of supply disruptions tied to President Trump’s threats of new tariffs on Russian oil and new tariffs imposed on Brazil and South Korea
📊 Key Data Releases & Events 📊
📅 Thursday, July 31:
8:30 AM ET – Initial Jobless Claims (week ending July 26)
Initial claims rose to 222,000, up from 217,000 previously—an early gauge of labor-market trends
8:30 AM ET – Employment Cost Index (Q2)
Quarterly growth in labor costs edged lower to 0.8%, down from 0.9%—a signal of moderate wage pressures
8:30 AM ET – Personal Income (June)
Data released on household income and spending patterns—crucial for assessing consumer resilience heading into Q3
⚠️ Disclaimer:
This information is for educational and informational purposes only and should not be construed as financial advice. Always consult a licensed financial advisor before making investment decisions.
📌 #trading #stockmarket #economy #Fed #inflation #jobs #technicalanalysis
Technical Analysis
#PENGUUSDT confirms a bearish impulse📉 SHORT BYBIT:PENGUUSDT.P from $0.034625
⚡ Stop loss $0.035646
🕒 Timeframe: 4H
⚡ Overview:
➡️ A Double Top pattern BYBIT:PENGUUSDT.P has formed, signaling a bearish reversal.
➡️ The price broke the $0.0355 support and is consolidating below, confirming seller strength.
➡️ Increasing sell volume confirms bearish control.
➡️ Main focus on targets in the $0.034–0.033 zone.
➡️ The POC at $0.03113 remains the ultimate bearish objective.
🎯 TP Targets:
💎 TP 1: $0.033947
💎 TP 2: $0.033369
💎 TP 3: $0.032948
BYBIT:PENGUUSDT.P Trade Recommendations:
📢 Hold short towards the TP zones.
📢 Watch for reaction around $0.0339 — partial profit-taking possible.
📢 Invalidation if price reclaims above $0.0356.
⚠️ As long as bearish pressure holds, the price is likely to continue towards TP2–TP3.
⚠️ A recovery above $0.0356 would invalidate this setup.
🚀 The signal confirms a bearish impulse — expecting further downside!

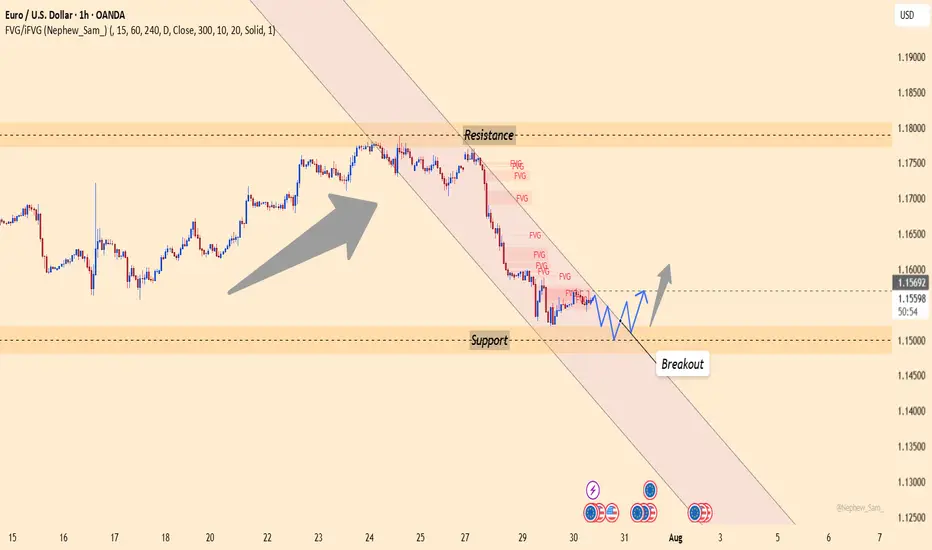
EURUSD – German GDP boosts EUR, but USD still holds the reins Germany’s recently released GDP data exceeded expectations, acting as a catalyst for EURUSD to rebound after a steep decline. However, this upward move remains fragile, as the USD continues to dominate the market—especially with several key U.S. economic reports set to be released later this week.
On the chart, EURUSD has just bounced from the 1.15000 support zone, which has historically served as a strong floor. If the price holds above this level and breaks the downtrend line, the short-term target could move toward the 1.15700 resistance zone.
Still, the path ahead won’t be easy. The market is closely watching upcoming U.S. data, such as the jobs report and the Core PCE index—the Fed’s preferred inflation gauge. If these figures come in strong, the USD could regain strength and put pressure back on EURUSD.
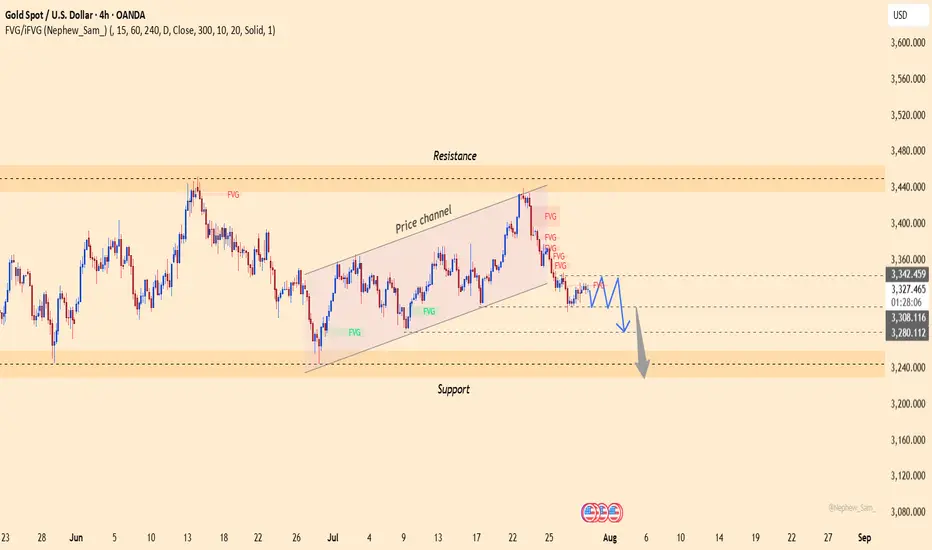
XAUUSD – Downtrend Continues as USD StrengthensGold remains under significant pressure as the U.S. dollar continues to gain strength following a series of positive economic data from the U.S. Specifically, GDP grew by 2.5%, beating expectations, while ADP Non-Farm Employment data also came in strong. This suggests the U.S. economy remains resilient, supporting the Fed's hawkish stance and keeping the dollar strong.
On the 4H chart, XAUUSD has broken below the previous ascending price channel and is now trading under the 3,340.400 resistance zone – an area packed with unfilled FVGs. The current price structure leans bearish, with any rebounds likely to be temporary pullbacks.
If USD strength continues, gold could drop further toward the support zone at 3,279.200 or even lower near 3,240.
Trading Strategy: Focus on SELL
Entry: Around 3,325 – 3,340.400 upon price rejection signals.
Target: 3,279.200 or lower.
Stop-loss: Above 3,342.459
GOLD – A Bottom in Place or Just the Calm Before the Storm?GOLD – A Bottom in Place or Just the Calm Before the Storm?
Gold has recently shed nearly $50, indicating sustained bearish pressure. But here’s the real question:
👉 Is this simply a liquidity sweep before a bullish reversal?
👉 Or are we witnessing the early stages of a broader bearish continuation?
Let’s break it all down – step by step – to map out smart, reaction-based trading opportunities.
🌍 Macro & Fundamental Overview
The US–EU trade and defence agreement has dampened gold’s role as a safe haven in the short term.
The US Dollar and equity markets remain strong, driven by solid macroeconomic data.
Overall market sentiment leans “risk-on”, pushing capital into riskier assets and away from precious metals.
📆 Upcoming Key Events:
Tuesday: ADP Employment Data
Friday: FOMC Statement & Nonfarm Payrolls (NFP)
These events could drastically shift market expectations around Fed policy, impacting gold’s direction.
📊 Technical Picture (Timeframes H1–H4)
Gold has rebounded from recent lows and is currently moving within a parallel bullish channel.
However, price is now nearing a critical resistance level at 3342 – a potential turning point.
🔎 Key Technical Zones:
🔺 Short-Term Resistance: 3342
🔺 Major Supply Zone: 3369–3388 (Order Block + Fair Value Gap + Fib 0.5–0.618)
🔻 High-Liquidity Support Zone: 3293–3290
🔻 Key Demand Zone (FVG): 3275–3273
🔺 High-Level Resistance: 3416
🧭 Trading Plan – Based on Price Action (Not Prediction)
We don’t guess the market. We wait, watch, and react based on price confirmation.
✅ Scenario 1 – Buy the Dip (Scalp Setup)
Entry: 3293 – 3291
Stop Loss: 3286
Targets: 3296 → 3300 → 3304 → 3308 → 3312 → 3315 → 3320 → 3330
🟢 Ideal for intraday scalps within high-liquidity zones.
✅ Scenario 2 – Buy from Deep Demand (Swing Setup)
Entry: 3275 – 3273
Stop Loss: 3269
Targets: 3280 → 3284 → 3288 → 3292 → 3300 → 3305 → 3310 → 3320 → 3330
🟢 Great opportunity if price absorbs selling pressure at the FVG zone and reverses.
❌ Scenario 3 – Short from Key Resistance (3342)
Entry: 3340 – 3342
Stop Loss: 3346
Targets: 3335 → 3330 → 3325 → 3320 → 3310
🔴 Use if price fails to break and hold above 3342.
❌ Scenario 4 – Short from Major Supply Zone (Swing)
Entry: 3369 – 3372
Stop Loss: 3376
Targets: 3365 → 3360 → 3355 → 3350 → 3345 → 3340 → 3330 → 3320
🔴 Higher-risk setup; enter only on strong rejection or bearish candlestick confirmation.
⚠️ Risk Management Guidelines
Avoid entries during the London and NY open – fakeouts and stop hunts are common.
Always wait for clear price reaction within zones – avoid impulsive entries.
Respect your stop-loss levels, especially with this week’s major data releases.
🎯 Final Thoughts for UK & Global Traders
Let the market come to you – never chase price.
Stay disciplined, especially in volatile weeks like this one.
The best trades are reactionary, not predictive.
💬 Found this plan useful?
Feel free to comment your views or follow for more structured gold analyses throughout the week.

NIKE Confirms A Bullish Reversal With An Impulsive RecoveryWe talked about Nike on July 10 with our members, where we mentioned and highlighted a completed higher degree ABC correction in wave IV on the monthly and weekly charts.
Today we want to represent a closer view, as we see a five-wave impulsive recovery away from the lows on a daily chart. It actually confirms the bottom and bullish reversal, but since it can be trading in 5th wave that can stop around 80-85 area, we should be aware of a three-wave corrective setback soon. It can slow down the price back to the open GAP, so ideal buy zone is in the 70-60 area. Invalidation level is at 52.
Highlights:
Direction: Up, but watch out for a correction
Structure: Impulse, Wave 5 in final stages
Support: 70 / 60

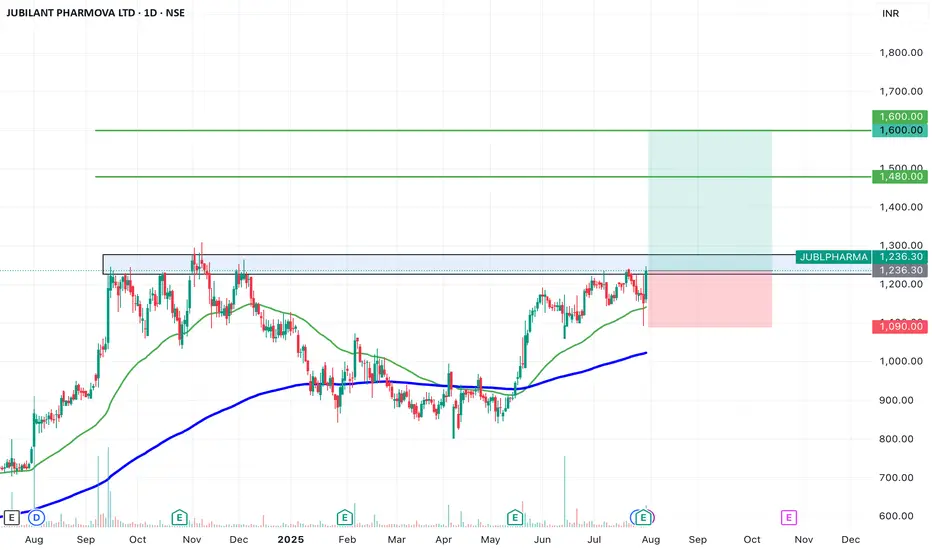
SWING IDEA - JUBILANT PHARMOVAJubilant Pharmova , a diversified pharmaceutical company focused on CRAMS and specialty pharma, is presenting a strong swing opportunity backed by a major pattern breakout and volume confirmation.
Reasons are listed below :
Breakout from an Inverted Head & Shoulders pattern after over a year of consolidation
Attempting breakout above 1250, a key resistance zone with multiple rejections in the past
Strong marubozu candle on the daily chart with a notable volume spike, signaling conviction
Trading near all-time highs, and comfortably above key EMAs, reinforcing trend strength
Target : 1480 // 1600
Stoploss : weekly close below 1090
DISCLAIMER -
Decisions to buy, sell, hold or trade in securities, commodities and other investments involve risk and are best made based on the advice of qualified financial professionals. Any trading in securities or other investments involves a risk of substantial losses. The practice of "Day Trading" involves particularly high risks and can cause you to lose substantial sums of money. Before undertaking any trading program, you should consult a qualified financial professional. Please consider carefully whether such trading is suitable for you in light of your financial condition and ability to bear financial risks. Under no circumstances shall we be liable for any loss or damage you or anyone else incurs as a result of any trading or investment activity that you or anyone else engages in based on any information or material you receive through TradingView or our services.
@visionary.growth.insights
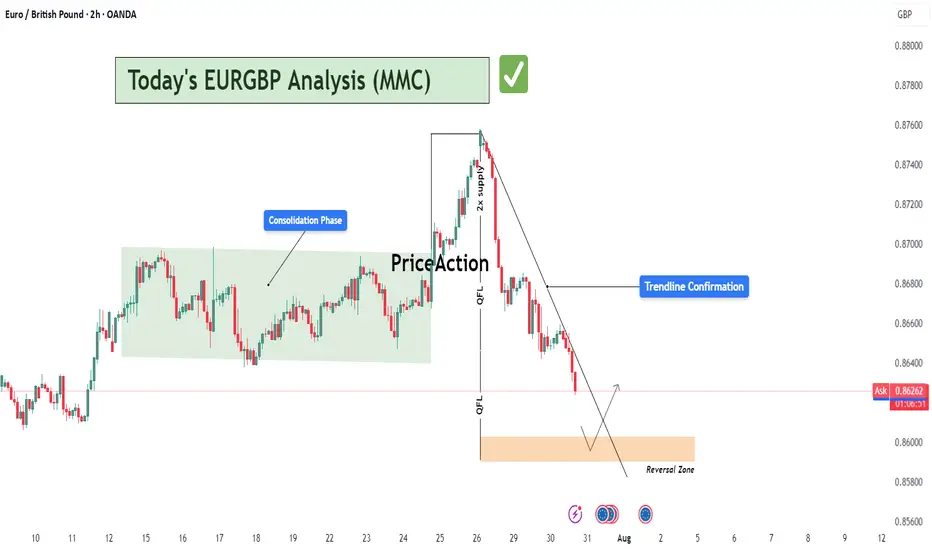
EURGBP Analysis : Bearish Leg Nearing Completion + Target Zone📍 Overview:
The EURGBP pair has recently provided significant price action signals that suggest a high-probability reversal setup is unfolding. This analysis dives deep into market structure, supply and demand dynamics, and institutional price behavior using MMC principles.
The current focus lies in identifying a potential trend reversal opportunity after a sharp decline from a key supply level, as price nears a well-marked Reversal Zone. This detailed breakdown covers each phase to provide clarity and trade planning.
🧩 Phase 1: Consolidation Phase (Accumulation)
From July 11th to July 24th, EURGBP moved sideways within a clearly defined range-bound structure (highlighted in green).
This consolidation indicates a battle of control between bulls and bears, typically signaling accumulation or distribution depending on breakout direction.
The tight price action and wicks on both sides suggest market makers accumulating positions before a breakout.
Price eventually broke out to the upside, confirming bullish accumulation rather than distribution.
🚀 Phase 2: Impulse Move & 2x Supply Rejection
Following the breakout from the consolidation, price experienced a strong impulsive rally, catching breakout traders and pushing into a major supply zone.
The area where price reversed is marked as a 2x supply rejection zone, suggesting heavy institutional sell orders were triggered.
This zone aligns with a historical resistance level and is critical in the current structure.
Price failed to sustain the bullish momentum, forming a sharp drop right after tapping into supply, indicating strong selling pressure.
🔄 Phase 3: Market Structure Shift via QFL (Quick Flip Levels)
As the price dropped from the supply zone, two significant QFL levels were printed in quick succession.
QFL (Quick Flip Levels) represent a break in internal structure, showing that buyers were no longer defending the previous support zones.
These quick flips signal an aggressive shift in momentum from buyers to sellers.
Each QFL breakdown was followed by a new lower low, confirming the start of a bearish sequence or trend leg.
📉 Phase 4: Descending Trendline & Dynamic Resistance
After the QFL shifts, a clear downtrend channel formed, respected by multiple lower highs.
The descending trendline drawn from the supply zone peak has acted as dynamic resistance, rejecting every bullish pullback attempt.
This trendline provides technical confluence for intraday traders to manage risk and timing entries.
🟠 Current Market Context: Entering the Reversal Zone
Price is now approaching a marked Reversal Zone (highlighted in orange).
This zone represents a high-probability demand area, previously respected as a base before the rally to supply.
If price reaches this area and shows signs of exhaustion (e.g., bullish engulfing, long wick rejection, volume divergence), it may serve as a reversal point.
This zone aligns with MMC logic — market makers tend to react at zones of trapped liquidity, especially after stop hunts.
📈 Projected Scenario & Trade Setup:
Price drops into the Reversal Zone
A bullish rejection pattern appears (e.g., pin bar, engulfing candle)
Price retests and breaks the descending trendline to confirm a momentum shift
Entry can be taken post-breakout or with aggressive confirmation inside the zone
Stops placed below the zone; targets aligned with the previous QFL or trendline retest
⚠️ Key Notes for Traders:
Don't chase the move. Wait for reversal confirmation before entering.
QFLs offer strong structure-based levels to identify where the market flipped.
Use trendline confluence and volume confirmation for precise entries.
Monitor price action in the Reversal Zone — if invalidated, the downtrend may extend toward the next macro support.
Apply proper risk management and stay patient for the setup to fully develop.
📊 Summary:
🧭 Bias: Short-term bearish → possible reversal bullish
🎯 Entry Area: Reversal Zone (0.85800 – 0.86000 approx.)
⛔ Invalidation: Clean break and close below 0.85700
🏁 Potential Target: First TP near 0.86750; extended TP near 0.87050 (previous QFL level)
🔄 MMC Approach Recap:
This analysis follows the Market Maker Cycle (MMC) method, which involves:
Consolidation (Accumulation)
Manipulation (False Breakouts or Stop Hunts)
Distribution (Rapid Expansion & Flip Levels)
Re-Accumulation or Reversal
Each step is clearly defined in this chart, offering a blueprint for both trend traders and reversal specialists.
💬 Let's Talk:
What do you think about this setup? Are you seeing similar MMC patterns on other EUR or GBP crosses?
Drop your thoughts, charts, and questions below!
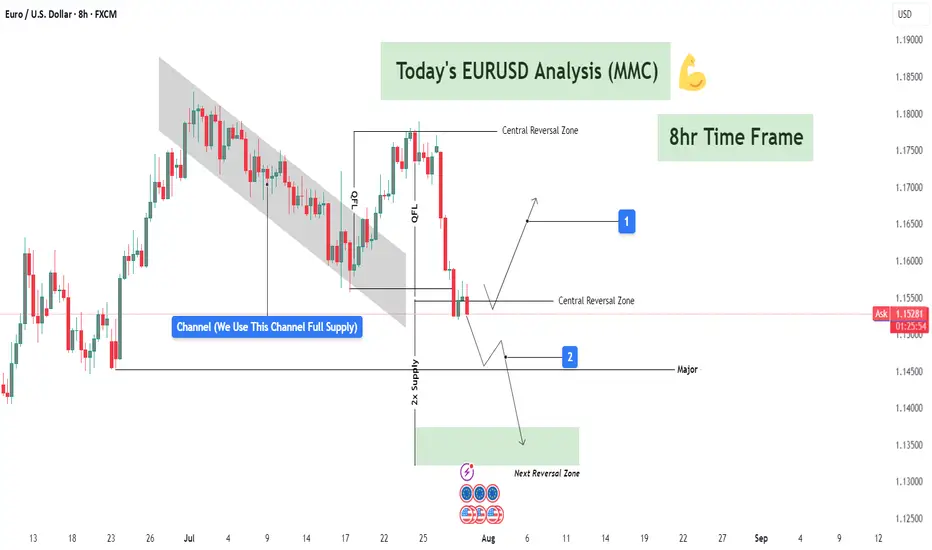
EURUSD Analysis – Supply Zones & Reversal Opportunities (MMC)Today’s EURUSD analysis focuses on identifying major supply zones, potential reversal points, and directional bias using the Mirror Market Concept (MMC) on the 8-hour timeframe.
1️⃣ Market Structure & Channel Supply Zone
The market recently formed a descending channel 📉, acting as a full supply zone where sellers dominated.
Every time price touched the upper boundary of this channel, we saw bearish reactions, proving this zone as a strong liquidity grab area.
Breakdown from the channel: After repeated attempts to break the channel to the upside, sellers regained control, pushing EURUSD lower and confirming bearish momentum.
2️⃣ Central Reversal Zone (Decision Point) ⚖️
Currently, price is consolidating around the Central Reversal Zone.
This zone is crucial because it can act as:
Reversal Point 🟢: If buyers step in aggressively, we might see a bullish leg toward previous swing levels, targeting resistance zones.
Continuation Zone 🔻: If sellers maintain pressure and break below this level, momentum will shift strongly bearish, aiming for deeper support.
Price behavior here will define short-term direction. Traders must wait for confirmation before committing to large positions.
3️⃣ Next Major Reversal Zone (High-Probability Demand) 🟩
Marked in green, this zone is expected to attract buyers if the current level fails.
Historically, these areas show high liquidity grabs and institutional activity.
If price reaches this zone, we expect significant bullish interest, making it a high-probability reversal area for medium-term buy setups.
4️⃣ Trade Scenarios
Scenario 1 (Bullish Reaction 🟢):
Price bounces from the Central Reversal Zone.
Possible targets: Previous structure highs inside the channel break zone.
Scenario 2 (Bearish Continuation 🔻):
Price fails to hold above and breaks lower.
Target: Next Major Reversal Zone for fresh liquidity accumulation.
5️⃣ Trading Approach & Risk Management 🛡️
Aggressive Approach: Intraday traders can scalp inside the Central Reversal Zone but must keep tight stop-losses to avoid fake-outs.
Conservative Approach: Wait for a clean break and retest confirmation, especially near the Next Reversal Zone for high-probability trades.
Maintain risk-to-reward (RR) ≥ 1:2 and avoid emotional trading during reversal attempts.
Summary:
EURUSD is at a critical juncture. The current market structure shows a bearish tone, but the Central Reversal Zone can still cause a temporary bullish reaction. A failure to hold will open the path toward the green reversal demand zone, where major buyers are likely to appear.
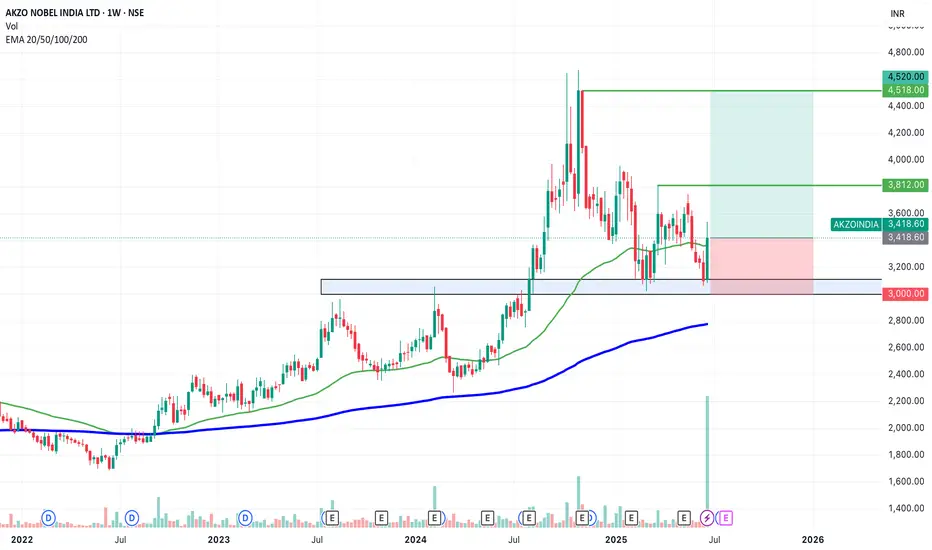
SWING IDEA - AKZO NOBEL INDIA Akzo Nobel India , a subsidiary of the global paints and coatings giant AkzoNobel N.V., is a leading player in India’s decorative and industrial paints market. Known for its premium brand Dulux , the company has strong brand recall, a wide distribution network, and consistent profitability.A strong brand, steady margins, and a bullish chart make this a candidate to watch for a short- to medium-term swing trade.
Reasons are listed below :
Bullish engulfing candle spotted on the weekly timeframe, signaling a potential trend reversal.
Accompanied by the highest-ever volume spike, adding strong conviction to the move.
Price is bouncing off the golden Fibonacci support (0.618), a classic retracement zone where strong reversals often occur.
The level of 3100 acted as a solid support.
The stock is trading above its 50 & 200 EMA on the weekly chart — a sign of long-term strength.
Target - 3812 // 4520
Stoploss - weekly close below 3000
DISCLAIMER -
Decisions to buy, sell, hold or trade in securities, commodities and other investments involve risk and are best made based on the advice of qualified financial professionals. Any trading in securities or other investments involves a risk of substantial losses. The practice of "Day Trading" involves particularly high risks and can cause you to lose substantial sums of money. Before undertaking any trading program, you should consult a qualified financial professional. Please consider carefully whether such trading is suitable for you in light of your financial condition and ability to bear financial risks. Under no circumstances shall we be liable for any loss or damage you or anyone else incurs as a result of any trading or investment activity that you or anyone else engages in based on any information or material you receive through TradingView or our services.
@visionary.growth.insights
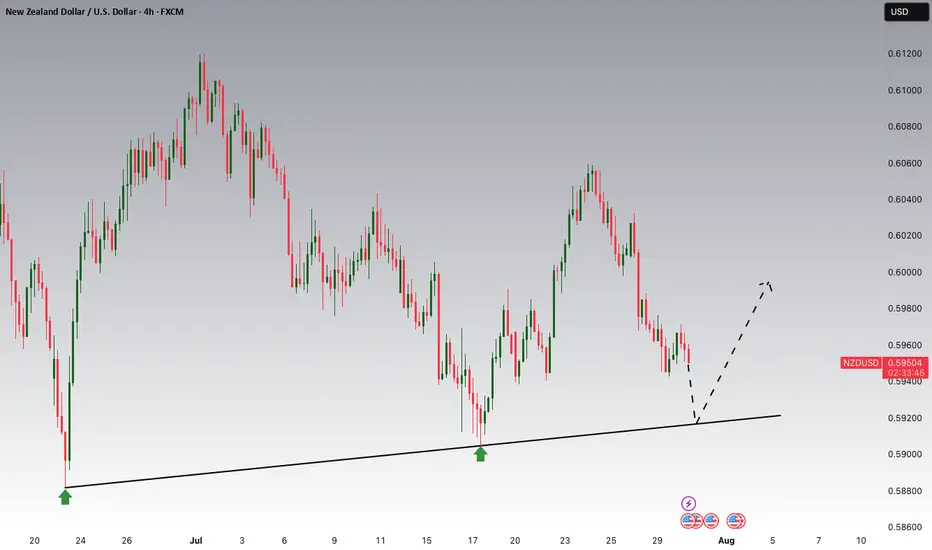
NZDUSD Potential UpsidesHey Traders, in today's trading session we are monitoring NZDUSD for a buying opportunity around 0.59200 zone, NZDUSD is trading in an uptrend and currently is in a correction phase in which it is approaching the trend at 0.59200 support and resistance area.
Trade safe, Joe.
USDJPY Forming Bullish Reversal | MMC Analysis + Target🧠 Chart Overview (2H Timeframe)
🔸 1. Head and Shoulders Inverse Pattern – MMC Bullish Blueprint
The chart beautifully shows an Inverse Head & Shoulders pattern, one of the most powerful reversal signals under MMC logic:
Left Shoulder: Formed after the initial drop and quick recovery.
Head : Deep liquidity grab and reversal from the lowest point (demand zone).
Right Shoulder: Higher low structure, indicating reduced selling pressure and shift in momentum.
This pattern is forming around a previous liquidity zone, which makes it more valid and aligned with smart money behavior.
🔸 2. Retesting Zone – Critical MMC Demand Area
Price is now retesting a highlighted demand zone, which acted as the springboard for the previous bullish move:
Bullish Pattern marked aligns with MMC’s concept of “Return to Origin”.
This zone also sits just above the right shoulder, confirming that buyers are defending aggressively.
If this level holds, we may see a strong continuation move to the upside.
🔸 3. Previous Reversal Zone (Supply) – Next Target Area
Marked in light green, this area is the next critical resistance:
Acts as liquidity target for institutions if price rallies.
Historically acted as a major reversal point.
Price is likely to show reactions or profit-taking behavior here.
Once broken and retested, it becomes a new support for further upside continuation (as marked on the chart).
🔸 4. Dual Scenarios – Bullish vs Bearish Pathways
Your chart correctly outlines two strategic possibilities:
✅ Bullish Scenario:
Price respects demand zone.
Breaks above previous reversal zone (149.000+).
Bullish continuation toward 149.800–150.500 range.
MMC tip: “If it goes bullish, use previous demand or double it” = Add confluence or stack demand zones for scale-in entries.
❌ Bearish Scenario:
If price breaks below retesting zone, bullish invalidation triggers.
Look to the previous all supply zone (Zone Pattern Must) for next reaction.
This scenario reflects smart money rejection of upside continuation.
🗂️ MMC Structural Elements Identified:
Zone/Pattern Role in Analysis
Inverse H&S Trend reversal signal
Retesting Zone Demand/entry area
Previous Reversal Zone First key resistance / next liquidity pool
Supply Zone Below Target in case of downside breakdown
MMC Logic Follow price structure, fakeouts, demand/supply traps
📈 Summary Outlook:
USDJPY is showing a technical bullish structure backed by MMC-based price psychology. The current pullback into a demand zone gives traders an excellent R:R opportunity for long positions, targeting higher zones upon breakout confirmation.
🟩 If bullish, breakout >149.000 will likely lead toward 150.000+
🟥 If bearish, breakdown <147.600 opens doors to deeper drop toward 146.000 zone (watch for reversal pattern).
🔑 Key Levels to Watch:
Type Level Range Notes
Support 147.600–147.800 Current retesting demand
Resistance 148.800–149.300 Previous Reversal Zone (Profit booking area)
Higher Resistance 150.500+ Final upside objective
Breakdown Zone <147.500 Flip to bearish scenario

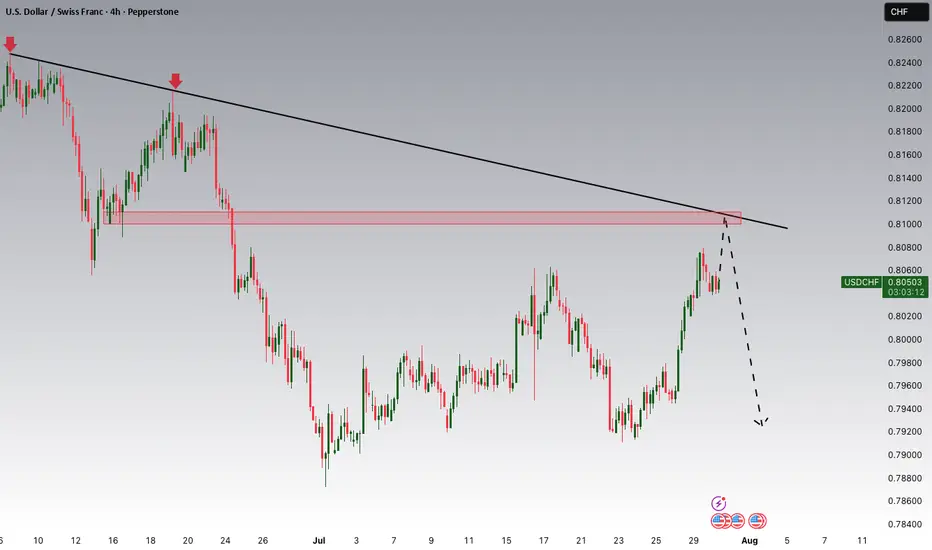
USDCHF Potential DownsidesHey Traders, in today's trading session we are monitoring USDCHF for a selling opportunity around 0.81000 zone, USDCHF is trading in a downtrend and currently is in a correction phase in which it is approaching the trend at 0.81000 support and resistance area.
Trade safe, Joe.
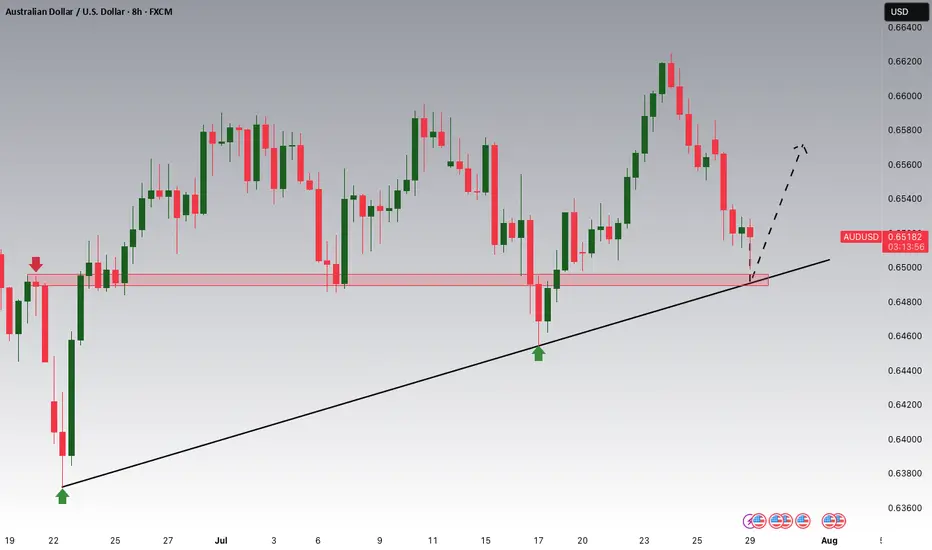
AUDUSD Potential UpsidesHey Traders, in today's trading session we are monitoring AUDUSD for a buying opportunity around 0.64900 zone, AUDUSD is trading in an uptrend and currently is in a correction phase in which it is approaching the trend at 0.64900 support and resistance area.
Trade safe, Joe.
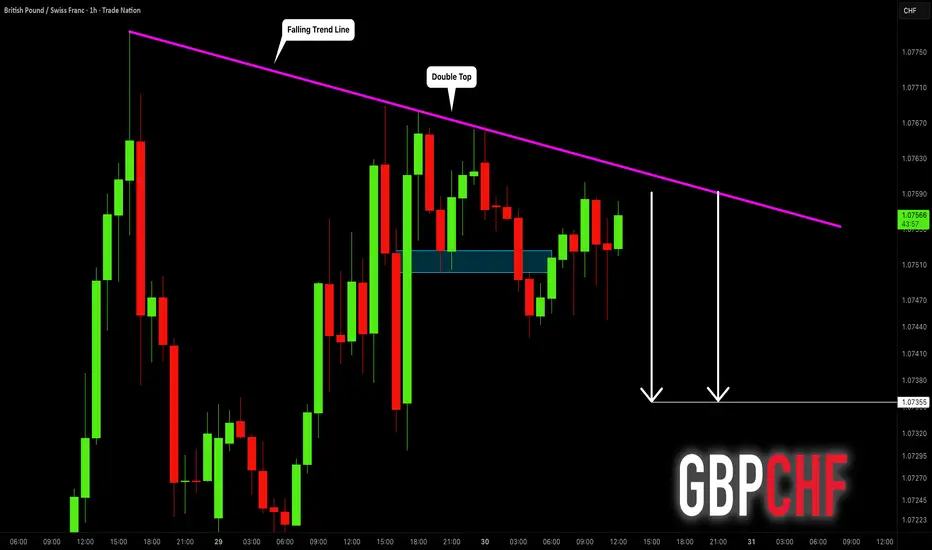
GBPCHF: Another Bearish Signal?! 🇬🇧🇨🇭
Quick update for GBPCHF.
We discussed a strong bearish confirmation yesterday.
Today, we have one more.
The price formed a double top after a test of a strong intraday
falling trend line.
Its neckline was broken this morning.
I expect a retracement to 1.0735
❤️Please, support my work with like, thank you!❤️
I am part of Trade Nation's Influencer program and receive a monthly fee for using their TradingView charts in my analysis.
BTCUSD Analysis : Blue Ray + MMC Bullish Scenario + Target Zone🟢 Today’s BTCUSD Analysis (MMC) – Strategic Insight into Institutional Behavior 💪
📊 Chart Breakdown: Understanding Price Through MMC
This 4H BTCUSD chart highlights critical behavior using Mirror Market Concepts (MMC) — where smart money traps, fakes, and flips market participants to create directional moves. Let’s break down the scenario:
🔸 1. Fakeout Zone – Smart Money Trap
Price initially surged to a local high, triggering a bullish fakeout, as shown in the green rectangle.
This move is designed to lure in breakout buyers above resistance, only to reverse sharply.
The sudden drop confirms smart money liquidation, catching retail longs off-guard.
A perfect example of a liquidity grab before shifting back into range.
📌 Fakeouts often mark the beginning of a new range or reversal setup in MMC methodology.
🔸 2. Blue Ray – Trend Continuation Structure
The consolidation after the fakeout forms the Blue Ray pattern, a recognizable trend continuation framework.
This structure signals smart money’s accumulation or re-accumulation phase.
Note how the price oscillates within the pattern, creating both lower highs and higher lows.
These compressions usually lead to explosive moves, either up or down, depending on liquidity build-up.
🔸 3. QFL – Quantity Following Line Event
Price briefly dips below the QFL level — another engineered stop-hunt to shake out premature longs and trap breakout sellers.
The reaction afterward shows strong buyer defense, confirming hidden demand.
MMC traders recognize this zone as a fake breakdown, setting up for the next trend wave.
🔸 4. Central Reversal Zone – The Decision Area
We’re currently hovering around the Central Reversal Zone, a key level of decision-making.
This is where liquidity from both buyers and sellers meets, making it a high-volatility zone.
Price could either:
(Scenario 1) Reject and fall lower to retest the trendline zone (marked with label 1).
(Scenario 2) Break above minor resistance and head toward the Next Reversal Zone (marked with label 2).
This structure aligns with MMC’s "Trap – Absorb – Break" cycle.
🔸 5. Major & Minor Resistance
Above the current price lies:
Minor Resistance (~$120,000): Immediate zone to clear for bullish continuation.
Major Resistance (~$121,000): Strong institutional supply, could act as the final hurdle before reversal.
If price clears these, BTC will likely target the Next Reversal Zone (~$122,500–123,500) for the next MMC reaction or short-term top.
🧠 Strategic Trade Outlook (MMC Logic)
✅ Bullish Playbook (Scenario 2):
Entry: Break and retest above $120,000 (Minor Resistance)
Confirmation: Hold above Central Reversal Zone with impulse
Target: $122,500–123,500 (Next Reversal Zone)
Risk: Close below $117,500 invalidates idea
🔻 Bearish Playbook (Scenario 1):
Entry: Rejection from $119,500–120,000
Target: Trendline support or prior QFL (~$116,000–115,500)
Invalidation: Clean 4H close above $120,500
📐 Key Concepts in This Analysis
Fakeout Trap: Retail euphoria liquidation
QFL Sweep: Smart money’s liquidity grab below structure
Blue Ray: Compression structure before continuation
Reversal Zones: Institutional interest areas where reactions occur
SR Flip Zones: Level conversion confirms trend maturity
📈 Summary
BTCUSD is currently in a smart money-controlled environment, compressing near key structural levels. The next move will be large, and by applying MMC, we’re prepared for both bullish breakout and bearish retest scenarios.
Be patient — traps come before trends.

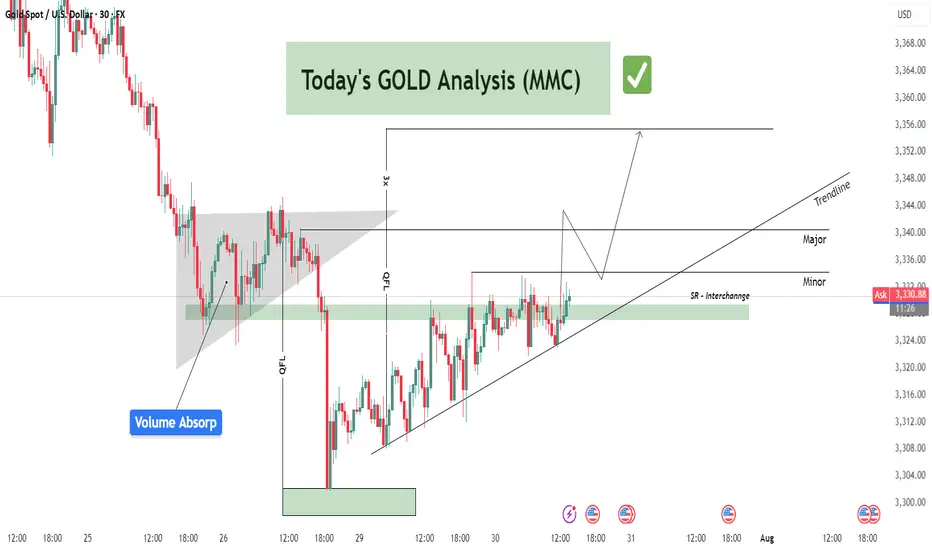
GOLD (XAUUSD) Analysis : Major Break + Bullish Setup + Target🟩 Today’s GOLD Analysis based on Volume Behavior, Smart Money Traps & Market Structure (MMC)
🔍 Chart Breakdown and MMC Concepts Explained:
1. Preceding Downtrend – Smart Money Trap Initiated
The chart begins with an extended downtrend, marking significant bearish pressure. However, deeper into the move, we notice price entering a Volume Absorption (VA) Zone — a key MMC signal where institutional orders quietly absorb aggressive retail selling.
This Volume Absorption Zone is highlighted on the left of the chart.
Smart money quietly positions longs here while inducing panic-selling from retail traders.
Wicks and indecision candles show early signs of sell exhaustion.
2. QFL Breakdown & Liquidity Sweep
The breakdown from the QFL (Quick Flip Level) is another hallmark of MMC behavior. The market intentionally breaks previous lows to trigger stop-loss clusters — known as a liquidity sweep or stop-hunt.
Price aggressively drops to a well-marked demand zone.
Massive bullish reaction from this zone confirms that smart money has completed accumulation.
The QFL move is not a true breakout, but a trap, designed to mislead retail into chasing shorts.
3. Demand Zone Reaction – Shift in Momentum
Price finds support at the demand zone (highlighted in green) and starts forming higher lows. This transition from lower lows to higher lows is a structural confirmation of market reversal.
Buyers have regained control.
Large bullish candles and wick rejections at key levels signal institutional entry.
4. SR Interchange Zone – Key MMC Confirmation
One of the most important zones on this chart is the SR Interchange area.
This level was previously resistance and is now acting as support — a concept known as support-resistance flip.
MMC teaches us that this is where smart money re-tests the breakout zone to trap late sellers and confirm the trend.
This zone is reinforced by:
Previous rejections
Retest with wicks
Alignment with ascending trendline support
5. Minor & Major Resistance Levels
Currently, price is attempting to break above a minor resistance at ~$3,330–3,332.
If it breaks, the next major target lies at the ~$3,340–3,345 level, marked on the chart.
This zone is crucial for short-term targets and may act as a profit-taking zone for early bulls.
Once this major resistance is cleared, the trendline projection suggests a continuation toward higher highs.
📐 Trendline Analysis
An ascending trendline is supporting price action. Each bounce off this line has led to higher lows — a clear sign of bullish intent.
Trendline + SR Interchange = Confluence zone
Traders should watch for bullish engulfing candles or strong wick rejections at this trendline area for re-entry or add-ons.
🧠 MMC Strategy Interpretation (Mirror Market Concepts)
This chart perfectly follows the MMC logic:
Trap retail sellers during the downtrend.
Absorb their volume at a key zone (Volume Absorp).
Sweep liquidity below QFL level.
Reverse structure with a shift to higher highs and higher lows.
Interchange SR zone to test buyers' strength.
Continue trend post-confirmation with breakout above resistance.
This is the classic "trap-to-trend" sequence smart money uses repeatedly in gold and other volatile markets.
✅ Trade Setup Summary:
Bias: Strongly Bullish (based on market structure shift)
Entry #1: Pullback into SR Interchange (ideal if price rejects 3,326–3,328)
Entry #2: Break and retest of Minor Resistance (3,332–3,334)
Targets:
TP1: 3,340 (Major Resistance)
TP2: 3,345–3,350 (Projection based on breakout path)
Invalidation: Clean break below trendline and demand zone (~3,318)
🧭 Final Words for Traders:
Gold is currently positioned at a critical junction where structure, volume, and institutional behavior all align. If you're following MMC strategies, this is a textbook scenario:
Trap ✅
Absorption ✅
Structure Shift ✅
Trendline Support ✅
SR Interchange ✅
Now, we wait for confirmation and execute with discipline.
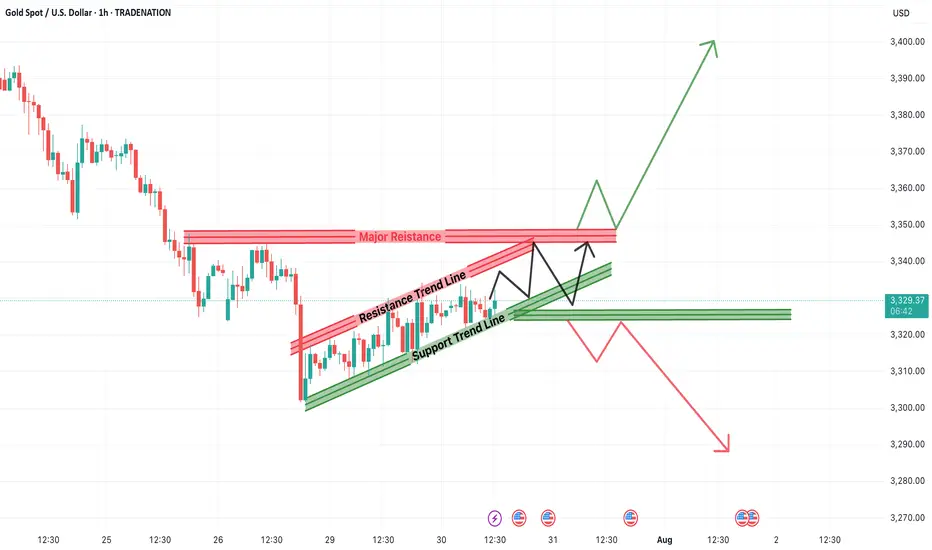
Will Gold Break Higher or Resume the Downtrend?Gold has been trading within a defined rising channel pattern, forming a short-term consolidation phase after a significant bearish leg. The current setup presents a critical inflection zone where Gold (XAUUSD) could either break out above the resistance trendline and major resistance zones or retrace and resume the prior downtrend.
Traders and investors should pay close attention to the price behavior around these key levels for possible high-probability trading opportunities.
📊 Technical Breakdown
1. Rising Channel Pattern
Gold has been bouncing between a support trend line and a resistance trend line, forming a rising channel. This indicates a controlled upward movement or short-term relief within a broader downtrend.
Support Trendline: Has been respected multiple times and offers a key reference point for bullish continuation.
Resistance Trendline: Acting as a cap on the short-term rallies.
This pattern represents a state of consolidation and indecision, often preceding a strong breakout in either direction.
2. Major Resistance Zone Ahead
The region around $3,345–$3,355 is stacked with:
Previous supply zones.
Confluence of the channel resistance and historical price rejection.
Psychological level near $3,350.
This zone is the make-or-break point for bulls. A successful breakout above this resistance could open the doors for a strong bullish continuation targeting levels such as:
$3,370
$3,390
$3,400+
But without a convincing close above this zone, bullish attempts may get rejected, resulting in a pullback or even breakdown.
3. Immediate Support Zone
On the downside, $3,320–$3,325 is a key short-term support level:
Aligned with the lower boundary of the channel.
Previous breakout retest zone.
Demand area observed in past bounces.
If this zone fails to hold, Gold could witness a strong decline, with potential targets at:
$3,310
$3,290
$3,275
🧠 Two Scenarios for Traders
✅ Bullish Breakout Scenario:
Trigger: Price breaks above $3,355 and sustains.
Retest Opportunity: If price comes back to test the breakout zone with a bullish engulfing candle or pin bar, it can serve as confirmation.
Target Zones: $3,370 / $3,390 / $3,400+
Stop Loss: Below the breakout point or recent higher low inside the channel (~$3,320)
❌ Bearish Breakdown Scenario:
Trigger: Breakdown of the support trendline and close below $3,320.
Confirmation: A bearish retest or continuation candle adds strength to the setup.
Target Zones: $3,310 / $3,290 / $3,275
Stop Loss: Above $3,335 (recent high)
📝 Final Thoughts
The XAUUSD 1H chart is setting up for a volatile move as price action coils between strong support and resistance. The rising channel within the larger downtrend makes this an ideal setup for both breakout traders and trend followers.
For bullish traders, the best entry lies above the resistance trendline, ideally after a retest. For bearish traders, a breakdown below the support line confirms downside momentum continuation.
In either direction, a clear break from this consolidation channel is likely to deliver a fast, directional move. Patience is key—wait for a clean breakout or breakdown before entering large positions.
=================================================================
Disclosure: I am part of Trade Nation's Influencer program and receive a monthly fee for using their TradingView charts in my analysis.
=================================================================
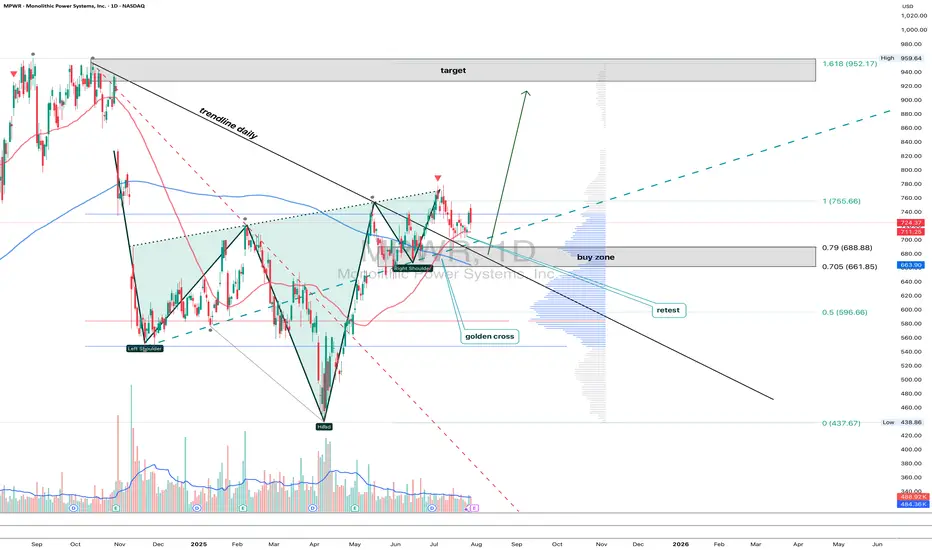
MPWR 1D: shoulders are squared and the battery's still fullMonolithic Power Systems broke out of a long-term descending trendline after completing a clean inverse head and shoulders. Now the price is pulling back into the 705–688 zone — a textbook retest area that combines the neckline, the 0.705–0.79 Fib levels, and a major volume shelf. Add to that a golden cross (EMA50 crossing EMA200 from below) and we have a solid technical foundation for continuation. Volume on the pullback is low, indicating no panic, just rotation. If 688 holds, the next levels to watch are 755.66 and 952.17 — the latter being the 1.618 Fib extension. Tactical setup: look for a reversal signal between 705–688, with a stop just below 661. As long as price holds this zone, the bullish structure remains intact.
Fundamentally, MPWR remains one of the strongest names in the semiconductor space. With over $1.5B in annual revenue and industry-leading margins, the company continues to see strong demand from data center and EV sectors. In its latest report, management highlighted accelerating orders from Tier‑1 manufacturers. The balance sheet is clean, with zero debt, and ongoing buybacks provide downside support. In a sector full of volatility, MPWR stands out with both structural reliability and technical clarity - making it a strong candidate for long-term positioning.
If this textbook pattern plays out, the train’s just leaving the station. The best seat is usually the one taken before the doors close.
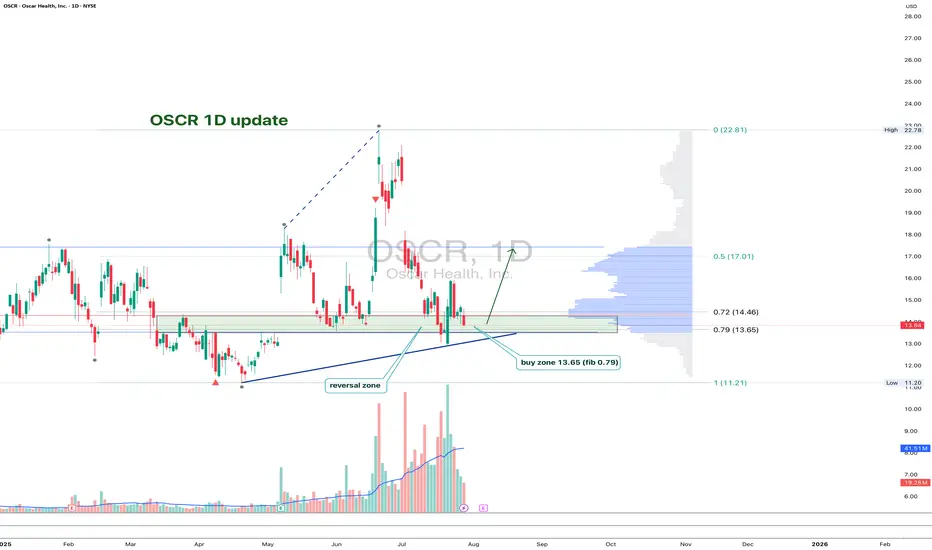
OSCR: back to support and now it’s decision timeAfter the recent impulse move, OSCR has pulled back to a key support zone around 13.65. That area aligns with the 0.79 Fib retracement, a horizontal level from spring, and a rising trendline that has already triggered reversals in the past. The structure is still intact, and buyers are testing the level again. If support holds and we get a bullish confirmation, the next target is 17.01, followed by a potential breakout toward the high at 22.81.
Volume remains elevated, the overall structure is healthy, and the correction is controlled. A break below 13.00 would invalidate the setup - until then, it’s a clean, high-reward zone with tight risk.
Fundamentally, Oscar Health has revised its 2025 guidance: revenue is expected in the $12–12.2B range, with operating losses projected between $200M and $300M. Despite softening topline growth, earnings per share are improving, and investor sentiment has been shifting. Technical strength is also reflected in the recent rise in RS Rating to 93, confirming that the stock is showing relative leadership even as the market cools.
This is one of those setups where both technicals and narrative are aligning - now we just need confirmation from the chart.
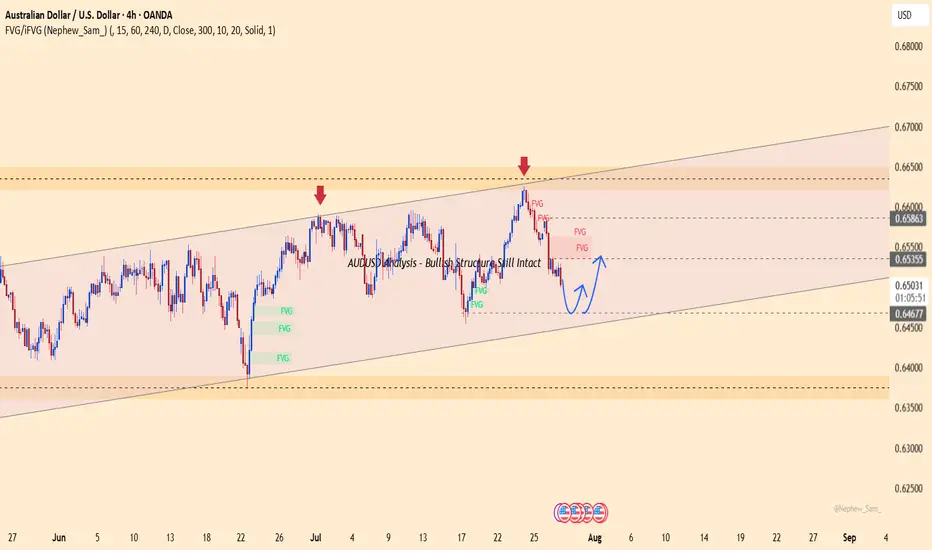
AUDUSD Analysis – Bullish Structure Still IntactAUDUSD is trading within a clear ascending channel on the H4 chart. After dropping from the FVG zone around 0.65800, price has reacted well to the lower boundary support near 0.64650.
Currently, price action suggests the potential formation of a short-term bottom. If this level holds and the pair rebounds, the next target could be the red FVG zone near 0.65400.
Recent Supporting News:
U.S. consumer confidence slightly weakened, causing the dollar to cool off — offering technical rebound support for AUD.
Trading Strategy:
Prefer short-term Buys near 0.64650 if a confirmed bounce appears, with target around 0.65400. Be cautious if price breaks below the ascending channel.
Do you think AUD will continue to rise within this bullish channel?
XAUUSD – Is gold getting ready to bounce?Right now, gold is reacting around the 3,280 support zone after breaking down from its previous ascending channel. While the broader trend is still under bearish pressure, the recently released JOLTS data came in lower than expected, signaling that the U.S. labor market may be cooling — a mildly positive sign for gold.
From a technical view, price is showing signs of forming a short-term bottom near 3,229 and is starting to rebound. If gold can hold above this support and break through 3,339, a recovery toward the 3,360–3,400 zone could unfold.
That said, this bounce is likely just a technical correction. Without more bearish news for the dollar, gold still risks being rejected around the FVG area and heading lower again.
Trading idea: Consider short-term Buy opportunities if price stays above 3,280 and forms a clear reversal pattern. Stop-loss below 3,229. Short-term targets: 3,339–3,360.
What about you? Leaning towards buying the dip or staying with the downtrend?

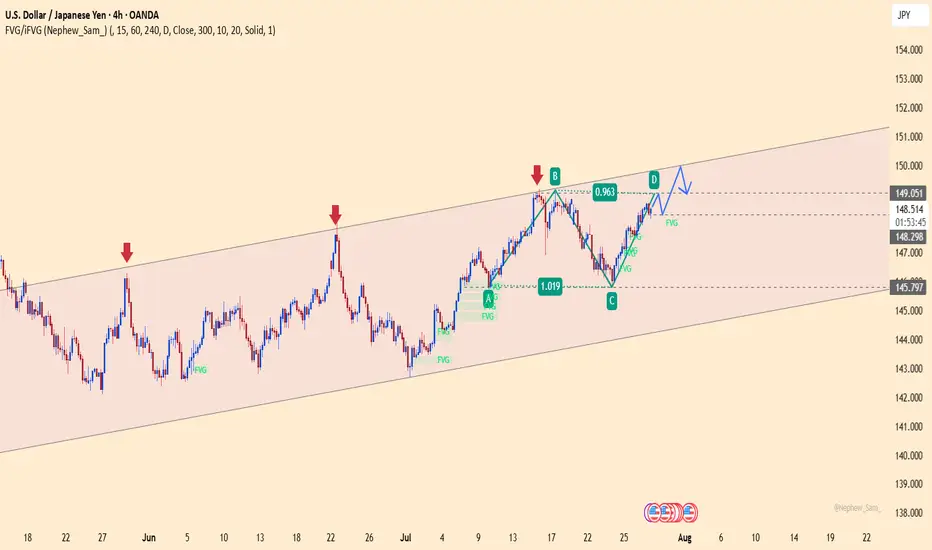
USDJPY – Bearish Pressure Builds Near Channel TopUSDJPY is approaching strong resistance around 149.900, a level that has repeatedly triggered price rejections. The ABCD structure suggests the current bullish correction may be nearing completion. If price fails to break above this zone, selling pressure could emerge.
On the news front, Japan’s core inflation remains elevated, reinforcing expectations that the BOJ will maintain its current stance. Meanwhile, the U.S. dollar is losing momentum after a series of mixed economic data releases.
Strategy: Consider SELL opportunities if clear reversal signals appear near 149.900. A short-term target lies around the 148.200 support zone. A confirmed break below this level could signal the start of a deeper bearish move.