Gold Extends Gains Post-CPI | All Eyes on PPI for the Next Move XAUUSD – Gold Extends Gains Post-CPI | All Eyes on PPI for the Next Move
🌍 Macro Pulse: CPI Sparks Momentum, But Will PPI Sustain It?
Gold surged following softer-than-expected US inflation data on Tuesday, with the CPI rising just 0.1% MoM and 2.4% YoY—both below forecasts. This triggered a broad sell-off in the USD, a pullback in Treasury yields, and a renewed appetite for non-yielding safe havens like gold.
Markets are now increasingly pricing in a rate cut by the Fed in September, adding further fuel to the rally. However, Wednesday’s US PPI data could either reinforce this bullish sentiment or reverse it sharply.
📉 Technical Landscape – H1 & H4 View
🔹 Trend Bias
The bullish structure remains intact, with price carving out higher highs and higher lows since the 3312 level. The recent breakout above 3370 confirms bullish momentum.
🔹 Price Channels
Gold continues to track within a defined ascending channel. A potential retest of the lower trendline near 3345–3350 could provide a dip-buying opportunity.
🔹 EMA Structure
The price trades comfortably above the 13, 34, 89, and 200 EMAs.
Short-term EMA crossovers are supportive of continued upside.
🔹 Critical Resistance Ahead: 3392 – 3395
A key technical zone combining Fibonacci extension levels and recent rejection wicks. A decisive break or rejection here will set the tone for the next 48 hours.
🧠 Market Psychology & PPI Scenarios
The market is currently optimistic, but still cautious. The PPI report due later today will likely serve as the next directional trigger:
If PPI prints below estimates → reinforces disinflation narrative → potential breakout above 3,400 with upside targets towards 3,420+.
If PPI comes in hot → raises concerns about sticky input costs → possible short-term reversal or consolidation.
Expect volatility to spike during the New York session.
🎯 Today’s Tactical Trade Setups – 12 June
🟢 Buy Zone: 3324 – 3322
Stop Loss: 3318
Take Profit Targets: 3330 – 3334 – 3338 – 3342 – 3346 – 3350
🟢 Buy Scalp Zone: 3337 – 3335
SL: 3330
TPs: 3341 – 3345 – 3350 – 3354 – 3360 – 3370 – 3380
🔴 Sell Zone: 3392 – 3394
Stop Loss: 3398
Take Profit Targets: 3388 – 3384 – 3380 – 3375 – 3370 – 3360 – 3350
✅ Final Take
Gold bulls are in control, but the PPI data will likely dictate whether momentum continues or stalls. With key resistance just ahead and macro risk on the table, this is not the time to trade blindly.
🧭 Strategy Tip: Let price confirm the reaction to PPI. Don’t pre-position into volatility. Play the breakout or the fade—but wait for clarity.
Technical Analysis

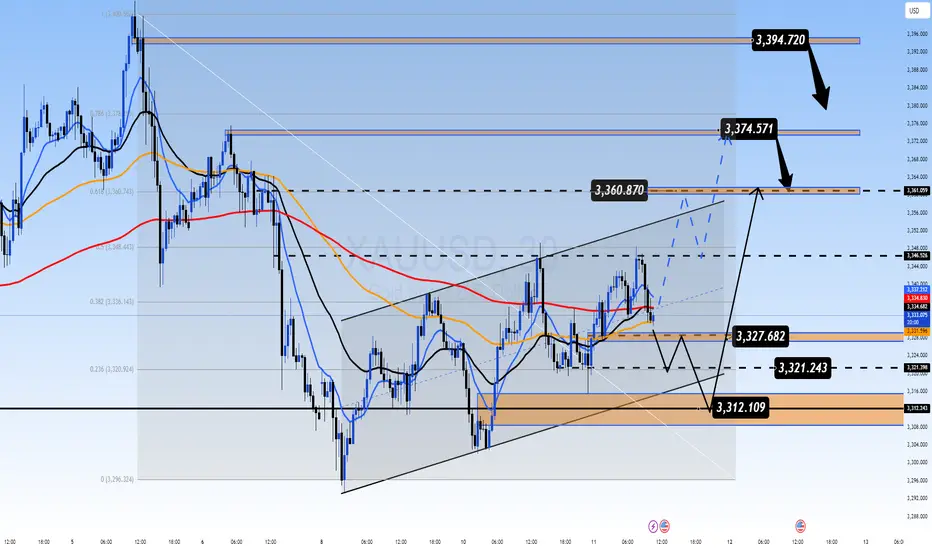
Gold Coiling in Rising Wedge Ahead of CPI: Breakout Imminent?XAUUSD – Gold Coiling in Rising Wedge Ahead of CPI: Breakout Imminent?
Gold (XAUUSD) is compressing within a well-defined rising wedge pattern on the 1H chart, signaling that a decisive move is near. With the U.S. CPI report due on June 12th, traders should prepare for volatility driven by macroeconomic catalysts. Whether gold breaks higher or reverses depends on how the market digests inflation data.
🌍 Macro Backdrop: All Eyes on Inflation
📌 U.S. CPI (June 12): A softer-than-expected reading could revive Fed rate cut expectations and send gold higher. A hotter-than-expected CPI could strengthen the U.S. dollar and Treasury yields, putting pressure on gold.
📌 U.S.–China Trade Sentiment: Diplomatic progress in trade talks reduces safe-haven demand in the short term, weakening gold's defensive appeal.
📌 DXY & Bond Yields: A breakout in DXY or a sharp rise in U.S. bond yields post-CPI may lead to a corrective leg lower in XAUUSD.
📈 Technical Overview – Multi-Layered Structure
Pattern: Gold is forming a rising wedge between higher lows and converging highs, typical of breakout scenarios.
Fibonacci Levels (retracement from 3,400 to 3,296):
0.382: 3,336 – intermediate support
0.618: 3,360 – significant resistance, near current swing highs
Moving Averages:
Price is currently above EMA34 and EMA89
Struggling below EMA200 (red), which acts as dynamic resistance
FVG Liquidity Zone: An open Fair Value Gap between 3,360 – 3,374 could act as a magnet before any reversal.
🎯 Trade Strategy Scenarios
🟢 Buy Scenario – Bounce from Support Zone
Entry: 3314 – 3312 | Stop-Loss: 3308 | Take-Profit: 3318, 3322, 3326, 3330, 3335, 3340
Ideal if CPI comes in lower than expected or aligns with a bullish technical rejection from wedge support.
🔴 Sell Scenario – Rejection from Resistance Zone
Entry: 3374 – 3376 | Stop-Loss: 3380 | Take-Profit: 3370, 3366, 3362, 3358, 3352, 3348, 3340
Valid if price taps into the upper liquidity zone (3,374–3,394) and fails to break, especially on CPI surprise to the upside.
🧠 Tactical Conclusion
A dovish CPI → favors BUY setup off lower wedge support
A hawkish CPI → favors SELL near upper resistance and liquidity zones
📌 The market is compressing and gearing up for a breakout. Patience is key — wait for confirmation at key zones and manage risk precisely.
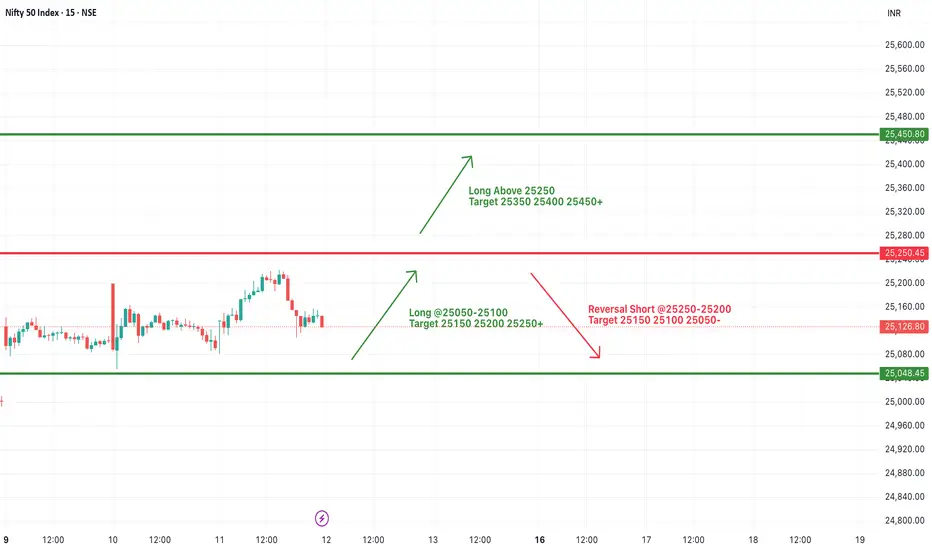
#NIFTY Intraday Support and Resistance Levels - 12/06/2025Today, a gap-up opening is expected in Nifty near the 25250 level. If Nifty sustains above this zone, we may see bullish momentum extending toward the targets of 25350, 25400, and potentially 25450+ during the session.
However, if Nifty fails to hold above 25250 and begins reversing below 25200, it could trigger a pullback move. A reversal short opportunity may arise in the 25250–25200 range with potential downside targets of 25150, 25100, and 25050.
Overall sentiment remains bullish above 25250, but volatility is likely near resistance levels. Traders are advised to keep tight stop-losses and trail profits cautiously, as the market may remain range-bound with occasional spikes.
[INTRADAY] #BANKNIFTY PE & CE Levels(12/06/2025)Today, a gap-up opening is expected in Bank Nifty near the 56550–56600 zone. If the index manages to sustain above this range, it may trigger an upside move toward 56750, 56850, and 56950 levels. A further breakout above 57050 could extend the bullish rally toward 57250, 57350, and possibly 57450+ during the session.
However, if Bank Nifty fails to hold above 56550 and begins to trade below 56450, a downward move could unfold toward 56250, 56150, and 56050 levels. Any sustained weakness may increase selling pressure, dragging the index further down intraday.

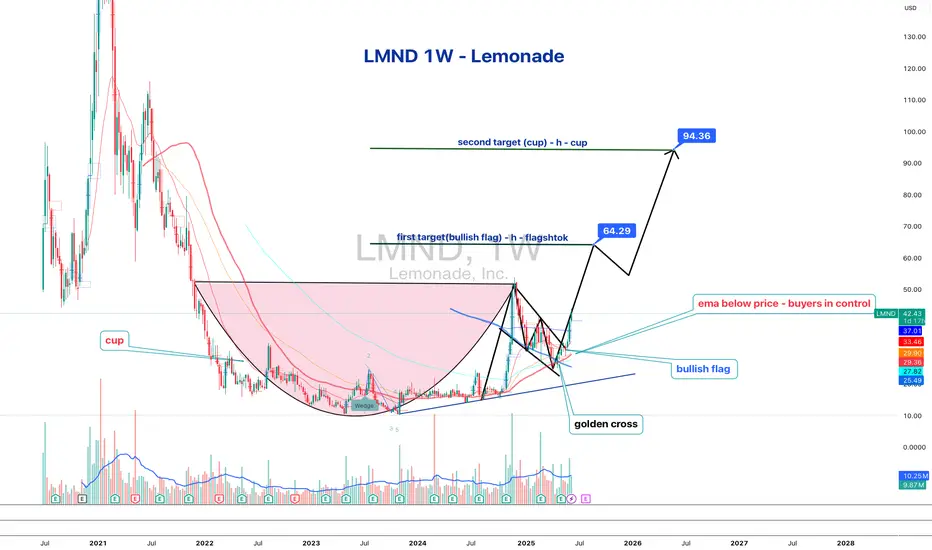
Lemonade Inc.: Breakout in Motion — Cup, Flag, and No BrakesLemonade Inc. (LMND) is accelerating after a clean breakout from a textbook cup with handle pattern, where the handle formed as a tight bullish flag. The breakout occurred around $32, and since then, price action has been sharp, controlled, and uncorrected — currently trading at $42.42 with buyers clearly in charge.
On the fundamental side, LMND is moving through a recovery phase: operational losses are narrowing, revenue is stabilizing, and the company is aggressively leveraging AI to automate its insurance processes. Expansion into Europe continues, and institutional interest is visibly rising — confirmed by volume building alongside price. Within the insuretech sector, LMND is starting to look like a comeback story rather than a cautionary tale.
Technically, the setup remains strong:
– Golden Cross confirmed (EMA50 crossing EMA200)
– EMA50/100/200 all below price — bullish structure firmly intact
– Volume expanding on up-days — healthy confirmation
– RSI hovering in the 60–65 range — momentum is intact, no signs of exhaustion
Targets remain aligned with the structure:
– tp1 = $64 — measured move from the flag
– tp2 = $94 — full realization of the cup pattern
Tactically, this is no longer a “wait and see” setup — the move is in progress. No correction so far, only continuation. Momentum traders may consider entries into strength. Above $45, the move could accelerate further as more participants recognize the structure.
LMND is showing technical and fundamental alignment — confirmed breakout, improving narrative, and strong trend structure. While the impulse holds, this chart favors continuation, not hesitation.
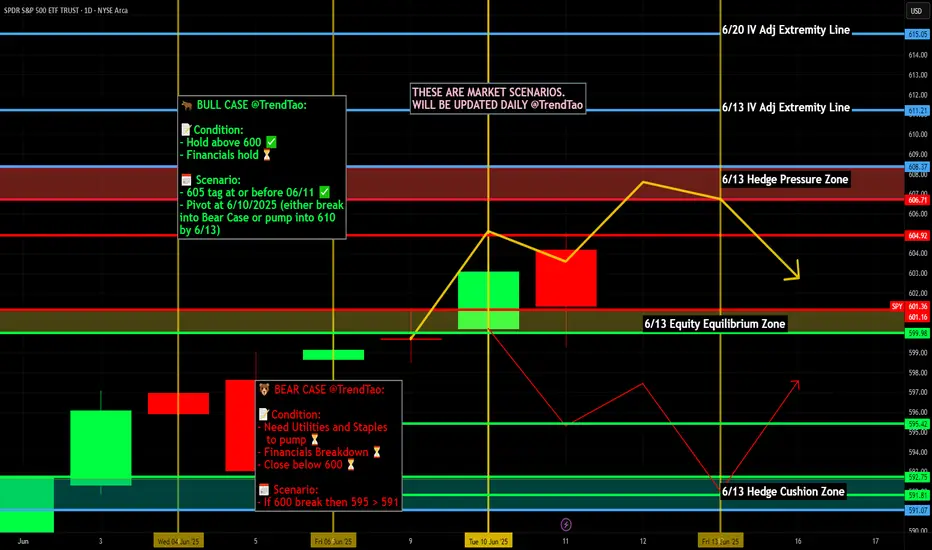
Nightly $SPY / $SPX Scenarios for June 12, 2025🔮 Nightly AMEX:SPY / SP:SPX Scenarios for June 12, 2025 🔮
🌍 Market-Moving News 🌍
💱 Dollar Slides on Trade Truce Hopes & Fed Outlook
The U.S. dollar dropped 0.4%—its lowest level since April 22—after President Trump signaled flexibility on a July 8 trade deadline and U.S.–China talks showed renewed progress, boosting expectations for Fed rate cuts
📊 S&P Shiller CAPE Hints at Overvaluation Risk
Stocks and bonds rallied following rebound, but valuation metrics flash caution: the S&P 500 now sits in the 94th percentile of Shiller CAPE, and equity risk premium has dropped to zero. Analysts warn these levels often precede corrections
🛢️ Oil Holds at Seven-Week Highs
Oil prices remain near seven-week highs (~$66–67/barrel), supported by gradual OPEC+ output increases and hopes that easing trade tensions will aid demand
📈 CPI Cools Again, Bonds Climb
U.S. consumer inflation rose just 0.1% in May (2.4% YoY), easing expectations for tighter Fed policy. Consequently, Treasury yields softened and bond markets outperformed equities
📊 Key Data Releases 📊
📅 Thursday, June 12:
8:30 AM ET – Producer Price Index (May)
An early gauge of inflation at the wholesale level—may reinforce the cooling trend seen in CPI.
8:30 AM ET – Initial & Continuing Jobless Claims
Weekly updates on unemployment filings. Key to monitor for labor-market tightening or softening.
⚠️ Disclaimer:
This report is for educational and informational purposes only—it does not constitute financial advice. Always consult a licensed financial advisor before making investment decisions.
📌 #trading #stockmarket #economy #news #trendtao #charting #technicalanalysis
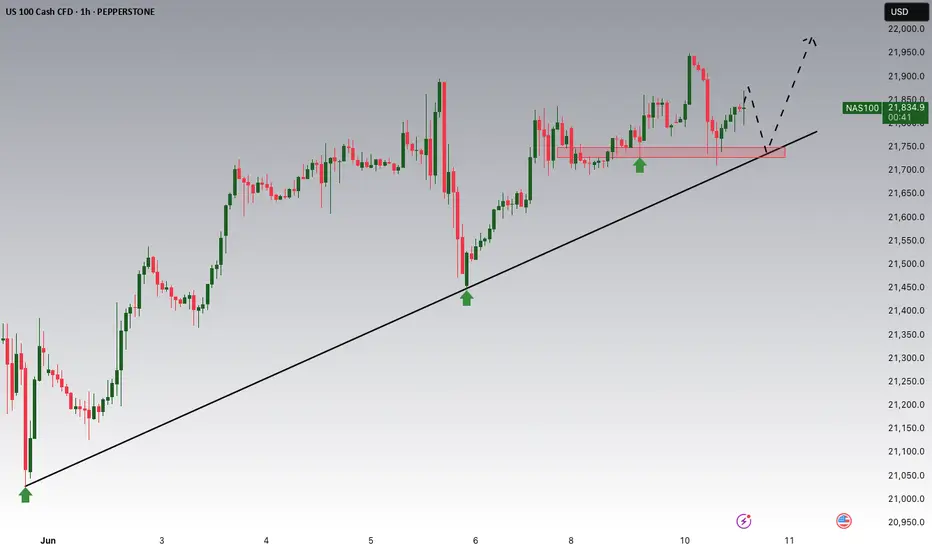
NASDAQ Potential UpsidesHey Traders, in today's trading session we are monitoring NAS100 for a buying opportunity around 21,700 zone, NASDAQ is trading in an uptrend and currently is in a correction phase in which it is approaching the trend at 21,700 support and resistance area.
Trade safe, Joe.
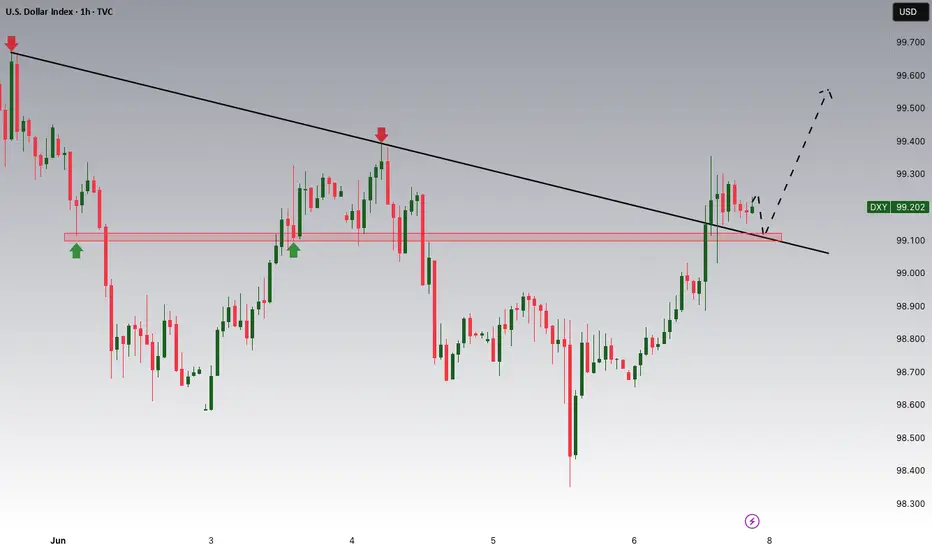
DXY Ready to Reload? Eyes on 99.100 as Tariff Tensions Ease!!Hey Traders, In tomorrow's trading session, we're closely monitoring the DXY for a potential buying opportunity around the 99.100 zone. After trending lower for a while, the dollar index has successfully broken out of its downtrend and is now entering a corrective phase.
We’re watching the 99.100 support/resistance area closely, as it aligns with a key retracement level making it a strong candidate for a bullish reaction.
On the fundamental side, Friday's NFP data came in slightly above expectations, which is typically USD-positive. In addition, recent Trump-led de-escalation in U.S.-China tariff tensions is another supportive factor for the dollar.
Trade safe, Joe.
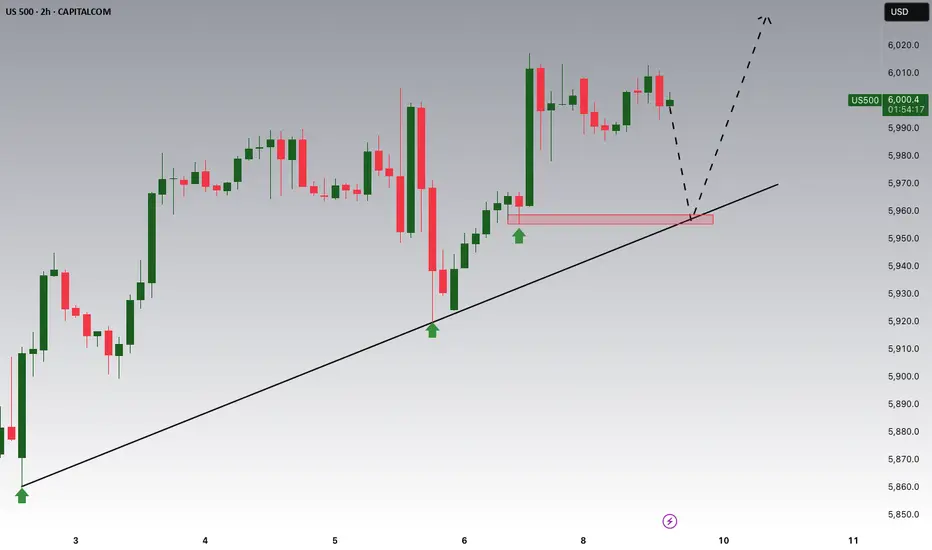
S&P500 is Nearing an Important Support of 5,960!!!Hey Traders, in today's trading session we are monitoring US500 for a buying opportunity around 5,960 zone, US500 is trading in an uptrend and currently is in a correction phase in which it is approaching the trend at 5,960 support and resistance area.
Trade safe, Joe.
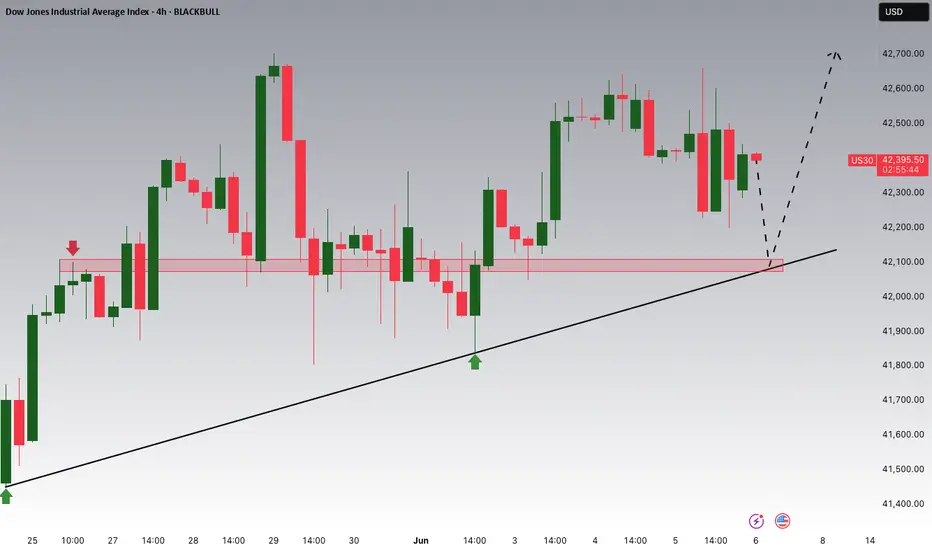
Dow Jones Potential UpsidesHey Traders, in today's trading session we are monitoring US30 for a buying opportunity around 42,100 zone, US30 is trading in an uptrend and currently is in a correction phase in which it is approaching the trend at 42,100 support and resistance area.
Trade safe, Joe.
BTCUSDT – Strategy and Trend Probabilities for 2025In my opinion, Bitcoin (BTC) has become less interesting — there isn’t much room left for significant movement, and most of the “cream” has already been skimmed off. However, since it's essentially the index of the crypto market, I’m sharing this trading idea for context - to show where we currently are and what scenarios might unfold.
The price is globally moving within an ascending channel.
A secondary triangle pattern is forming.
Within this triangle, we can see the outlines of an inverse head and shoulders pattern - or possibly a cup and handle - both aligning with the channel’s resistance.
Potential scenarios:
a) Price breaks out of the triangle.
b) Price moves toward the triangle’s support, forming another wave inside it.
c) Price moves to retest the main ascending channel’s support.
d) Price fluctuates within the central range of the channel.
There aren't many options, and none of them would break the primary trend. Altcoin movements will largely depend on BTC’s behavior.
Therefore, it’s crucial to build a trading strategy that considers both the likely and less likely (but possible) outcomes.
Looking at the broader picture:
The previous minor altseason (winter 2024) was short and weak, except for a few coins.
There was no real secondary altseason in spring 2025.
Statistically, summer tends to be quiet - due to holidays and so on.
The first two points contradicted the expectations of most traders - so we’ll see how things play out with the third. If there's no altseason in summer either, then logically, winter might turn out to be quite aggressive.

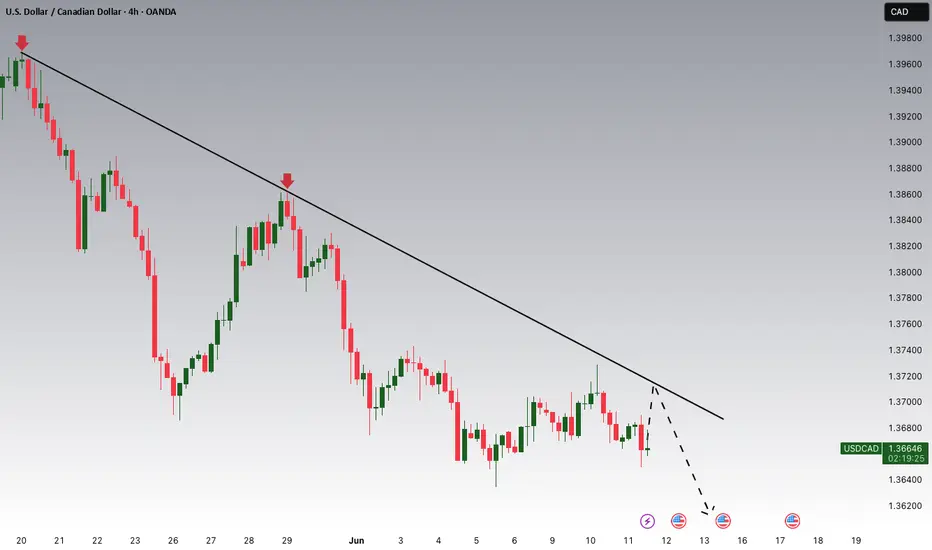
USDCAD Potential DownsidesHey Traders, in today's trading session we are monitoring USDCAD for a selling opportunity around 1.37100 zone, USDCAD is trading in a downtrend and currently is in a correction phase in which it is approaching the trend at 1.37100 support and resistance area.
Trade safe, Joe.
NZDJPY Potential UpsidesHey Traders, in today's trading session we are monitoring NZDJPY for a buying opportunity around 87.350 zone, NZDJPY is trading in an uptrend and currently is in a correction phase in which it is approaching the trend at 87.350 support and resistance area.
Trade safe, Joe.

Ethereum bulls are enjoying the momentAfter violating the upper side of the range, MARKETSCOM:ETHEREUM is now aiming for the 3000 zone. Will the buyers have enough steam to drag it there? Let's have a look.
CRYPTO:ETHUSD
Let us know what you think in the comments below.
Thank you.
77.3% of retail investor accounts lose money when trading CFDs with this provider. You should consider whether you understand how CFDs work and whether you can afford to take the high risk of losing your money. Past performance is not necessarily indicative of future results. The value of investments may fall as well as rise and the investor may not get back the amount initially invested. This content is not intended for nor applicable to residents of the UK. Cryptocurrency CFDs and spread bets are restricted in the UK for all retail clients.

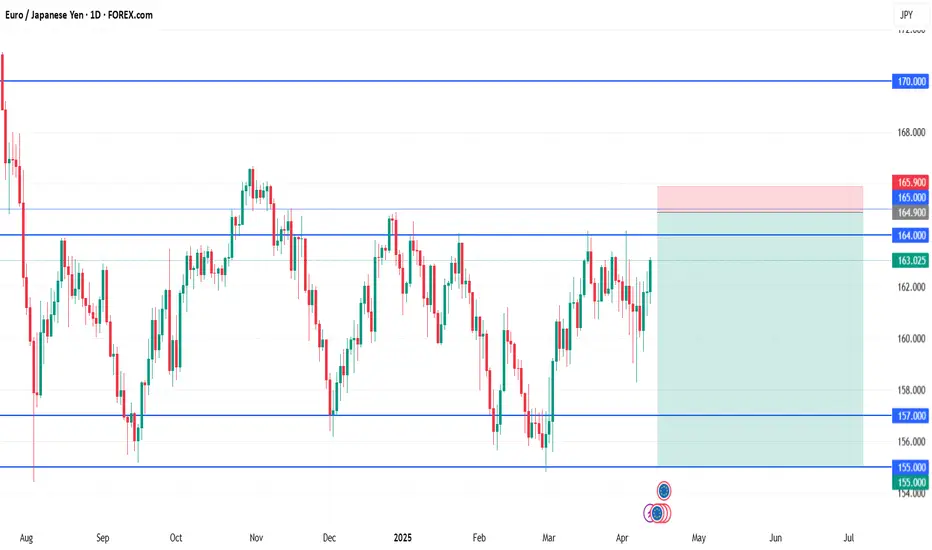
EUR/JPY Short🎯 Trade Setup Plan
👇 Aggressive Entry (Riskier)
Sell Limit: 164.90
SL: 165.90
TP1: 160.00
TP2: 157.00
TP3 (optional): 155.00
Use this only if you want to catch the wick, but recognize the higher chance of being swept.
✅ Conservative Entry (Recommended)
Wait for a daily candle close under 162.00 after touching 164. That confirms rejection.
Entry: On next day’s minor retest (e.g., 162.50–163.00)
SL: 165.50 (above recent highs)
TP1: 160.00
TP2: 157.00
TP3: 155.00
Risk: 1–2% depending on confirmation strength
📌 Optional Breakout Plan (In case resistance breaks cleanly)
Buy Stop: 165.60
SL: 164.30
TP: 170.00 (weekly resistance)
Use only if a strong daily close above 165 confirms breakout.
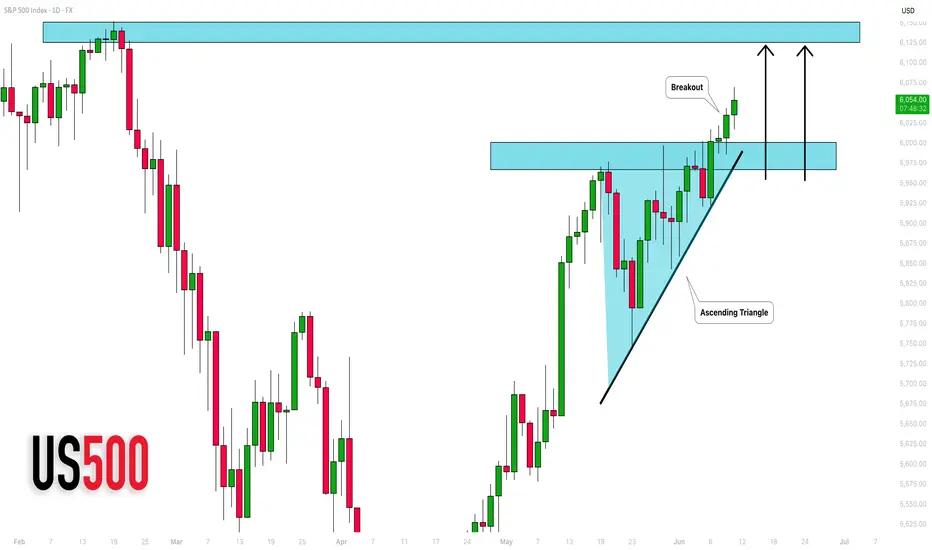
S&P500 INDEX (US500): More Growth Ahead
US500 broke and closed above a neckline of an ascending triangle
pattern on a daily time frame.
It is a strong bullish pattern that indicates a strong bullish interest.
With a high probability, buyers will push at least to 6124 resistance.
❤️Please, support my work with like, thank you!❤️
XAUUSD | 1H Chart Analysis | Uptrendurrently, Gold (XAUUSD) is showing bullish momentum after breaking previous market structure to the upside. Price has formed a clear Higher Low (HL) and Higher Highs (HH), indicating that short-term structure has shifted into an uptrend.
🔼 Key Technical Observations:
The previous LL (Lower Low) got broken, and price created a new HL, showing buyer pressure.
The bullish structure is supported by an ascending trendline.
Price is currently trading near PDH (Previous Day High) and approaching a key supply/resistance zone (highlighted in red).
RSI is still not in extreme zones but steadily climbing, showing strength in the current bullish move.
📊 Current Market Structure:
Shift from previous downtrend into short-term uptrend.
Formation of clear HL & HH.
Price respecting trendline support.
Clean bullish break of internal resistance levels.
📌 Potential Scenarios:
Scenario 1 (Bullish Continuation):
If price holds above the PDH and supply zone gets broken, we may see continuation toward TP1 and higher.
Scenario 2 (Rejection & Short-term Pullback):
If price faces strong rejection from the current supply zone, short-term retracement is possible toward the previous demand zones or trendline support.
Possible pullback zones: 3340 → 3320 → 3310 area.
✅ Bias: Short-Term Bullish
As long as price holds above the HL zone and trendline, bulls are in control. But keep an eye on price reaction around current supply zone for any signs of weakness or reversal.
Dollar Index Eyes FVG Breakout Ahead of CPIDXY 11/06 – Dollar Index Eyes FVG Breakout Ahead of CPI | Reversal Risk After 100.31?
The US Dollar Index (DXY) continues to consolidate within a rising channel on the H2 timeframe, with price tightening just ahead of a key macro event — the US CPI report. DXY is now approaching a critical Fair Value Gap (FVG) zone, where liquidity hunts and potential reversals become highly probable.
🌐 MACRO OUTLOOK & MARKET SENTIMENT
📌 US CPI (June 12):
The main macro driver for DXY this week.
A hotter-than-expected print → strengthens the Fed’s hawkish stance → DXY likely to spike.
A weaker-than-expected CPI → boosts rate cut expectations → downside pressure on DXY.
📌 Risk Sentiment:
Institutions are readjusting their exposure ahead of CPI and FOMC. This has caused DXY to hover near EMA89 — a sign of indecision.
📌 Cross-asset Flows (Bonds & Gold):
Treasury yields are stable, but surprises in CPI could lead to capital rotation between gold and USD, increasing volatility in XAUUSD and DXY simultaneously.
📈 TECHNICAL ANALYSIS
Trend Structure:
DXY is following a clean ascending channel on H2, with higher lows respecting the lower trendline.
EMA Confluence (13–34–89–200)
Price is consolidating near EMA89 and below EMA200 (99.40), forming a neutral short-term bias.
A clean breakout above EMA200 could trigger acceleration into the FVG zone.
Key FVG Zone (H2):
99.63 – 100.31 is an unfilled Fair Value Gap.
This zone may act as a magnet for price before any meaningful rejection or breakout.
Potential Reversal Area:
A rejection at 100.31 could trigger a sharp pullback toward the liquidity zone around 98.68.
🧠 STRATEGIC OUTLOOK
CPI will set the tone for DXY’s mid-term trend.
Watch the 99.63 – 100.31 FVG zone for liquidity sweeps and potential rejection.
Wait for confirmation, not prediction — especially in macro-sensitive environments.

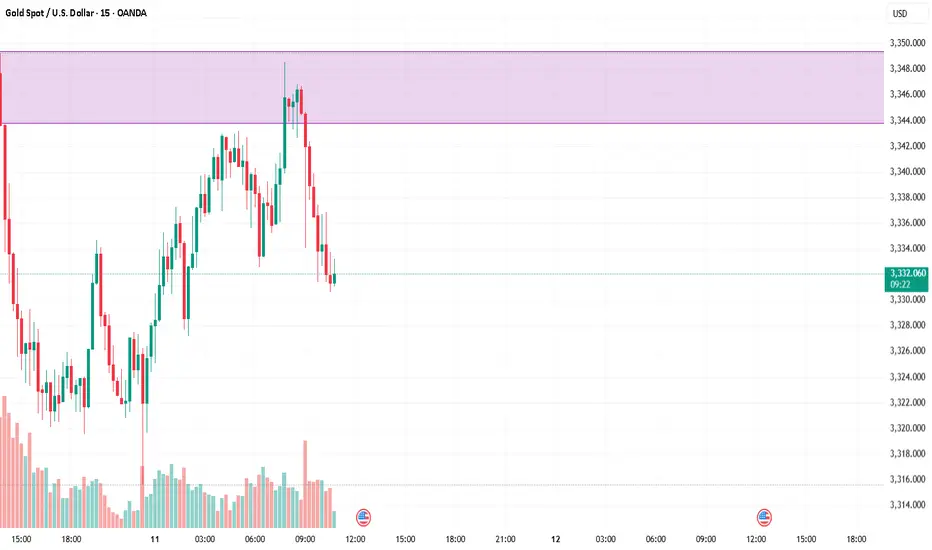
“Gold Eyes 4‑Hour Demand at $3,322” 11 June 2025Gold (XAU/USD) has consolidated near $3,332 after an SMC-style structure sweep above $3,338, which likely captured institutional liquidity before a clean CHoCH and pullback toward a key demand zone at $3,322–$3,328. This demand zone held firmly—on a bullish 4‑hour candle—indicating underlying strength.
Key technical confluences:
CHoCH above $3,322 confirms bullish structure.
Price above 200‑SMA and mid-Bollinger Band on 4H.
RSI (~55‑60) and MACD showing resumed bullish momentum.
✅ 4H Entry Strategy Breakdown
Bullish Retest
Wait for price to revisit $3,322–$3,328 with bullish candle formation → enter long.
SL just below $3,312; targets at $3,345 and then $3,355.
Breakout Option
If momentum pushes price above $3,353 resistance, follow the breakout with target zones extending to $3,365–$3,380.
Supply Rejection
Alternatively, watch for reversal patterns near $3,345–$3,353. A confirmed rejection opens a short trade down to $3,322.
Scalp Play
For quicker profits, scalp the bounce from the demand zone with tight stops and targets within the 4‑hour upper range.
Risk note: US CPI and trade headlines may inject volatility. Waiting for candle confirmation is critical to validate setups.
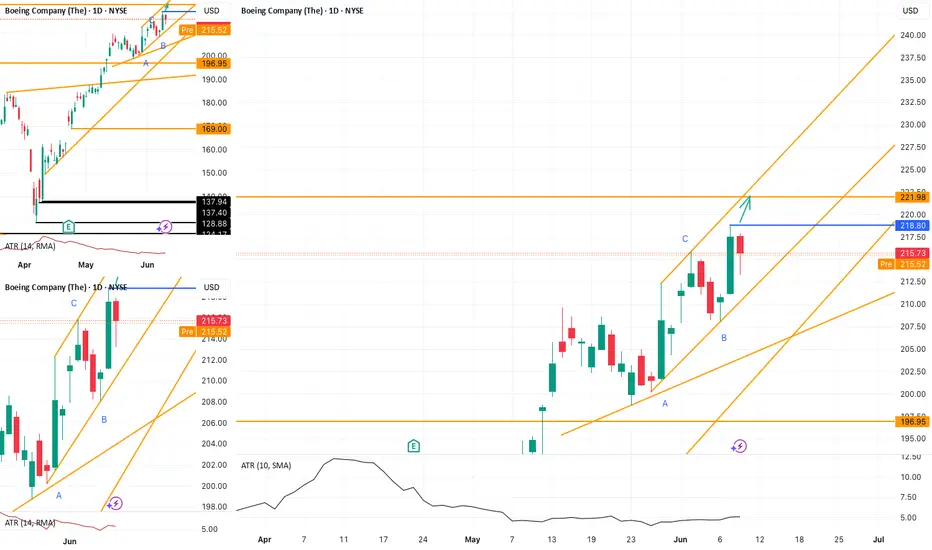
Boeing (BA): Watching for a Break Above 218.80NYSE:BA has a strong chance of breaking above the 218.80 level , with a potential move toward 221.98 .
I plan to enter 1 tick above 218.80, with a stop-loss based on the 5-minute ATR (period 10).
🔍 Technical Outlook:
BA is currently moving within an upward ABCD channel. The projected upside is capped by a strong resistance zone at 221.98 – a level derived from the daily chart and previous price action. The market may or may not react to it, but it’s a logical target within a solid risk-to-reward setup.
One aspect I particularly like about this setup is the market’s inability to close significantly below the previous pivot high at 215.80. This suggests underlying strength. If we see a confident move above resistance, the trade could be triggered with momentum.
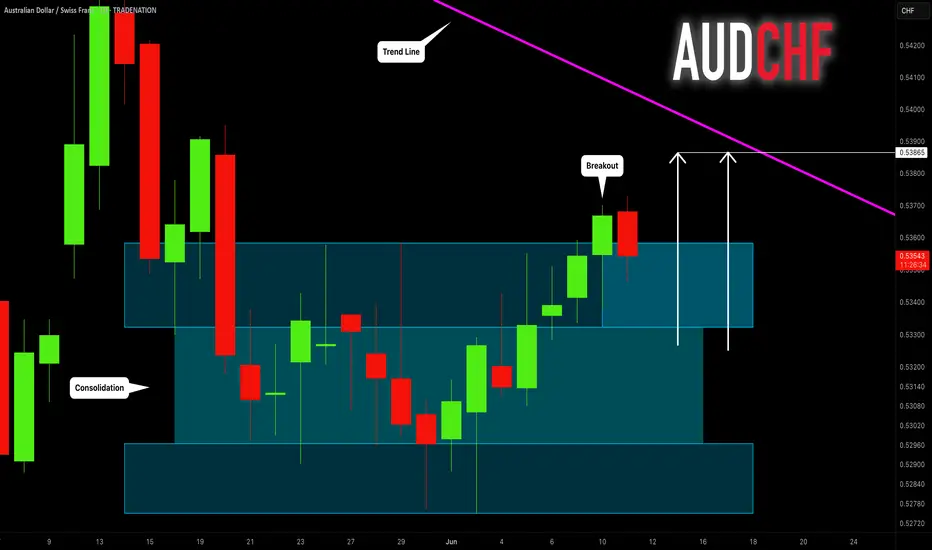
AUDCHF: Completed Consolidation 🇦🇺🇨🇭
AUDCHF completed a consolidation within a horizontal range
on a daily, breaking and closing above its resistance.
I believe that the pair may rise more and reach a historically
significant falling trend line.
Goal - 0.5386
❤️Please, support my work with like, thank you!❤️
I am part of Trade Nation's Influencer program and receive a monthly fee for using their TradingView charts in my analysis.
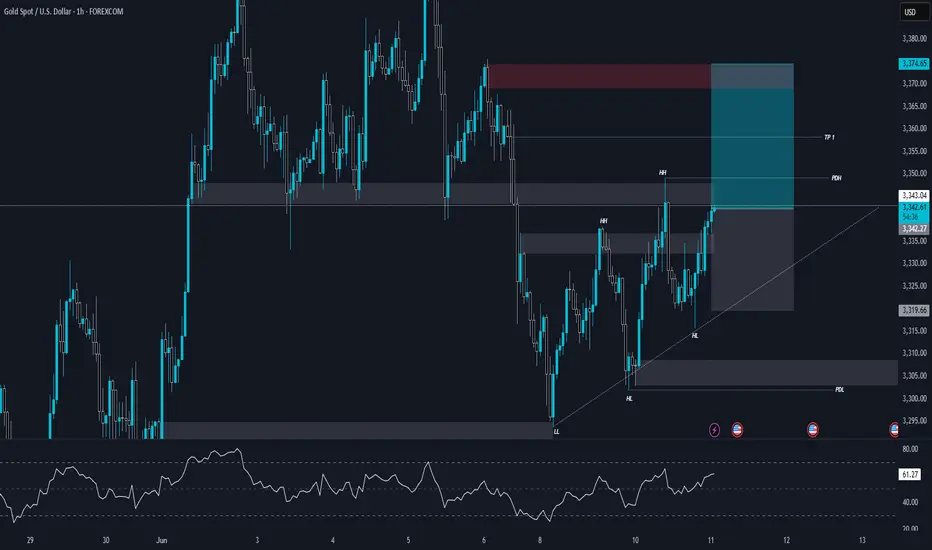
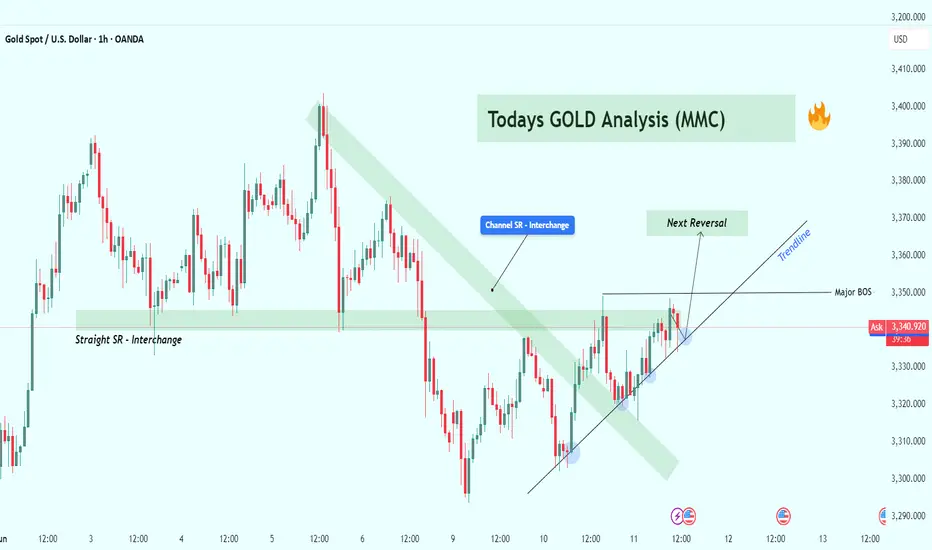
XAU/USD MMC Analysis – Structure Flip, Trendline + Target Zone📊 Market Sentiment and Price Structure Overview:
Gold has been navigating a highly structured range with multiple clear zones of support and resistance that have now started to break down in favor of a short-term bullish trend. The chart reflects a transition from a bearish descending channel to a potential bullish continuation pattern.
Today’s analysis is centered around three core ideas:
Market Structure Shift (Break of structure)
Support/Resistance Interchange (horizontal + channel)
Trendline Dynamics (bullish control)
Each of these plays a key role in shaping trade bias and decision-making.
🧱 1. Straight SR Interchange Zone (Key Historical Level):
Marked on the left side of the chart, this level has acted as both support and resistance over the last several days. Traders call this a “flip zone” — price often bounces off this area multiple times as buyers and sellers wrestle for dominance.
✅ Multiple touches indicate institutional interest.
🔄 This zone adds confluence to other structure zones, increasing its strength.
🧲 Price currently hovers near this level, suggesting indecision or a setup for a larger move.
📉 2. Descending Channel SR Flip – Confirmation of Shift:
The descending green channel served as a dynamic resistance over multiple sessions. Price remained below it during the previous downtrend. However, a breakout occurred, followed by a successful retest, turning it into support — a textbook bullish structure flip.
This move was also a signal of trend reversal, which was followed by higher lows and a shift in price behavior.
📈 3. Upward Trendline – Short-Term Bullish Control:
A diagonal ascending trendline is forming beneath price action, supported by multiple rejection wicks and higher lows (marked in blue). This shows that buyers are stepping in earlier, absorbing selling pressure.
🔁 Each touch confirms strength.
📉 A break below this line could signal weakness or trend exhaustion.
Watch closely — this line becomes your dynamic support and invalidation point for any long positions.
🔄 4. Major BOS (Break of Structure) – Trend Change Confirmed:
We’ve seen a clean break of structure above previous swing highs — this is key in market structure analysis. When a lower high is invalidated by a higher high, it often marks a trend reversal.
This BOS now acts as a major support area. As long as price remains above this zone, bullish continuation is favored.
🚨 5. Reversal Zone in Sight – Potential Resistance Ahead:
Highlighted as “Next Reversal” in the chart, this area around $3,360–$3,370 is a confluence of:
Past resistance
Mid-channel region
Psychological round numbers
Price is nearing this level, and we may see a temporary pullback or rejection before any further continuation.
🎯 Trading Plan:
🔵 BULLISH SCENARIO (Base Case):
🟢 Entry: On a retest of trendline or BOS zone ($3,330–$3,340)
🛡️ SL: Below $3,325
🎯 TP1: $3,360
🎯 TP2: $3,390
🧠 Reasoning: Structural shift confirmed, trendline respected, SR flip confluence.
🔴 BEARISH SCENARIO (Counter-Play):
🔴 Entry: At rejection from $3,365–$3,370 zone (reversal box)
🛡️ SL: Above $3,380
🎯 TP1: $3,345
🎯 TP2: $3,330
🧠 Reasoning: Reversal from resistance zone, potential trap setup, fading exhausted move.
📌 Summary:
Gold is in a key decision phase after a major structural flip. The battle between bulls and bears is now centered around the trendline and next resistance zone. As always, patience and confirmation will be key.
Trendline = dynamic support
BOS zone = structural support
Reversal area = possible short-term ceiling
💡 Best trades will come from reactions, not predictions.
🚀 Stay Updated:
Follow this idea for live updates as price reacts to these zones. If we break and hold above the reversal box, expect bullish continuation. Otherwise, watch for potential trap plays and short-term pullbacks.
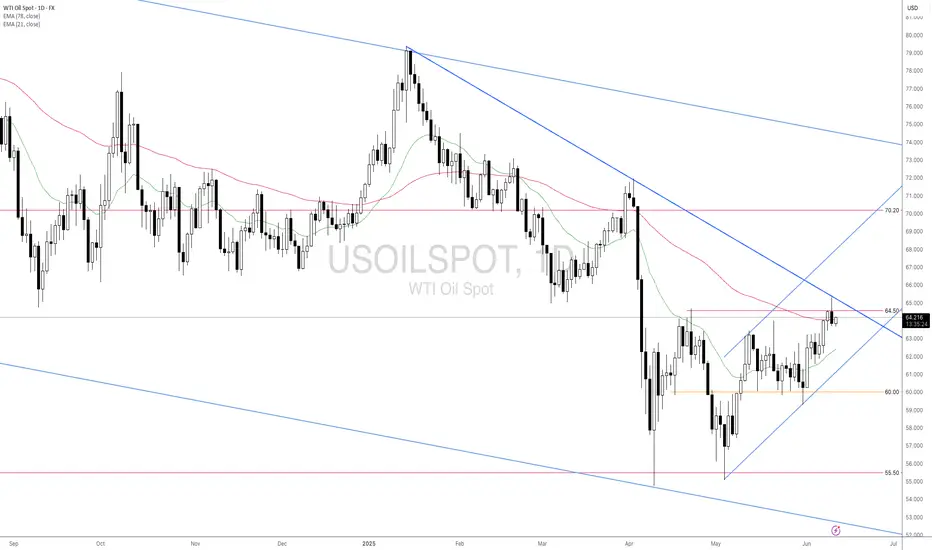
Will Oil Prices Face Downward Pressure After EIA's Forecast?Macro approach:
- The EIA’s latest short-term outlook projects weaker oil prices as rising global inventories weigh on the market. Sluggish demand growth and increased production are expected to push output above consumption, building stockpiles and adding pressure on prices.
- Traders are also monitoring the ongoing US-China trade talks in London. Sentiment remains cautiously optimistic after US Commerce Secretary Lutnick described the negotiations as progressing well.
- On the supply side, Saudi Aramco has reduced its Jul oil shipments to China by 1 million barrels compared to Jun, suggesting that the recent OPEC+ production hike may not translate into substantial new supply.
Technical approach:
- USOIL retested both the descending trendline and resistance near 64.50 before pulling back. The price remains above both EMAs, signaling that bullish momentum is still intact.
- A breakout above 64.50 and the descending trendline could open the door to 68.00–70.00.
- However, failure to clear this resistance may lead to a retreat toward the 60.00 support level.
Analysis by: Dat Tong, Senior Financial Markets Strategist at Exness