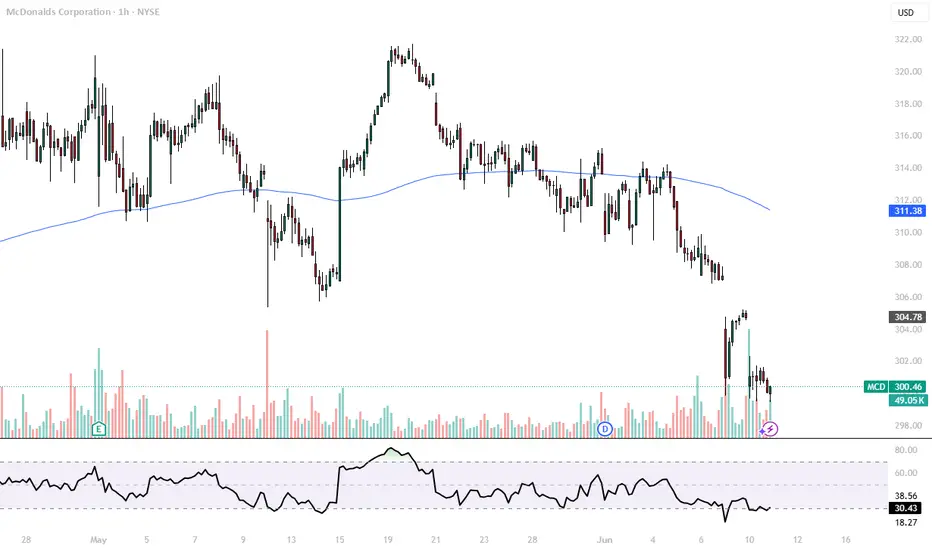
McDonald 1H Long PositionMy self-built strategy has sent me a signal for a long position. I bought a tranche of NYSE:MCD long and will be targeting the upper gaps as my profit targets. The first station will be around $306, and the second target lies between $318 and $319. Currently, the 1H chart is forming a nice divergence and had a huge volume spike, and my strategy indicates a high probability setup for this chart.
Given the current market volatility, I’ll be keeping a close eye on my open position to be able to react quickly if needed.
Technical Analysis
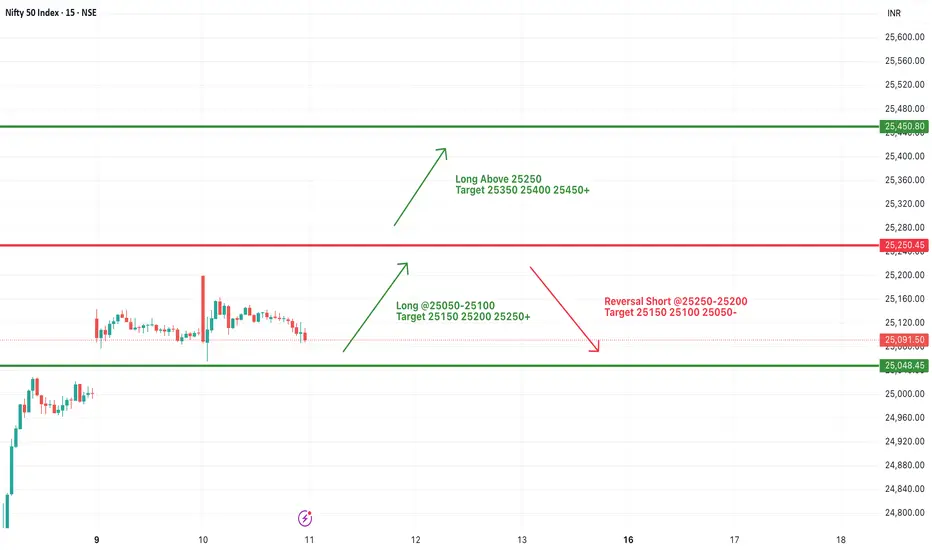
#NIFTY Intraday Support and Resistance Levels - 11/06/2025Nifty opened with a slight gap-up near the 25100 level, continuing its recent pattern of consolidation. Despite the positive opening, the index remains well within its established range, suggesting that market participants are still awaiting a decisive breakout. There are no major changes observed in key support or resistance levels compared to the previous sessions, reinforcing the view that the market is currently lacking strong directional momentum.
On the upside, if Nifty sustains above the 25100–25250 zone, it could attempt a move toward 25350, followed by 25400 and potentially 25450+. However, this upward move will require strong follow-through buying to break the current consolidation zone. Until then, any intraday rallies may face resistance near the 25250 mark, making it a crucial level to watch for bulls.
Conversely, failure to hold above the 25200–25250 region could lead to a reversal toward 25150, and if selling pressure intensifies, a further decline toward 25100 and 25050 may unfold. These levels are important short-term supports and have previously acted as buying zones. A break below 25050 may open the gates for deeper cuts, though that remains unlikely unless broader market sentiment weakens.
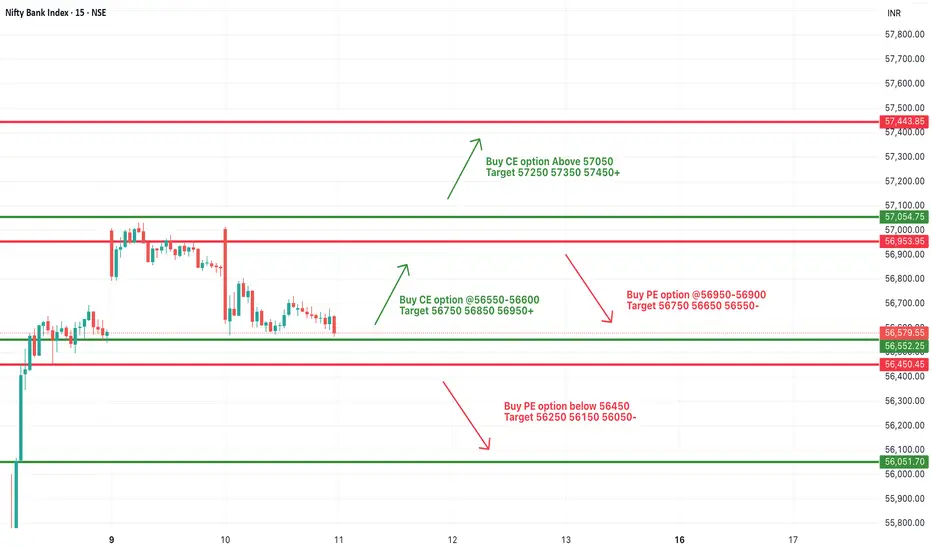
[INTRADAY] #BANKNIFTY PE & CE Levels(11/06/2025)Bank Nifty is opening with a slight gap-up around the 56650–56700 zone, continuing its consolidation phase from the previous sessions. The index has been oscillating within a narrow range, reflecting indecision among market participants. Today’s early movement suggests that unless there is a clear breakout or breakdown, the sideways momentum may persist. If Bank Nifty manages to sustain above the 56650 level, it could attempt an upside toward 56750, 56850, and possibly 56950+.
A stronger bullish breakout would be confirmed only if the index crosses and holds above 57050. On the other hand, failure to hold above 56600 and a breakdown below 56450 may trigger a short-term correction toward 56250, 56150, and 56050.
Given the tight structure, traders should remain cautious, avoid aggressive entries, and focus on quick trades with defined stop-losses and targets.
Nightly $SPY / $SPX Scenarios for June 11, 2025🔮 Nightly AMEX:SPY / SP:SPX Scenarios for June 11, 2025 🔮
🌍 Market-Moving News 🌍
🤝 Cautious Optimism on U.S.–China Trade Progress
Markets responded positively to fresh developments in ongoing U.S.–China trade talks, with S&P 500 and Nasdaq closing ~0.6% higher — the third straight day of gains — on hopes of easing trade barriers
📉 Treasury Yields Climb as Auction Approaches
Bond investors grew cautious ahead of a key Treasury debt auction and incoming U.S. inflation data. The 10-year yield stayed elevated, weighing modestly on equities .
💹 Global Markets Showing Resilience
Asian and European markets tracked U.S. gains midweek, driven by trade-talk optimism, despite lingering concerns over slower global growth and debt levels .
📊 Key Data Releases 📊
📅 Wednesday, June 11:
(No major U.S. releases — focus remains on market reactions to trade talks and Treasury auctions.)
⚠️ Disclaimer:
This information is for educational and informational purposes only and should not be construed as financial advice. Always consult a licensed financial advisor before making investment decisions.
📌 #trading #stockmarket #economy #news #trendtao #charting #technicalanalysis

USD/MXN: Bearish Momentum Persists, Testing Key SupportUSD/MXN continues to grind lower, maintaining a persistent downtrend that has remained intact since mid-April. The pair is currently hovering near a short-term support area just above 19.00, with little sign of bullish reversal as of now.
🔍 Technical Breakdown
Bearish Structure: Price remains below both the 50-day (19.63) and 200-day (20.02) SMAs, with both averages now pointing lower — confirming the strength of the ongoing bearish trend.
Momentum Indicators:
MACD remains firmly in negative territory with a persistent bearish histogram, suggesting downside momentum is not yet exhausted.
RSI is approaching oversold levels, currently at 34. While not yet in extreme territory, it hints that the pair may be nearing a potential short-term pause or bounce.
Support & Resistance:
Price is testing a minor support zone around 19.00, with the next significant level lower coming in near 18.58, a level last seen in early Q3 2023.
On the upside, initial resistance stands at the breakdown point near 19.49, followed by stronger resistance at the confluence of moving averages.
⚙️ Outlook
USD/MXN is trading firmly within a well-defined downtrend, marked by lower highs and lower lows. As long as price remains below the 50-day SMA, the bias remains bearish. While the RSI suggests some caution is warranted as the pair approaches oversold conditions, there is no definitive bullish divergence or reversal pattern yet.
If the current support gives way, bears could target deeper retracements. Conversely, a sustained rebound back above 19.49 would be needed to challenge the bearish structure.
-MW

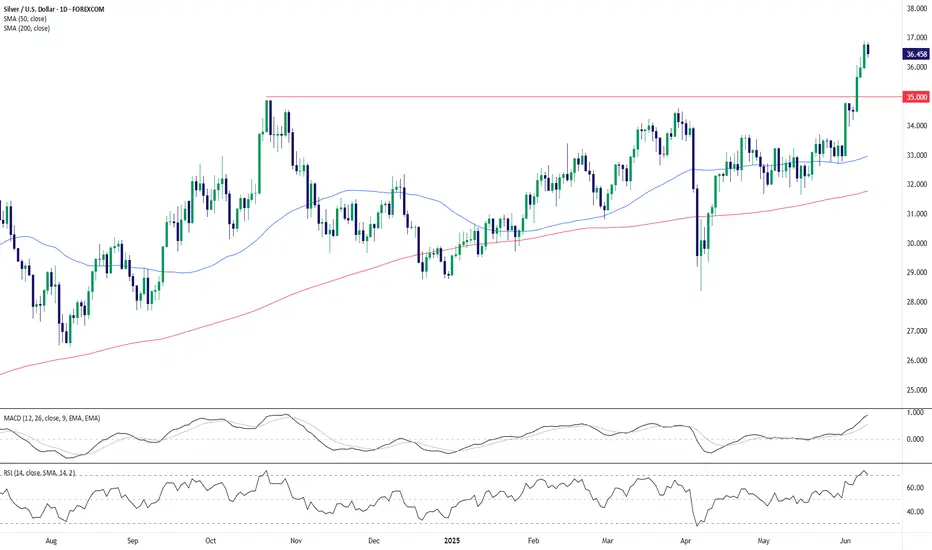
Silver Bulls Breach Key Resistance – Momentum BuildsSilver (XAG/USD) has punched through a major horizontal resistance level around the psychological $35.00 mark, marking a significant technical breakout with bullish continuation potential.
🔍 Technical Highlights
Breakout Above Multi-Month Resistance: Price has cleanly broken above the key $35.00 zone, which had capped upside since late 2023. The breakout follows a tight consolidation range, suggesting a measured accumulation phase has ended.
Moving Averages Aligned Bullishly:
The 50-day SMA is rising sharply and sits well above the 200-day SMA.
Price is comfortably trading above both averages, confirming a strong uptrend structure.
MACD in Strong Positive Territory: MACD has surged above its signal line, reinforcing bullish momentum. No signs of a bearish crossover in sight.
RSI Enters Overbought Zone: RSI is currently near 70. While this signals strong momentum, it also raises the potential for short-term cooling or consolidation before any continued leg higher.
⚙️ Outlook
The breakout above $35.00 represents a major bullish development, potentially opening the door to further upside exploration. The impulsive nature of recent gains, combined with rising momentum indicators and trend-confirming moving averages, all favor the bulls. However, the overbought RSI suggests the possibility of a short-term pullback or sideways consolidation before the next move higher.
Traders may want to monitor for a potential retest of the $35.00 area as support, which could offer a higher-probability continuation setup within the broader uptrend.
-MW
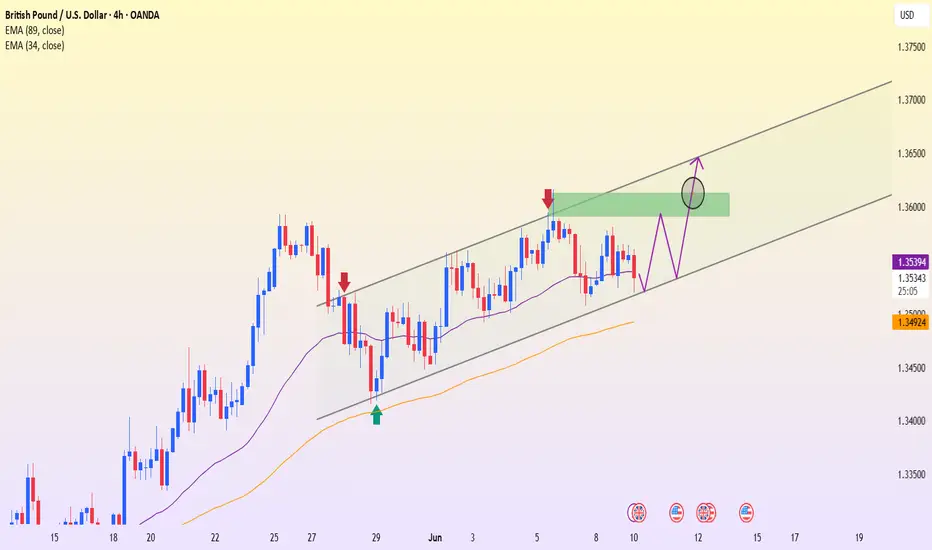
GBPUSD – Holding the Uptrend, Eyeing Resistance BreakoutThe GBPUSD pair continues to respect a well-defined ascending channel on the H4 chart. Each time price retraces to the lower boundary, buying pressure has consistently stepped in. Currently, price is hovering near the channel’s lower edge and the EMA89 – forming a technical support area around 1.35370. If this zone holds, there is a strong potential for a rebound toward the resistance zone near 1.36100–1.36300, which has rejected price twice before.
From a news perspective, markets are awaiting the U.S. CPI report tomorrow. If inflation data comes in weaker, expectations for the Fed to cut interest rates will increase, putting pressure on the USD and allowing GBP to extend gains. Additionally, the Bank of England is expected to maintain a more hawkish stance due to persistent domestic inflation – which further supports the pound’s upward momentum.
Watching the EMA and lower channel boundary is key. If a clear bullish signal forms at this zone, a trend-following long strategy could carry a high probability of success.
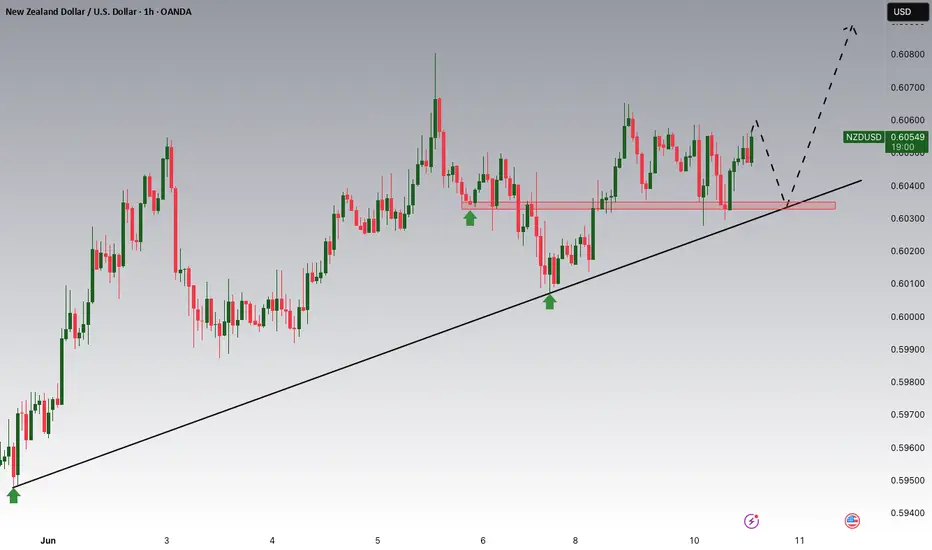
NZDUSD Potential UpsidesHey Traders, in today's trading session we are monitoring NZDUSD for a buying opportunity around 0.60350 zone, NZDUSD is trading in an uptrend and currently is in a correction phase in which it is approaching the trend at 0.60350 support and resistance area.
Trade safe, Joe.
Oil's Volatility Meets Fed's Patience: A Path to 1.3643?USDCAD – Oil's Volatility Meets Fed's Patience: A Path to 1.3643?
🌍 Macro Landscape: Diverging Monetary Paths & Oil's Influence
The USDCAD pair is currently navigating a complex environment shaped by diverging central bank policies and the significant influence of crude oil prices. While the Federal Reserve is signaling a "higher-for-longer" interest rate stance due to sticky inflation, the Bank of Canada (BoC) is in a more nuanced position, balancing inflation control with economic growth. This divergence creates a fundamental tailwind for the USD.
However, Canada's economy is heavily tied to commodity prices, especially crude oil. Recent volatility in oil markets can exert significant pressure on the Canadian dollar. If oil prices remain subdued or face downward pressure, it could exacerbate the CAD's weakness against the USD, amplifying the impact of policy divergence.
🏦 Central Bank Policy Divergence: Fed's Firmness vs. BoC's Caution
Federal Reserve: FOMC members continue to signal patience on rate cuts. Recent inflation data (PCE, CPI) shows persistent price pressure, particularly in the services sector, reinforcing the Fed's hawkish bias. This suggests the USD may retain its strength as higher rates attract capital.
Bank of Canada: The BoC, while having taken aggressive steps previously, might be more cautious in its future rate decisions. Any dovish undertones or hints at pausing rate hikes could weaken the CAD. Conversely, a resurgence in inflation or stronger economic data could prompt the BoC to maintain a firm stance.
This policy divergence, coupled with external factors like commodity prices, creates a fertile ground for significant moves in USDCAD.
🌐 Capital Flows: Safe-Haven Dynamics and Commodity Impact
Global capital flow models indicate a shift towards the US dollar as a preferred safe haven amidst geopolitical tensions and global economic uncertainties. While Gold remains a traditional hedge, the USD's yield advantage makes it an attractive destination for institutional capital.
For CAD, its sensitivity to commodity prices means that capital flows are heavily influenced by the outlook for global growth and energy demand. A softening global economic outlook could lead to reduced demand for commodities, weighing on the CAD, and potentially driving inflows into USD-based assets.
📊 Technical Structure: Channel Breakdown & Bearish Momentum Towards 1.3643
On the H1 chart (as observed from the provided image):
Price Channel: USDCAD has been trading within a clear ascending channel. However, the price recently broke below the lower boundary of this channel, suggesting a potential shift in momentum from bullish to bearish.
Moving Averages: The price has moved below the EMA 13 – 34 – 89. This bearish alignment (EMA "fan-out formation" in reverse) confirms a short-term bearish momentum is building. The 200 EMA (red line) is currently acting as a key resistance level, near the prior support turned resistance.
Key Resistance (Sell Zone): The region around 1.36989 (aligning with previous support and possibly a Fibonacci retracement level) is now acting as a crucial resistance. Any retest of this zone, especially with bearish candlestick patterns, could offer selling opportunities. The 200 EMA reinforces this zone as a strong overhead barrier.
Key Support (Target Zone): The price is projected towards 1.36431. This level aligns with a strong prior support and also coincides with the Fibonacci Extension 1.382 level from a previous swing, making it a high-probability target for bearish moves. A bounce from 1.36734 (a mid-channel support or Fibonacci level) could offer a temporary reprieve, but the overall technical structure points to the lower target.
🎯 Trade Strategy Recommendations
Scenario 1 – Sell the Pullback (Preferred):
Entry: 1.3685 – 1.3695 (retest of broken channel line/resistance near 1.36989, possibly confluence with 200 EMA).
Stop-Loss: 1.3720 (above recent swing high/channel top).
Take-Profit: 1.3673 (initial target) → 1.3643 (main target) → 1.3620.
Scenario 2 – Breakout Momentum Sell (if price consolidates below 1.3673):
Entry: 1.3670 (break below 1.36734 with strong bearish momentum).
Stop-Loss: 1.3690.
Take-Profit: 1.3643 → 1.3620.
⚠️ Key Events to Watch:
US PCE Price Index (upcoming data): If hotter-than-expected, this would reinforce the Fed’s hawkish tone and lift USD.
Canadian CPI (upcoming data): Cooler-than-expected inflation could prompt a more dovish stance from the BoC, weakening CAD.
Crude Oil Inventory/News: Any significant news or data regarding global oil supply/demand can directly impact CAD.

Gold: Easing China Tensions Could Weigh on XAUUSD Prices!!!Hey Traders, in the coming week we are monitoring XAUUSD for a selling opportunity around 3,340 zone, Gold was trading in an uptrend and currently is in a correction phase in which it is approaching the retrace area at 3,340 support and resistance area.
Trade safe, Joe.

Storm Ahead? Key Level Breakout or Dangerous Reversal!USD/JPY: Storm Ahead? Key Level Breakout or Dangerous Reversal!
Overview:
The USD/JPY pair stands at a crucial crossroads, with technical signals indicating the potential for significant volatility in the near term. Will the Yen regain its footing, or will pressure from the USD continue to push the pair to new highs? This analysis delves into technical, fundamental, and macroeconomic factors to outline potential scenarios and identify key trading zones.
Detailed Technical Analysis:
Primary Trend: The USD/JPY chart clearly shows a short-term uptrend, supported by an ascending trendline (dashed line on the chart) and upward-sloping moving averages (MA). Trend analysis is considered the most important area of technical analysis, and is key to determining the general direction of a security. However, the price is approaching strong resistance zones, suggesting potential selling pressure. Technical analysis is a trading tool used to evaluate stocks and attempt to predict their future movements by analyzing statistical data obtained from trading activity.
Key Price Levels:
Crucial Resistance Zone (SELL Zone): Around 144.894 - 145.178. This is a significant Fibonacci Extension zone (1.13 and 1.236), where the price has reacted in the past and could attract strong selling pressure. If the price breaks and holds above this zone, the uptrend will be confirmed.
Crucial Support Zone (BUY Zone): Around 143.600 - 143.750. This support zone is formed by previous lows and the ascending trendline. If the price corrects to this zone and shows reversal signals, it could be a good buying opportunity. The next support zone is around 142.800. The goal of technical analysis is to determine the buy and sell points of a stock.
Technical Indicators: The MAs (blue, orange, red) maintain a relatively consistent distance and are sloping upwards, supporting the uptrend. However, the convergence of MAs near resistance zones could signal a weakening of upward momentum.
Price Patterns: Currently, the price is forming a pattern similar to a bull flag or an ascending triangle, suggesting a potential continuation of the uptrend if it breaks upwards. Conversely, if the price fails to overcome resistance and breaks the uptrend line, a bearish reversal pattern could form. Wave analysis is a technique based on the observation that markets move in specific patterns called waves.
Relevant Fundamental and Economic Factors:
Macroeconomic Analysis (Japan): The Bank of Japan (BOJ) continues to maintain ultra-loose monetary policy, with negative interest rates and yield curve control. This exerts continuous downward pressure on the Yen. Any signal of change from the BOJ regarding policy will have a significant impact on USD/JPY.
Macroeconomic Analysis (United States): The U.S. Federal Reserve (FED) is still in an aggressive monetary tightening cycle to combat inflation. Inflation reports (CPI, PPI), employment data (NFP), and statements from FED officials will be key drivers for the USD. If U.S. inflation remains high, the FED may continue to raise interest rates, pushing USD/JPY higher. Fundamental analysis focuses on evaluating economic, political, and social factors affecting the value of a currency pair.
Upcoming Economic Events: Closely monitor inflation reports from both the U.S. and Japan, GDP data, unemployment rates, and policy meetings of the BOJ and FED. These events will act as catalysts for sharp movements.
Conclusion and Trading Recommendations:
USD/JPY is in an uptrend but approaching crucial resistance zones.
BUY
Entry: When the price breaks and closes above 145.178, confirming the uptrend continuation. Or when the price corrects to the 143.600 - 143.750 zone and shows bullish reversal candles (e.g., bullish engulfing, hammer).
Take Profit: Higher Fibonacci levels (e.g., 1.382 at 145.491 or 1.5 at 145.918).
Stop Loss: Below the nearest support zone, e.g., below 143.500 if buying at support, or below 144.800 if buying after a resistance breakout.
SELL Scenario:
Entry: When the price approaches the 144.894 - 145.178 zone and strong bearish reversal signals appear (e.g., Gravestone Doji, bearish engulfing, double top pattern).
Take Profit: Lower support levels, e.g., 143.700, 142.800.
Stop Loss: Above the resistance zone, e.g., above 145.300.
Risk Disclaimer: Financial markets always involve high risks. Always manage your capital carefully and never trade with money you cannot afford to lose. This analysis is for informational purposes only and not investment advice.

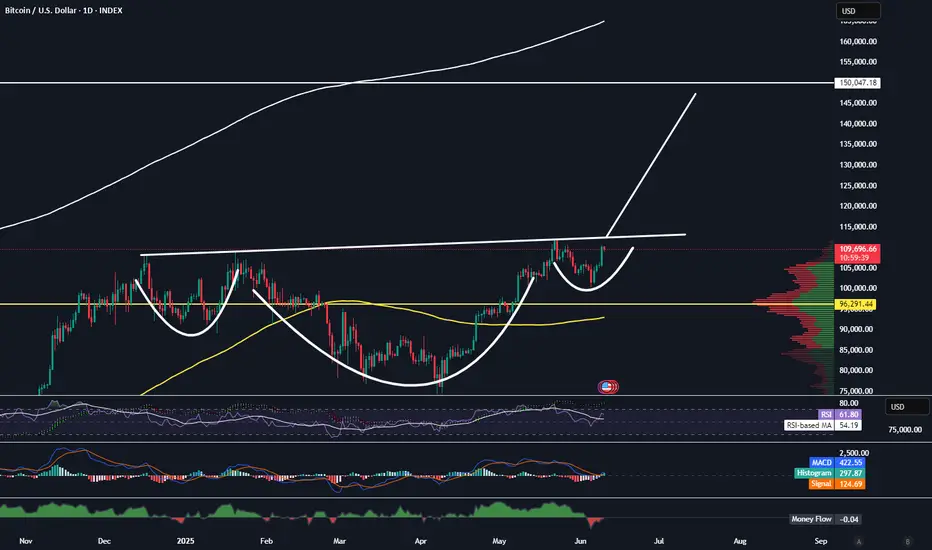
Inverse Head and Shoulders Now Clear On Bitcoin ChartTrading Fam,
It has now become apparent that Bitcoin has formed an inverse head and shoulders pattern on the daily. This is very bullish and should the pattern follow through, it gives some good long-range targets to shoot for by the end of this year and potentially, well into the next.
Calculating our first target is relatively simple. We draw a measurement from the bottom of the head (that largest dip) to the neckline. We then move that measurement line to an approximated breakout area. This then gives us an estimated target of around 150k. I will say that this is a fairly sure target before the end of the year if and when that neckline is broken to the upside.
Target number two should be that 350 DMA in my opinion. Bitcoin likes to kiss that 350 DMA in bullish markets. So, where ever that ends up being pricewise during this next upwards movement is a good target #2. I would estimate it will be at least 175-180k.
But if we break that 350 DMA to the upside, then you will know the end of our bull cycle is drawing close. Bitcoin may blow-off here and generally would stay above that 350 DMA for at least another month or two. In our last bull cycle it remained above the 350 DMA for 5 and a half months. Selling anytime we are significantly above that 350 DMA pricewise and timewise is not a bad strategy because you will know we are nearing the end of our bull cycle at this point.
I hope this post gives you some good long-term targets and trading strategies going forward. Personally, I will be looking to sell much if not most of my holdings once Bitcoin breaks above that 350 DMA. Of course, as always, I will keep you all posted when that time comes.
Best,
Stew
A Detailed Technical, Fundamental, and Macro AnalysisNZD/USD Trading Plan: A Detailed Technical, Fundamental, and Macro Analysis
1. Technical Analysis:
The 30-minute chart of NZD/USD highlights key price action within a well-defined channel between crucial support and resistance levels:
Resistance (0.60769): The price is testing significant resistance around 0.60769. If this level is broken, the price could continue higher, indicating further upward momentum.
Support (0.60271): A strong support level is found at 0.60271. If the price retraces and holds this level, a potential rebound could take place.
EMA (Exponential Moving Averages):
EMA 13 (Blue): Currently moving upwards, confirming a bullish short-term trend.
EMA 34 (Yellow) and EMA 89 (Red): These are trending sideways, suggesting that the market is in a consolidation phase, waiting for further signals.
2. Fundamental Analysis:
FED's Monetary Policy: The actions and statements of the Federal Reserve regarding interest rates have a significant impact on the USD. If the FED maintains or hikes rates, this could push the USD higher, putting downward pressure on NZD.
New Zealand Economic Indicators: The strength of New Zealand's economy, particularly export data, plays a vital role in supporting or weakening the NZD. Positive economic reports could support a bullish NZD.
3. Macroeconomic Analysis:
Global Risk Sentiment: Market sentiment is being influenced by global factors like trade tensions, economic growth projections, and political factors. A shift in risk sentiment, especially regarding the U.S. economy or geopolitical tensions, could lead to significant price movements in the NZD/USD pair.
4. Buy and Sell Zones:
BUY ZONE:
Entry: 0.60271 - 0.60300
SL (Stop Loss): 0.60200
TP (Take Profit): 0.60700 → 0.60769 → 0.60900
SELL ZONE:
Entry: 0.60750 - 0.60800
SL: 0.60900
TP: 0.60300 → 0.60200 → 0.60100
5. Strategy:
Buy Orders: If price consolidates at the support level of 0.60271 and shows confirmation with EMA indicators, consider a buy with a target at 0.60769.
Sell Orders: If price fails to break through the resistance at 0.60769, a sell order could be placed, targeting the 0.60271 support level.
6. Market Sentiment:
The market is highly sensitive to news and economic reports, and therefore, it is essential to remain alert to potential volatility. Any major economic release from New Zealand or U.S. Federal Reserve news could significantly influence the pair.

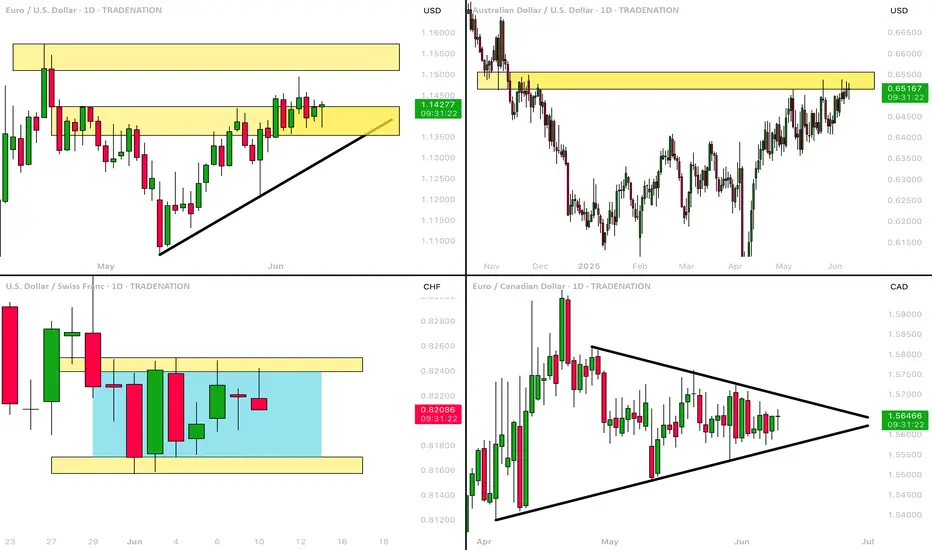
MarketBreakdown | EURUSD, AUDUSD, USDCHF, EURCAD
Here are the updates & outlook for multiple instruments in my watch list.
1️⃣ #EURUSD daily time frame 🇪🇺🇺🇸
Though the pair remains quite weak for the last few days,
I strongly believe that bulls have unrealized potential.
The pair may continue rising and reach the underlined yellow resistance soon.
2️⃣ #AUDUSD daily time frame 🇦🇺🇺🇸
The price is testing a significant horizontal resistance.
Its bullish breakout will provide a strong bullish signal.
The pair will go way higher then.
3️⃣ #USDCHF daily time frame 🇺🇸🇨🇭
The price is stuck within a narrow consolidation range.
I think that a sideways movement is going to continue
and the price will drop to the support of the range soon.
4️⃣ #EURCAD daily time frame 🇪🇺🇨🇦
The price action is contracting within a symmetrical triangle pattern.
Such a pattern signifies a deep indecision.
A breakout of one of its boundaries will indicate the side of the next market move.
Do you agree with my market breakdown?
❤️Please, support my work with like, thank you!❤️
I am part of Trade Nation's Influencer program and receive a monthly fee for using their TradingView charts in my analysis.
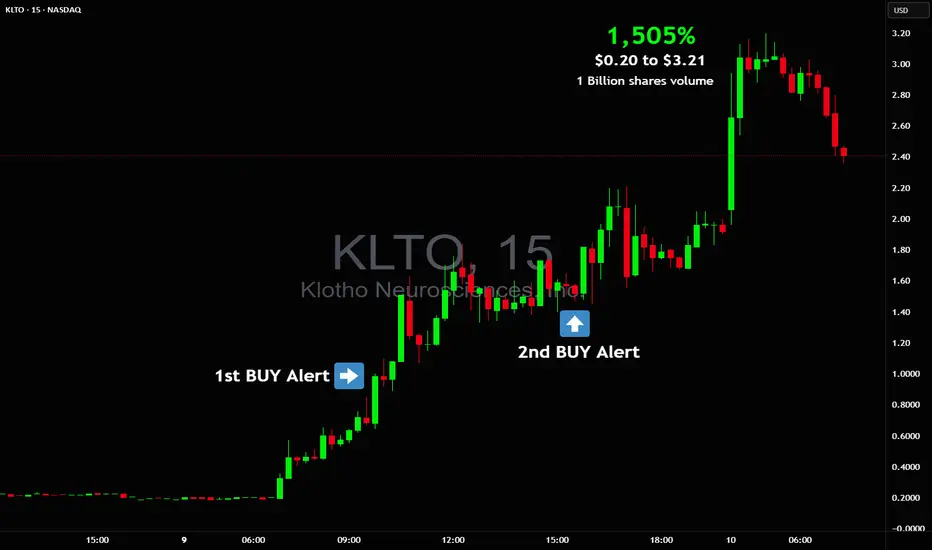
1,505% from $0.20 to $3.21 on massive 1+ Billion volume $KLTOWOW 🤯 1,505% from $0.20 to $3.21 on massive 1+ Billion shares traded 🚀 NASDAQ:KLTO
I sent out 2 Buy Alerts for everyone to get paid nicely ✅
This will trigger more runners, premarket already got movers NASDAQ:MEGL , NASDAQ:MRIN , NASDAQ:EVGN
WILL GOLD CONTINUE ITS RALLY OR FACE A MAJOR CORRECTION? XAUUSD – WILL GOLD CONTINUE ITS RALLY OR FACE A MAJOR CORRECTION?
Gold is at a pivotal point after experiencing a significant correction following its recent rally. With the market showing mixed signals, the question now is whether gold will continue its upward trajectory or experience further corrections before breaking new highs. The current global economic climate, combined with macroeconomic factors, will be the driving forces behind gold's next move.
🌍 MACROECONOMIC OUTLOOK & MARKET SENTIMENT
US Dollar Strength: The USD has been strengthening, which has put some pressure on gold prices. However, this comes amid uncertainty in global trade relations, particularly between the US and China, which is creating mixed market sentiment. Gold remains a key asset for hedging against currency risks and geopolitical tensions.
Federal Reserve's Stance on Interest Rates: The Fed has signaled that while inflation remains a concern, it’s unlikely to cut interest rates in the near future. This could limit gold's upside potential in the short term, but the metal remains attractive due to its safe-haven status.
Geopolitical Tensions: With ongoing concerns over US-China trade talks and tensions surrounding Ukraine, investors continue to flock to gold as a hedge against political and economic instability. These external pressures continue to fuel demand for gold.
📈 TECHNICAL ANALYSIS (H1 – EMA 13/34/89/200)
Current Correction: Gold has been correcting after a strong surge, testing key support levels like 3300. On the H1 timeframe, the EMA indicators suggest consolidation and weakness, signaling that further pullbacks are possible before any potential breakout.
Technical Pattern – "Flag" Formation: Gold is forming a bearish flag pattern, indicating a temporary pause after a strong upward trend. This pattern suggests that gold might continue to trade sideways, with a breakout above key resistance levels leading to a continuation of the uptrend.
Key Resistance and Support Levels: Gold is facing significant resistance levels at 3320 and 3330, while key support levels at 3300 and 3270 will be crucial to watch in the coming sessions.
📍 KEY LEVELS TO WATCH
Resistance Levels: 3320 – 3330 – 3338 – 3350 – 3360
Support Levels: 3300 – 3270 – 3250
🧭 RECOMMENDED TRADE SETUPS
🔵 BUY ZONE: 3270 – 3272
SL: 3265
TP: 3280 → 3300 → 3320 → 3330 → 3350
🔻 SELL ZONE: 3320 – 3325
SL: 3330
TP: 3310 → 3295 → 3280 → 3265
✅ SUMMARY
Gold is currently experiencing a correction after a solid rally, but the long-term outlook remains bullish. Macro-economic factors, including the Fed’s policies and geopolitical risks, are likely to drive gold prices higher in the future. However, short-term fluctuations should be expected as the market tests key resistance and support levels.
Traders should focus on well-defined entry and exit points within these key levels and maintain a disciplined risk management strategy.
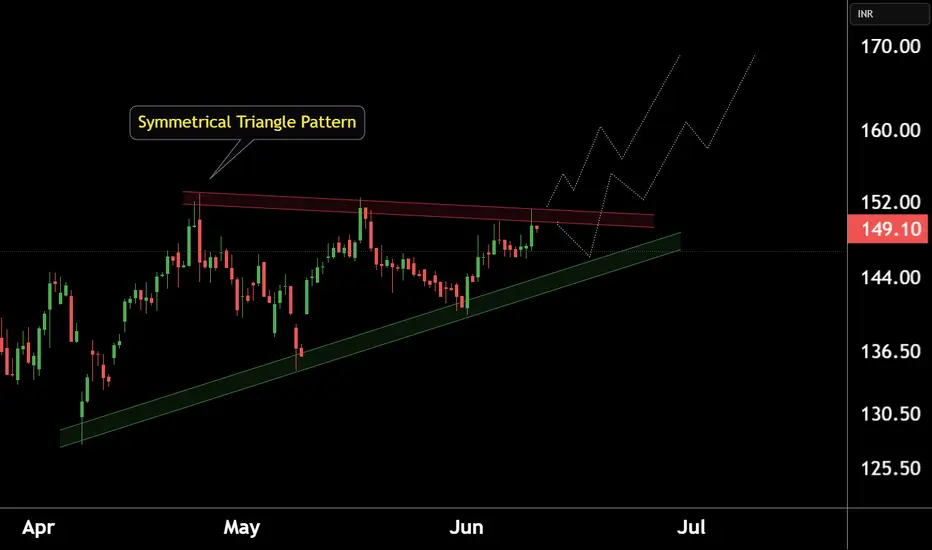
RAIN INDUSTRIES at Good Support.This is 4 hour chart of RAIN INDUSTRIES.
Stock is forming a Symmetrical Triangle Pattern.pattern lower boundary expected to act as a strong support level 142-145.
IF this level is sustain , then we may see higher prices in Rain industries.
Thank You !!
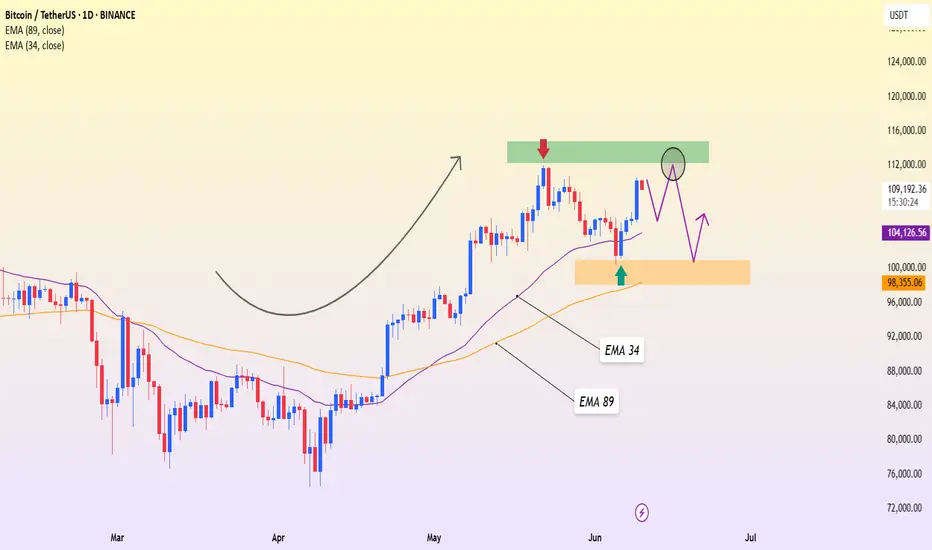
BTCUSDT – Uptrend Intact, Resistance Still in PlayBitcoin is currently moving within a healthy uptrend, showing a strong rebound from the 101,332 USDT support zone—aligned with the EMA 89 on the daily chart. Following an impressive recovery, the price is now approaching the 111,892 resistance area, which previously halted the bullish momentum and triggered a deep correction.
However, recent price action shows signs of stalling, suggesting a possible consolidation phase. If BTC fails to break above 111,892, a mild pullback toward the 104,000–101,000 zone may occur to build fresh momentum for the next bullish leg.
From a news perspective, the crypto market is buoyed by improving sentiment after weak U.S. job data, increasing the odds of an earlier-than-expected Fed rate cut. Additionally, continued capital inflows into Bitcoin ETFs are supporting medium-term upside potential for BTC.
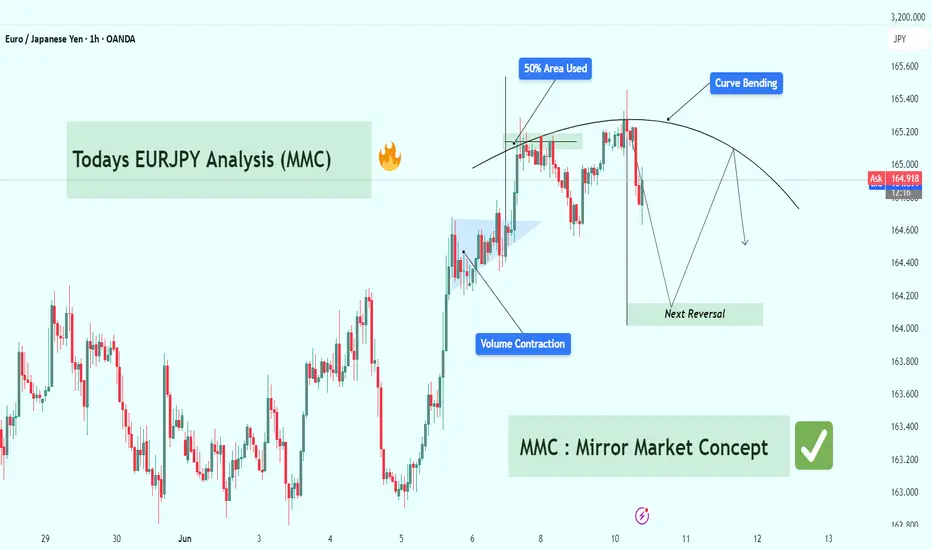
EURJPY Technical Breakdown (MMC Strategy) : Target Zone 🧠 Concept Focus: MMC – Mirror Market Concept
The Mirror Market Concept (MMC) helps identify pattern inversions, price reflection zones, and structural symmetry that hint at upcoming market turns. This chart reflects a curve-based reversal logic rooted in smart money behavior, volume analysis, and pattern exhaustion.
📊 Technical Structure Breakdown
🔹 1. Volume Contraction + Breakout (June 6–7)
Early signs of bullish pressure were detected with volume contraction, forming a tight range wedge/triangle.
This is often a liquidity trap where weak hands sell into strength.
Smart money absorbed sell-side liquidity before impulsively breaking out.
This is a common MMC move: contract > trap > expand.
🔹 2. 50% Area Used – Smart Money Trap (June 9)
After the breakout, price tapped into the 50% equilibrium zone of the previous major move.
This level often acts as a liquidity sweep zone, ideal for smart money to unload or build counter positions.
The rejection wick here confirms that institutional traders reacted at this level.
🔹 3. Curve Bending Pattern – Exhaustion in Play
The market has now entered a curve bending phase, visible with the arching price movement.
This signifies momentum exhaustion, where bullish attempts get weaker.
Think of this curve like a mirror ceiling — as each high gets tapped, it bends, showing the market can't sustain higher levels.
🔹 4. Next Reversal Zone (Projected Target: ~164.150–164.200)
Based on MMC symmetry and previous demand zones, the area highlighted as Next Reversal is a key structure zone.
This is where we expect price to react — either bounce (for buyers) or break (for continuation shorts).
A clean bounce here could mirror the earlier pattern in reverse, hence the Mirror Market Concept.
🔁 Summary of Market Psychology
🧲 Volume contraction signals manipulation.
🎯 50% zone rejection shows trap completion.
🪞 Curve bending shows buyers losing strength.
🔻 Price likely to drop into the reversal zone, completing the mirror leg.
🧩 What Traders Should Watch
Indicator/Zone Notes
50% Area Used Smart Money Exit or Entry Trap
Curve Bending Reversal Geometry (Momentum Exhaustion)
Next Reversal Zone Smart Money Demand Zone (~164.150)
Break Below 164.100 Confirms deeper bearish continuation
🎯 Trading Strategy Outlook
🔍 Short Bias: Look for confirmation (e.g., bearish engulfing, BOS on lower TFs) to enter shorts below curve zone.
🛑 Invalidation Level: Clean breakout above 165.500 would invalidate the mirror structure and shift to continuation long.
🎣 Reversal Scouting : If price respects the Next Reversal Zone, there could be a potential long scalp back into mid-range.
🧠 Educational Note: MMC in Action
The Mirror Market Concept is powerful for intraday trading. It uses pattern reflection, liquidity logic, and price symmetry to forecast reversals before typical indicators catch up. If mastered, this concept can give early reversal entries and trap avoidance.
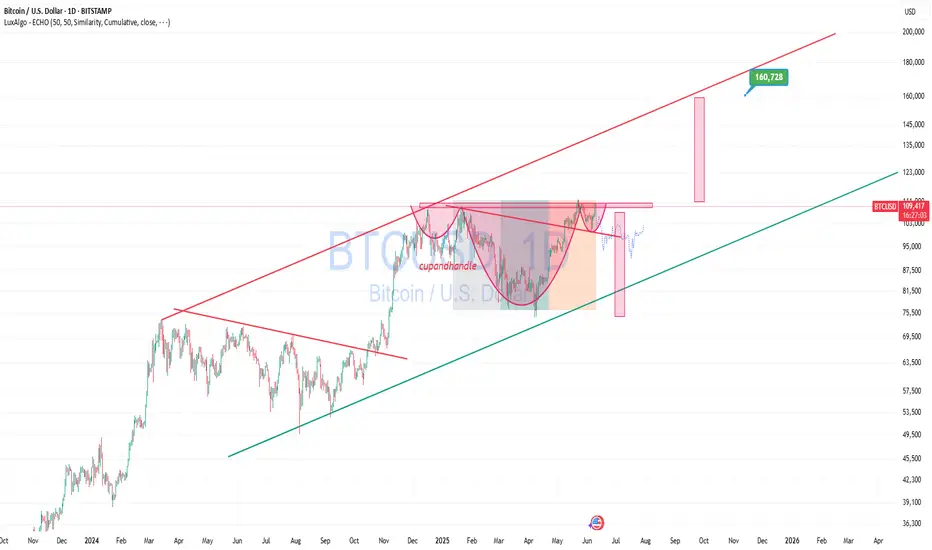
BTCUSD – continuing to buy as breakout confirms bullish setupBTCUSD is forming a classic “cup and handle” pattern, now breaking above key resistance. Price is holding within an upward channel, and if momentum stays strong, the next target could reach 160,000 and beyond.
It might seem hard to believe, but the structure points to continued bullish momentum. I’m not missing this opportunity and continue to build long positions as this breakout develops.
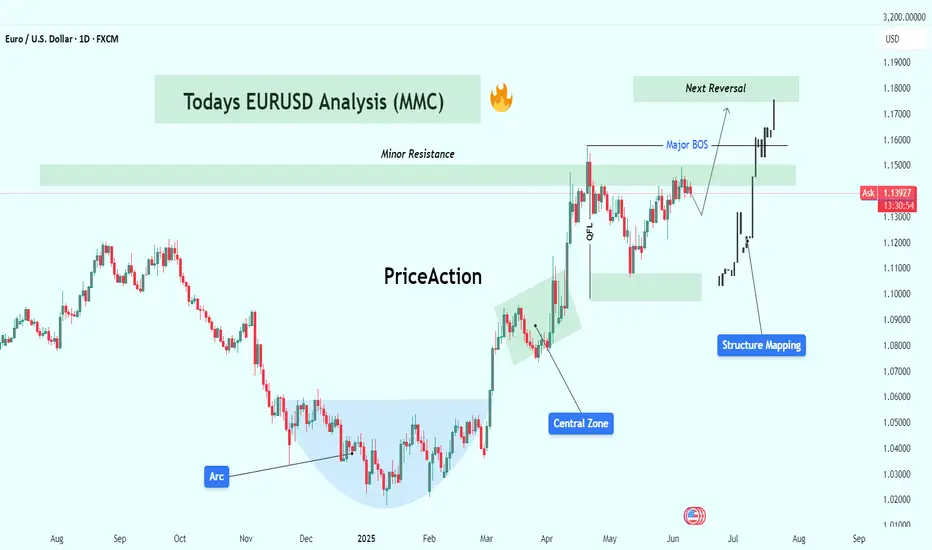
EURUSD Analysis (MMC Strategy) : Structure Mapping + Target🧠 Overview
This analysis is based on the MMC (Market Mapping Concept), combining smart money principles, structure mapping, and price behavior analysis. EUR/USD has been showing strong bullish activity over the past few months, but we are now approaching a critical decision zone. Let’s break it all down.
🔹 1. Arc Structure – Accumulation Phase (Dec 2024 – Feb 2025)
The chart starts with a well-defined Arc formation, signaling accumulation by large players.
Price showed a series of higher lows within the arc, compressing volatility.
This is where smart money quietly loads positions before pushing price.
Key Insight: This arc often precedes an impulsive breakout, as seen next.
🔹 2. Central Zone Breakout (Feb – Mar 2025)
The price exploded out of the arc, breaking through the central compression area.
Marked as the Central Zone, this acted as both support and a launchpad.
This phase included imbalance filling, reaccumulation, and clean price action.
Observation: Notice the aggressive bullish candles—clear indication of institutional interest.
🔹 3. Structure Mapping & QFL Zone (April 2025)
A classic QFL (Quick Flip Level) was formed after the initial rally.
Price pulled back into a structure support zone, respected it cleanly, and bounced back.
This gave a textbook smart money entry.
Structure Mapping highlights how each leg of the trend is forming based on supply/demand reaction.
🔹 4. Major BOS – Break of Structure (May 2025)
Price broke the previous swing high, giving us a Major Break of Structure.
This BOS confirms a change in character (CHOCH) from ranging to trending.
After BOS, the market retested the breakout zone—providing a second ideal long entry for continuation traders.
🔹 5. Minor Resistance Zone (Current Price)
Currently, price is testing a Minor Resistance zone around 1.1400–1.1450.
This level acted as resistance earlier and may slow price down temporarily.
However, there’s still room for bullish continuation unless reversal patterns emerge.
Key Watch Point: If price shows weakness here (e.g., rejection wicks, bearish engulfing), short-term retracement may follow.
🔹 6. Next Reversal Zone (Projected Target: 1.1700–1.1800)
The green box above marks the Next Reversal Zone, based on historical supply, Fibonacci extension levels, and structure analysis.
Expect this area to act as strong resistance unless momentum is very strong.
This is a potential TP zone for long traders or an area to scout for short opportunities if reversal signals appear (divergence, order block rejection, liquidity grab).
📌 Key Levels
Zone Price Range Role
Central Zone 1.0800–1.1000 Support/Accumulation
Minor Resistance 1.1400–1.1450 Immediate Hurdle
Next Reversal Zone 1.1700–1.1800 Target / Short Setup
QFL Zone 1.1100–1.1200 Smart Money Entry Point
🧠 Strategy Outlook
✅ Bullish Bias: Structure is clearly bullish. Buyers are in control.
🕵️♂️ Watch for Reaction at Minor Resistance – a clean break = continuation, rejection = short-term pullback.
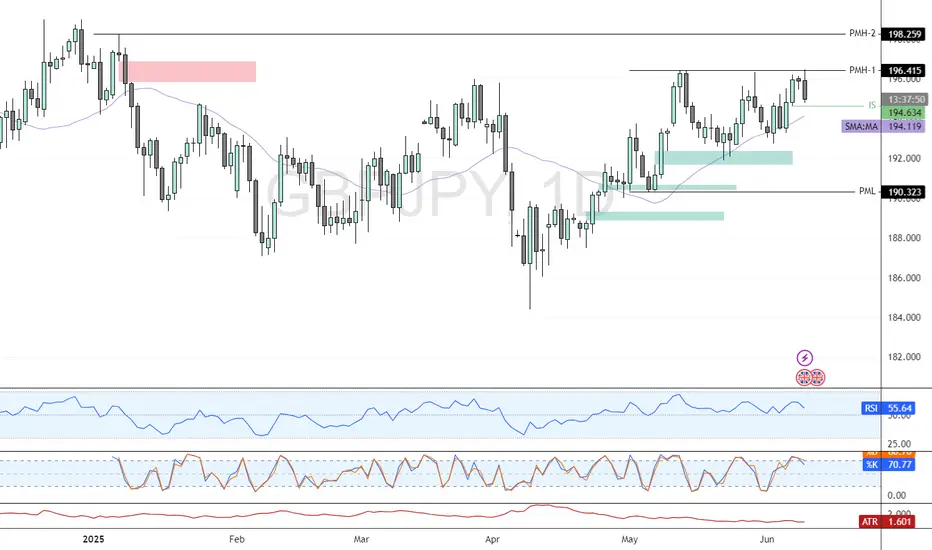
GBP/JPY: Institutional Moves Signal Liquidity ShiftFenzoFx—GBP/JPY tested the 196.4 resistance for the third time since May, with no liquidity sweep above this level, indicating massive liquidity remains.
GBP/JPY approaches 194.6 support with a full-body bearish candlestick, suggesting institutional selling pressure. The COT report shows non-commercial traders reducing long positions, with a net change of -12,863 contracts.
Despite the dip, GBP/JPY remains bullish, and 194.6 could offer a discount entry. Traders should monitor M5 and M15 for long entries. A breakout above 196.4 could target 198.25.
>>> Trade GBP/JPY at FenzoFx.
USDJPY Analysis: MMC Resistance vs Major BOS (Technical View)🔍 Chart Summary:
The USDJPY pair is currently trading around 144.58, showing strong signs of structural buildup as it approaches a critical inflection point. This analysis leverages MMC (Market Mapping Concept) and price action structure to identify two possible directional outcomes — each grounded in key technical levels.
🧠 Key Technical Highlights:
📌 1. Expanding Wedge Pattern:
Price previously formed an expanding structure, signaling volatility and accumulation.
Expansion typically precedes major directional breakouts — either trend continuation or reversal.
📌 2. Downtrend Break Test:
A long-standing descending trendline has now been tested multiple times.
A confirmed breakout would be significant, indicating a major shift in market momentum.
📌 3. Resistance Zones:
Minor Resistance Zone around 158.00–160.00 marks a key supply area.
Watch for price action behavior if this level is tested — possible rejection or breakout continuation.
📌 4. Major Support Zone:
Support near 139.00–140.00, where price previously bounced, represents a solid floor and demand zone.
📌 5. BOS (Break of Structure):
Two BOS levels are marked:
Minor BOS (Around 146.00): Immediate reaction level to watch.
Major BOS (Around 149.00–150.00): If broken, could lead to sharp bullish continuation.
🔮 MMC Forecast Scenarios:
✅ Condition 1: Bullish Breakout Scenario
Price breaks above the descending trendline and clears the Minor BOS.
Target zone: 158.00–160.00 resistance.
Structure confirms bullish dominance if Major BOS is cleanly broken and retested.
⚠️ Condition 2: Bearish Rejection Scenario
Price rejects from current trendline or Minor BOS and reverses.
Potential drop toward Major Support around 140.00.
Watch for reversal confirmation with bearish engulfing candles or re-entry into expanding zone.
🧭 MMC Outlook Summary:
The chart is setting up for a key decision point. The market will either validate a bullish breakout structure or revert back into bearish continuation. These scenarios align with the MMC mapping method, providing clear conditions for traders to follow without bias.
