Nightly $SPY / $SPX Scenarios for July 30, 2025🔮 Nightly AMEX:SPY / SP:SPX Scenarios for July 30, 2025 🔮
🌍 Market‑Moving News 🌍
🧭 Fed Holds Steady Amid Uncertainty
As the FOMC enters its July 29–30 meeting, the Fed is expected to keep rates unchanged at 4.25%–4.50%, even as one or two governors may dissent in favor of rate cuts amid mixed economic data. Recent strength in consumer spending contrasts with weakness in housing and construction.
🌐 U.S.–China Trade Talks Resumed in Stockholm
Talks are under way aimed at extending the tariff truce before the August 12 deadline. Both sides described progress as constructive, though analysts remain cautious on the timeline and potential outcomes.
🛢️ Oil Up / Dollar Firmer, But Risks Remain
Brent crude hit ~$72.50/barrel (+3.5%) while WTI rose to ~$69.20 on a mix of geopolitical tension (possible new Russia tariffs) and trade optimism. The U.S. dollar edged higher following the U.S.–EU trade agreement.
📈 IMF Revises Up Global Growth—but Flags Tariff Risks
The IMF raised its 2025 growth forecast to 3.0% and maintained 3.1% for 2026, citing pre-emptive consumer demand—but warned that ongoing U.S. tariffs and policy inconsistency could dampen momentum.
📊 Key Data Releases & Events 📊
📅 Wednesday, July 30:
FOMC Rate Decision & Powell Press Conference
The Fed is expected to hold interest rates steady. Powell’s remarks will be closely watched for signals on the timing of future cuts and views on inflation and labor markets.
Advance Q2 U.S. GDP Estimate
The first look at Q2 growth is expected around +1.9% YoY, potentially validating a rebound after Q1’s contraction.
June PCE & Core PCE (Personal Consumption Expenditures Index)
The Fed's preferred inflation gauge. Markets will monitor if core inflation remains elevated, which may reinforce policy caution.
⚠️ Disclaimer:
This summary is for educational and informational purposes only—it is not financial advice. Always consult a licensed financial advisor before making investment decisions.
📌 #trading #stockmarket #economy #Fed #GDP #inflation #trade #tariffs #markets
Technical Analysis

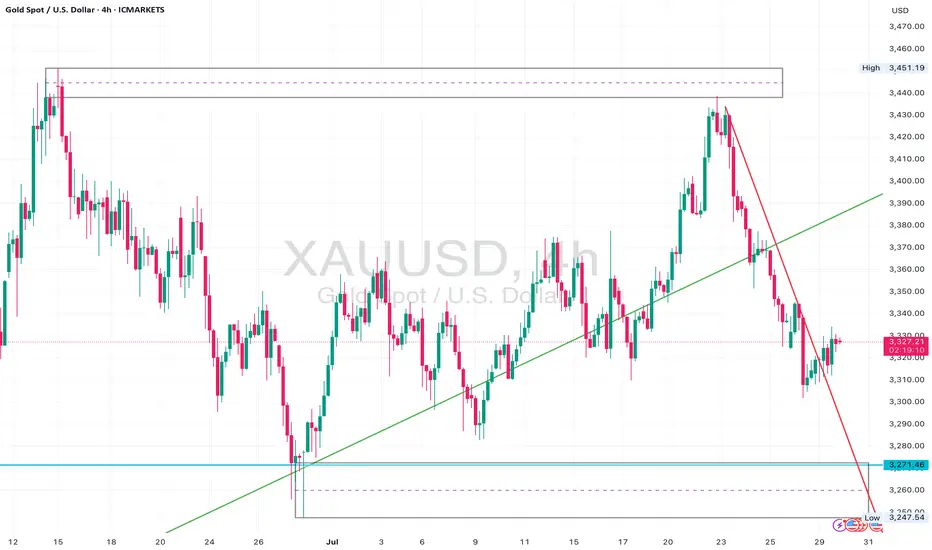
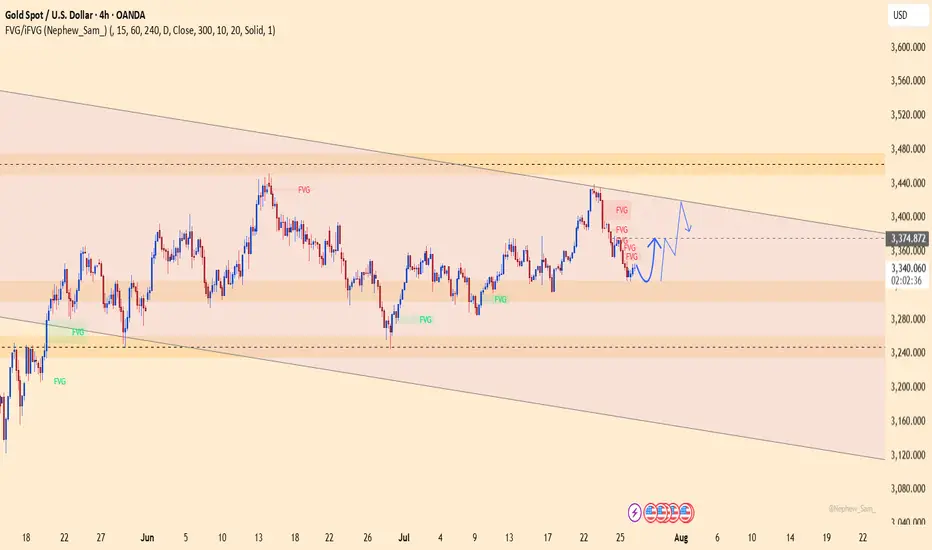
Gold Bear Flag Forming After Trendline Break – Short Setup BelowGold (XAUUSD) recently broke a major ascending trendline that had held since late June, leading to an aggressive sell-off from the $3,440s down to the $3,270 zone.
Following that, price is now consolidating just beneath the previous support trendline, forming what appears to be a bear flag or rising channel inside a corrective structure.
The $3,330–$3,340 zone is now acting as resistance, and price is struggling to close above this level.
The current structure suggests continuation to the downside, with clean space to revisit the $3,271 liquidity pool and potentially even sweep that low.
Watch for bearish confirmation below the current flag – especially if price prints a rejection wick or engulfing candle at the upper edge of the box.
⸻
Key Levels:
• Resistance: $3,330 – $3,340 (flag top + previous support turned resistance)
• Support: $3,271 zone, followed by $3,248 sweep potential
⸻
Trigger Criteria:
• Bearish rejection inside the flag (e.g. pin bar or engulfing)
• Break and retest of the flag bottom or horizontal support
⸻
Risk Note:
A clean break back above $3,350 and reclaim of the previous trendline would invalidate this idea short term and shift bias back to neutral/bullish.
USD/JPY Chart Analysis (Educational Breakdown)📊USD/JPY Chart Analysis (Educational Breakdown)
🗓 Date: July 28, 2025
⏰ Timeframe: 2H (2-Hour Candles)
🧠 Concepts: Liquidity | Fair Value Gap | Order Block | Structure | Support/Resistance
⸻
1. Market Structure Overview
• The pair has been bullish, making higher highs and higher lows.
• Recently, price tapped into a resistance zone (~148.40–149.00) and sharply rejected, suggesting a potential short-term reversal.
• The price may now aim to sweep liquidity below support before a possible rebound.
⸻
2. Key Levels
🟥 Resistance Zone (148.50–149.00)
• Marked by a previous supply zone where sellers stepped in aggressively.
• Current Bearish Order Block sits just below this resistance, confirming institutional interest in selling this level.
🟫 Bearish Order Block
• Last bullish candle before sharp drop acts as a bearish order block (around 148.30–148.50).
• This is a high-probability sell-side reaction area — ideal for liquidity grabs and reversals.
🟦 Fair Value Gap (FVG)
• Between mid-17th–18th July, an imbalance was left after strong bullish momentum.
• Price returned to this zone, partially filled the gap, and then dropped again — confirming its importance.
🟥 Support Zone (145.80–146.30)
• Long-standing demand area where buyers previously stepped in.
• This area aligns closely with sell-side liquidity (SSL).
⸻
3. Liquidity Zones
🔵 Buy-Side Liquidity (BSL) – Above resistance (149.00+)
• Stop-loss clusters above previous swing highs.
• Liquidity for institutional sell positions.
🟣 Sell-Side Liquidity (SSL) – Below 146.00
• Positioned right under support.
• Ideal liquidity target for smart money to trigger stop hunts and fill positions before reversing.

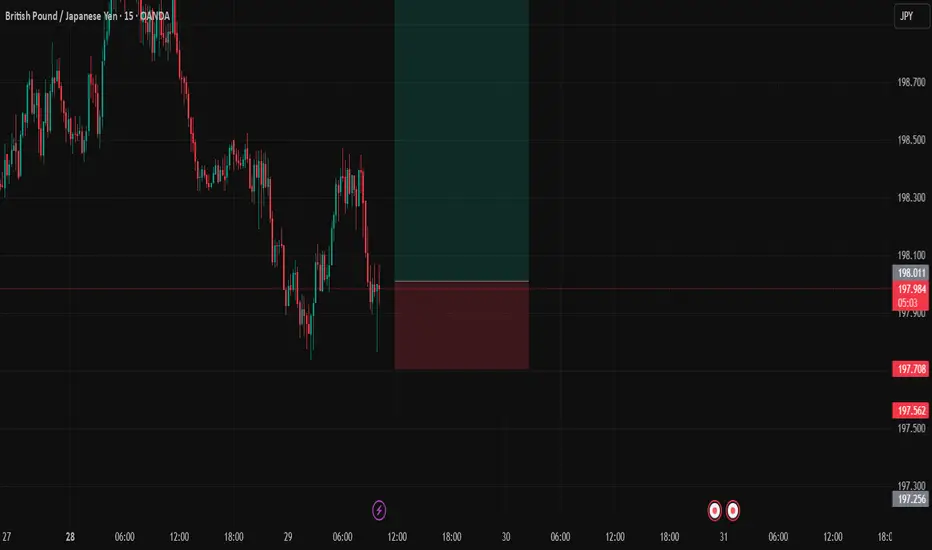
GBPJPYDate:
July 29,2025
Session:
London and New York Session
Pair:
GBPJPY
Bias:
Long
Yesterdays liquid untouched still lies. Expecting price to fill that area either by end of NY session or Asia.
Entry: 198.018
Stop Loss: 197.704
Target: 199.068
RR: 3.5
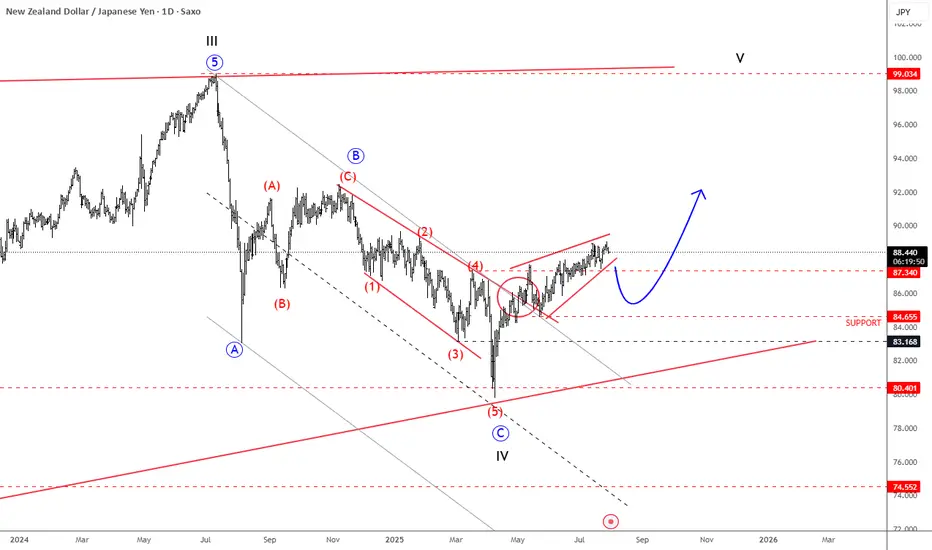
NZDJPY Is Back To Bullish ModeNZDJPY Is Back To Bullish Mode from technical and Elliott wave perspective, as we see it breaking back above trendline after a corrective decline.
NZDJPY is nicely recovering over the last few weeks after a strong rebound from 80.40 support, a key level going back to March 2023. Notice that it’s recovering after a three-wave ABC corrective decline that belongs to a higher degree wave IV correction. Current recovery looks to be in five waves, as a leading diagonal; so its a motive wave structure that already pushed above the 87.34 resistance, which is a strong bullish signal, suggesting more upside ahead. Of course, short-term pullbacks are always possible and welcome, and in that case, the 86 – 84 area could act as a nice support. But overall, we think that sooner or later the pair will target the 90 or even 92 levels, which are still possible this year. Wave V is eyeing even 100 area.
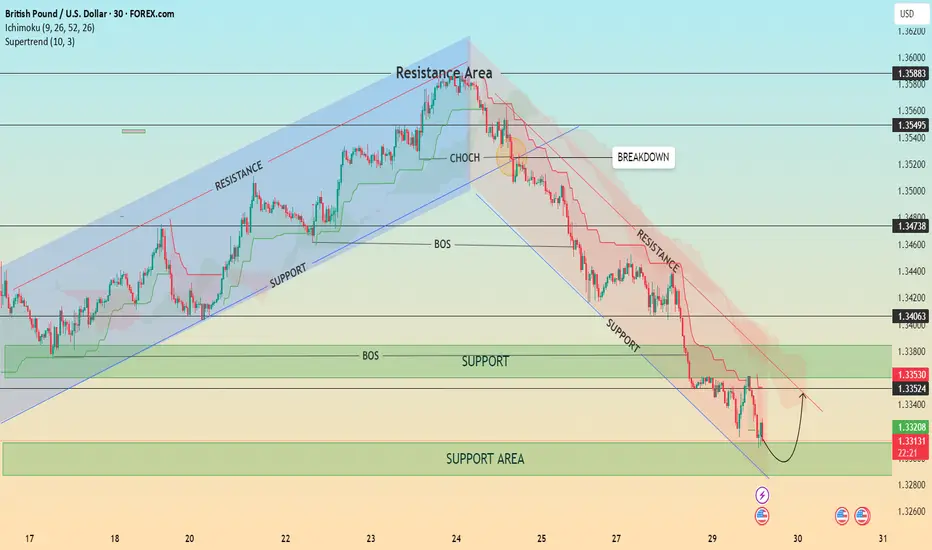
GBP/USD – Bearish Structure with Possible Short-Term Pullback📊 GBP/USD – Bearish Structure with Possible Short-Term Pullback
Timeframe: 30-Minute | Date: July 29, 2025
Price action recently broke down from a well-respected ascending channel, confirming a shift in market structure with a Change of Character (CHOCH) followed by a Break of Structure (BOS). Since then, GBP/USD has been respecting a descending trend channel, forming consistent lower highs and lower lows.
🔍 Current Setup:
Price is testing a major support area around 1.3300–1.3320.
A minor pullback is expected as indicated by the bullish wick rejections.
However, the overall bias remains bearish unless we break and hold above the 1.3353–1.3406 resistance zone and the descending trendline.
The Ichimoku Cloud and Supertrend both show bearish momentum.
📈 Potential Scenario:
Price may bounce from the support area and retest the upper boundary of the descending channel before resuming the bearish trend.
⚠️ Key Levels to Watch:
Resistance: 1.33530 / 1.34063 / 1.34738
Support: 1.33200 / 1.33000
💡 Structure Notes:
CHOCH = Trend Reversal Signal
BOS = Confirmation of Downtrend
Cloud = Dynamic Resistance
Multi-timeframe analysis, strong momentum, FOMC risk/reward plan__________________________________________________________________________________
Technical Overview – Summary Points
__________________________________________________________________________________
Strong momentum and bullish consensus confirmed across all timeframes.
Key support/resistance : 114k–116k (critical support), 123k (major pivot).
Healthy organic volume , no extreme peaks except isolated moments (30min/15min).
Risk On / Risk Off Indicator : Dominant bullish signal, neutral only on 15min.
Multi-timeframe structure : Perfect alignment daily/4H/2H/1H, caution on 15/30min (slight inflection but no abnormal divergence).
__________________________________________________________________________________
Strategic Summary
__________________________________________________________________________________
Global bias : Structural bull market, intact dynamic.
Opportunities : Tactical buys on pullbacks (114–116k), swing on breakout 123k.
Risk areas : Below 114k = risk of invalidation, targets 111k–105k.
Macro catalysts : FOMC imminent (high volatility expected), watch geopolitical tensions.
Action plan : Favor swing/cautious trading ahead of FOMC, dynamic stops, act on first post-Powell trigger.
__________________________________________________________________________________
Multi-Timeframe Analysis
__________________________________________________________________________________
1D : Active range 114k–123k; strong supports, momentum maintained; Risk On / Risk Off Indicator strongly bullish.
12H/6H/4H : Clean bullish structure, no excesses or divergence; price sits within major horizontal clusters.
2H/1H : Healthy impulse/correction phases; key intermediate supports 114.6k, 117.5k to watch.
30min/15min : Slightly weaker momentum but constructive microstructure, no immediate sell threat; localized volume spikes on support reactions.
ISPD DIV : No behavioral stress observed throughout.
Cross-timeframe summary : Bullish confluence dominant; caution on short-term reversals tied to FOMC and on-chain volatility spikes.
__________________________________________________________________________________
Multi-timeframe Cross Analysis & Decisional Rationale
__________________________________________________________________________________
As long as BTC > 114k = bullish bias, buying pullbacks, swing target 123k.
Active management post-FOMC strongly advised (enter/reduce after first H4 close).
Increased volatility risk in case of Fed/geopolitical shock; mandatory stops.
Sector momentum (Risk On / Risk Off Indicator) and volume underpin the bullish case unless exogenous alert.
Invalidation below 114k = prudent, neutral, or tactical shorts towards 111k–105k.
__________________________________________________________________________________
Macro, On-chain & Economic Calendar
__________________________________________________________________________________
FOMC July 29th : pivotal event, any surprise = strong intraday move (BTC sensitive to Powell speech).
US Macro: strong fundamentals but caution on trade war, inflation "contained."
On-chain : realized cap BTC >$1T, high open interest in derivatives = leveraged risk, beware speculative altcoin excess.
Global risk : market remains buyer until bearish Fed/geopolitical shock; swing trading favored, tight stops recommended.
__________________________________________________________________________________
Action plan
__________________________________________________________________________________
Favor buying/reloading on pullbacks to 114.6k–116k (stop <114k).
Break above 123k = bull confirmation, further extension likely to 126–128k depending on FOMC outcome.
Prioritize strict risk management; monitor liquidity/supports on macro/on-chain volatility peaks.
__________________________________________________________________________________

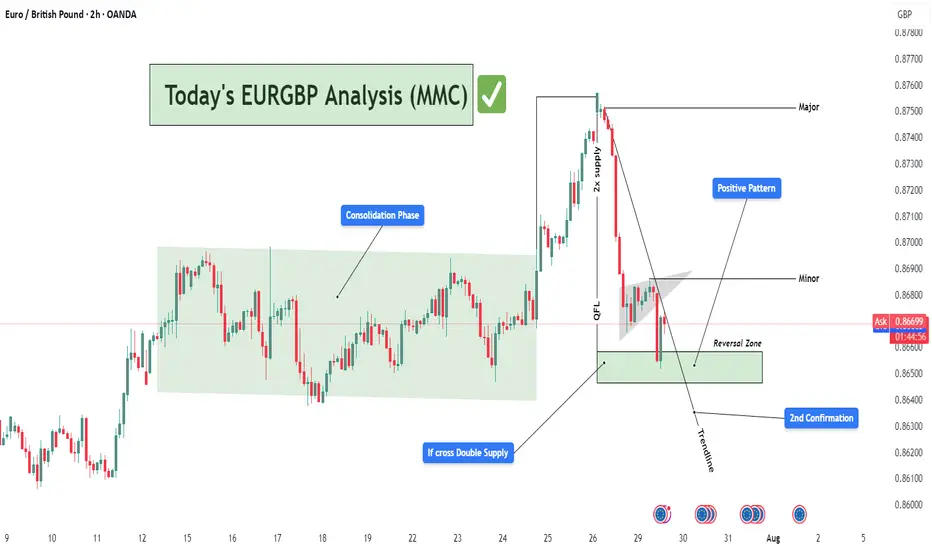
EURGBP Bullish Reversal Setup from Demand Zone (MMC Strategy)📊 Detailed Technical Analysis:
The EURGBP pair on the 2-hour chart is currently at a critical technical juncture, showing signs of a potential bullish reversal. This analysis follows Market Maker Concepts (MMC), which combines liquidity engineering, smart money movements, and structure shifts. Let’s break it down:
🔄 1. Consolidation Phase – Accumulation in Action (Smart Money Footprint)
Between July 15 to 24, the price moved within a tight range — classic consolidation behavior.
This phase suggests accumulation by institutional players, quietly building long positions while trapping retail shorts and longs.
This kind of sideways structure typically precedes a high-volume breakout, which happened right after.
📌 Lesson: Consolidation is often the calm before the storm — prepare for a breakout when this phase completes.
🚀 2. Breakout with QFL Pattern – Aggressive Bullish Shift
The price broke above the consolidation range and surged strongly.
This breakout followed a classic QFL (Quick Flip Level) structure — where price forms a base, drops temporarily, and then explodes upward.
The area of breakout aligns with a “2x Supply” zone — meaning this zone acted as a magnet for stop orders, and once breached, added more fuel to the rally.
📌 Why QFL Matters: It marks a shift in market sentiment — from balanced to strongly biased, in this case toward bulls.
📉 3. Pullback Phase – Structural Correction Begins
After reaching a high near 0.87500 (major resistance), price began to pull back sharply.
It formed a minor descending flag/channel, a classic corrective pattern, often a pause before resuming the larger trend.
A descending trendline has been drawn to capture this pullback structure.
📌 Important: Pullbacks are healthy — they allow for re-entries and provide better R:R setups.
📍 4. Reversal Zone – Key Demand Revisited
Price now sits within a Reversal Zone (Demand Area), marked in green on the chart.
This level previously served as the base for the breakout and aligns with institutional buying interest.
The area acts as a high-probability buy zone, supported by:
Trendline support
Price rejecting lower levels
Historical reaction at this zone
📌 Why It’s Crucial: If price respects this demand zone, it confirms bullish intent and creates a low-risk buying opportunity.
✅ 5. 2nd Confirmation – Price Action Support
The chart marks a "2nd Confirmation" label at a slightly lower level — this is a final support level, a safety net.
If price dips and bounces here again, it confirms buyer strength.
Strong price reaction at this level would validate a trend continuation setup back toward highs.
💹 6. Positive Pattern – Early Reversal Signs
Inside the demand zone, a bullish structure is forming.
This could be an inverted head & shoulders, or a double bottom pattern.
These patterns often act as launch pads for upward moves, especially when combined with institutional demand.
📌 MMC Insight: Market Makers engineer dips to induce panic, only to reverse aggressively once liquidity is absorbed.
🎯 Trade Plan Based on the Analysis:
Buy Zone: Between 0.86450 – 0.86700 (Reversal Zone)
Stop-Loss: Below 0.86250 (beneath 2nd confirmation)
Take Profits:
🎯 TP1: 0.86900 (Minor resistance)
🎯 TP2: 0.87500 (Major swing high)
Risk-to-Reward: 1:2 or higher depending on entry timing
🧠 MMC Strategy Summary for Minds:
This EURGBP 2H chart is a textbook example of MMC-based trading. We saw:
Institutional accumulation (consolidation phase)
QFL breakout (confirmation of bullish intent)
Return to demand (market maker’s discount area)
Early bullish signals (positive price action patterns)
Multiple confluences at the Reversal Zone (trendline, demand, confirmation zone)
Such a combination offers a high-probability swing trade setup. Patient traders can wait for the structure to break upward and join the trend with tight risk and clear targets.
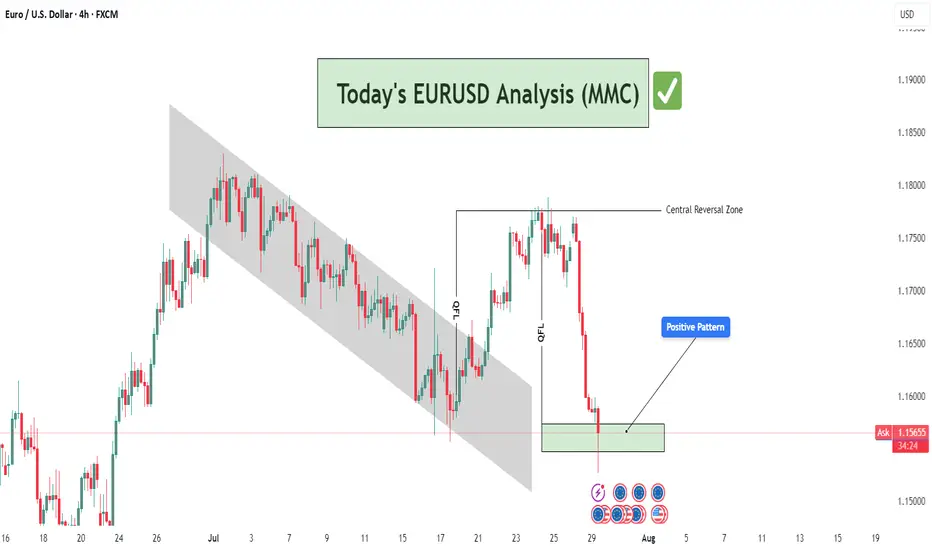
EURUSD Analysis : Rejection at Demand – Institutional Buy Setup🔍 Technical Storyline – What the Chart Tells Us:
🔸 1. Previous Bearish Structure – Descending Channel:
Price has been moving within a well-respected bearish channel, signifying structured sell-side liquidity control.
This channel served as a trap zone, where retail sellers were induced while institutions accumulated buy-side positions below the range.
The controlled movement inside the channel ended with a breakout to the upside, signaling a disruption in bearish control.
🔸 2. QFL Zone Formation – Manipulation & Liquidity Grab:
QFL (Quasimodo Failure Level) is evident in two phases here:
The first QFL acts as a reaction point where the market dropped to test demand and rallied aggressively.
The second QFL near the highs shows price swept previous liquidity before dumping, hinting at institutional profit-taking and possible redistribution into discount areas.
🔸 3. Central Reversal Zone (CRZ):
Price reversed sharply from this CRZ, which acted as a major supply level. The CRZ marks the top of the manipulation range.
This was a liquidity sweep targeting trapped long positions that entered too late at the highs.
🔸 4. Demand Revisit + Positive Rejection Pattern (Current Phase):
Price has now reached the MMC-validated demand zone, which previously launched a strong bullish move.
The long lower wick in the latest candle shows buyer absorption, suggesting early signs of a Positive Reversal Pattern.
This area is marked with high probability for bullish continuation, as it aligns with both technical support and smart money logic.
💡 Trading Plan & Market Mindset:
🔸 📈 Bullish Scenario (High-Probability Play):
Wait for bullish confirmation, such as:
Bullish engulfing on 1H/4H
Break of minor intraday structure (e.g., break of internal LH)
Strong volume surge from the zone
Entry zone: Within the demand block – 1.15500 to 1.15750
Stop-loss: Just below the demand zone (1.15250)
Target 1 (TP1): 1.16500 – minor intraday resistance
Target 2 (TP2): 1.17500–1.18000 – retest of QFL high and Central Reversal Zone
🔸 ❌ Bearish Invalidator:
A 4H candle close below 1.15250 would break the demand zone structure.
Invalidation of MMC reversal – move toward deeper liquidity (1.14500–1.14800)
🧠 Trader’s Psychology & Institutional Mindset:
Institutions often induce price spikes to trap both buyers and sellers.
This entire structure reflects classic accumulation → manipulation → distribution → reaccumulation.
The retest of the original demand zone allows institutions to re-enter at discount before pushing price back toward the highs.
“In MMC, patterns are not just shapes – they are footprints of institutional intent.”
GOLD: Bottoming Out or Just the Calm Before the Storm? – GOLD: Bottoming Out or Just the Calm Before the Storm?
Gold has dropped nearly $50 over the last 4 sessions, showing clear bearish momentum. But is this just a liquidity grab before a reversal — or are we simply pausing before another leg down?
🔍 Market Context:
Recent US–EU defence and trade agreements may have weakened gold’s short-term appeal as a safe haven.
The US dollar and equities have both gained on strong macroeconomic data, redirecting capital flows away from metals.
Overall market sentiment has tilted risk-on, putting additional pressure on gold prices.
📊 Technical Overview (12H Chart):
Price has broken below the 3342 key support zone and rejected the retest — turning it into short-term resistance.
Current range sits between:
Sell-side liquidity zone: 3301–3292
Major demand/FVG zone: 3272–3270
Above price:
Resistance at 3342, and a broader sell zone at 3370–3388 (OB + FVG + Fib 0.5–0.618)
🔧 Trade Plan (Reaction-Based — Not Predictive):
🟢 Scenario 1 – Buy (Scalp Reaction)
Entry: 3292 – 3290
Stop Loss: 3285
Targets: 3296 → 3300 → 3305 → 3310 → 3315 → 3320 → 3325 → 3330
📍 Intraday bounce play from a high-liquidity zone
🟢 Scenario 2 – Buy (Deeper Reversal Swing)
Entry: 3272 – 3270
Stop Loss: 3265
Targets: 3276 → 3280 → 3284 → 3288 → 3292 → 3294 → 3300 → Trail
📍 Potential mid-term bottom setup if liquidity is fully swept
🔴 Scenario 3 – Sell (Short-Term Rejection)
Entry: 3340 – 3342
Stop Loss: 3346
Targets: 3335 → 3330 → 3325 → 3320 → 3310
📍 Clean rejection setup if price fails to reclaim key resistance
🔴 Scenario 4 – Sell (Higher Supply Zone)
Entry: 3370 – 3372
Stop Loss: 3376
Targets: 3365 → 3360 → 3355 → 3350 → 3345 → 3340 → 3330 → 3320
⚠️ Higher risk; only valid with strong confirmation
⚠️ Risk Notes:
Be mindful of fakeouts around London and NY opens, as liquidity sweeps are common.
Wait for price to enter your zone, then react — don’t anticipate.
Strict risk management is key in a volatile environment like this.
🧭 I’ll continue monitoring how price reacts around these zones.
If this kind of structured planning resonates with your approach,
feel free to stay connected — or share your perspective in the comments.

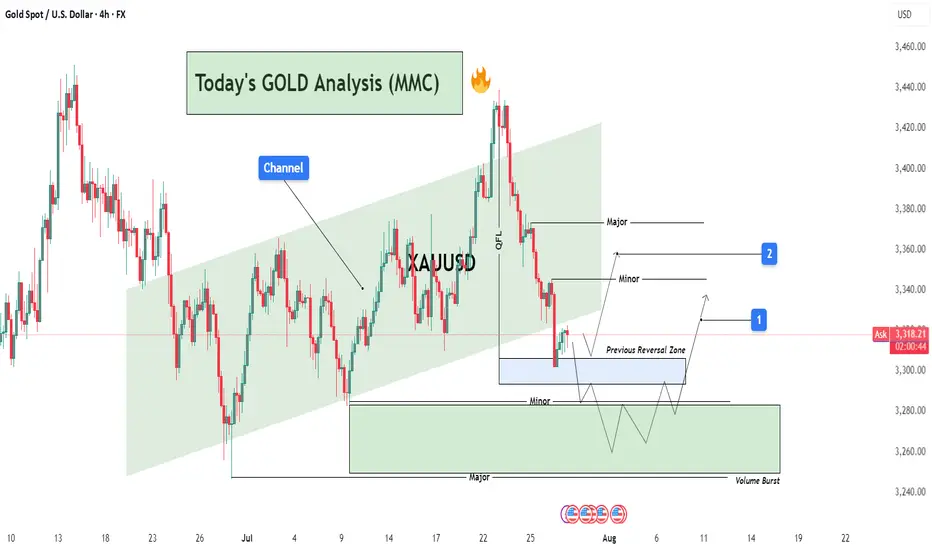
GOLD Analysis : XAUUSD Major Bullish Demand Zone🧠 Market Structure Context (MMC Framework)
Gold has recently shown a clean structural decline from its local highs within a well-defined ascending channel. This analysis highlights a reaction zone-based playbook, focusing on high-probability reversal scenarios guided by institutional footprints, volume reaction points, and MMC logic.
We’re currently trading near a previous reversal zone, where history tells us the market tends to shift behavior. Let’s dissect the key components.
📊 Key Technical Components
🔸 1. Ascending Channel Breakdown
The entire uptrend was respecting a well-established bullish channel until the recent drop violated the midline structure. This breakdown confirms a temporary bearish phase, with price breaking cleanly below a QFL base (Quick Flip Level)—a level where price reversed sharply before, which now acts as a major supply zone.
Psychological Insight: Channels give clues about momentum. Breaking below the lower band shows the market is preparing for a retest or a deeper liquidity hunt.
QFL Breakdown: Once broken, previous buyer confidence is shaken—inviting sellers to test demand zones.
🔸 2. Previous Reversal Zone (PRZ) Reaction
Currently, price is hovering inside the blue shaded Previous Reversal Zone, where bullish pressure previously kicked in. It’s a minor demand zone, but critical due to historical reaction. The projected structure shows a bounce from this area before deciding next direction.
MMC Insight: The first test of PRZ often leads to an initial reaction. But deeper liquidity lies just below in the major green demand zone.
🔸 3. Major Demand Zone + Volume Burst Area (The Real Magnet)
Below the PRZ lies the major reversal block—highlighted in green. This zone is significant because:
It aligns with a high-volume burst in the past, confirming institutional orders.
It's a cleaner structure level for smart money re-entry.
It also provides room for the “liquidity sweep” (stop hunt), collecting sell stops before a proper reversal.
💡 Expected Play: Price may fake out below PRZ, enter the major demand, and then initiate a multiple-leg bullish rally. Patience is key here.
🛠️ Trade Structure Outlook
✅ Scenario 1 – Aggressive Buyers (Marked "1"):
Buy from the current PRZ zone around $3,305–$3,315
Target: $3,340 (Minor Resistance)
Risk: Slippage into deeper demand zone
Stop-loss: Below $3,295
✅ Scenario 2 – Safer Entry from Major Demand (Marked "2"):
Let price dip into $3,270–$3,280 zone (green box)
Look for reversal candles or liquidity sweeps on lower timeframes
TP1: $3,330
TP2: $3,365 (Major Resistance)
📈 Resistance Levels to Watch:
Minor Resistance: $3,340 – Expect short-term pullbacks or hesitation.
Major Resistance: $3,365 – Key target for swing traders and potential reversal zone.
🔍 MMC Concepts in Action
✅ Channel Logic: Breakdown implies momentum shift—watch for retests.
✅ QFL: Previous bounce zone broken = supply now overhead.
✅ Volume Burst Zone: Strong historical reaction = institutional interest.
✅ Zone-to-Zone Trading: Instead of random entries, focus on logical zone interactions.
🧭 Conclusion – Path of Probability
Gold is currently in a transitional phase—shifting from bearish correction to potential bullish revival. Patience will reward those who wait for PRZ rejections or deeper liquidity taps. The MMC framework helps frame this market not as chaos, but a map of strategic reaction points.
BTCUSD Analysis (MMC) – Breakout Confirmed + Target Next Zone⚙️ Chart Context (4H BTC/USD)
As part of our Mirror Market Concepts (MMC) strategy, today's BTCUSD 4H chart is a textbook representation of market structure shift, SR interchange, demand reaction, and target projection. After consolidating within a compressed range under a key descending structure, Bitcoin has successfully broken out of bearish control, signaling a fresh phase of bullish momentum.
🧩 Breakdown of Technical Structure
🔹 1. Demand Zone Reaction (July 13–14)
The initial impulse move originated from a well-defined demand zone, marked by a strong accumulation and breakout. This zone—highlighted on the chart—acted as the institutional demand base, where buyers stepped in with volume and aggression. Price respected this zone precisely, confirming it as a valid MMC "Power Base."
Why this matters: Demand zones like these reflect institutional footprints. Once price reacts from such zones, they often become foundational for future bullish legs.
🔹 2. SR Interchange Zone – Structure Flip Confirmed
The descending green channel acted as dynamic resistance for several sessions. Every touch along this zone resulted in a lower high, confirming bearish order flow. However, BTC has now closed decisively above this structure, transforming this zone from supply to support—this is our classic SR Interchange concept in MMC.
Interpretation: This structure flip implies a strong change in sentiment. What was once a zone of rejection now becomes a potential support for continuation.
Expect retests of this zone before price resumes to higher reversal levels.
🔹 3. Minor and Major Resistance Zones
Above current price, two critical zones have been mapped:
Minor Resistance (~$120,000):
Acts as the first liquidity grab area. This is where early sellers may place stops or where short-term traders could book profits. MMC logic expects minor resistance to either cause a pause or a fakeout to lure in shorts.
Major Resistance / Central Reversal Zone (CRZ):
Spanning roughly $121,000 to $121,800, this is a key zone where price will likely meet decision-making. This CRZ is derived from previous structure congestion, imbalance fills, and projected Fibonacci confluence.
Next Reversal Zone (Final Target Area):
Located near $123,000, this is the outer reversal box where the bullish wave may either end, consolidate, or reverse entirely. This is the final target for swing traders or MMC practitioners looking for exhaustion.
🧭 Price Forecast Structure – Predictive Pathway
The forecast path shown on the chart illustrates a stair-step rally, with bullish impulses followed by shallow pullbacks:
First, price may pull back slightly to retest the breakout zone (green SR area).
Then a leg upward to minor resistance (~$120K).
A healthy rejection or small correction before breaking into the CRZ (~$121.2K).
Final move toward the outer reversal zone at ~$123K.
This fractal progression is a common MMC pattern seen during structure shifts—not impulsive straight-line rallies, but controlled, zone-to-zone movements.
🔍 Strategic Insights & Trade Plan
📌 Conservative Entry:
Wait for a retest of the breakout zone (SR Interchange) around $118,200–$118,500.
Look for bullish rejection candles or order flow confirmation on LTF (lower timeframes).
📌 Aggressive Entry:
Break and close above $120,000, confirming liquidity clearance and path toward CRZ.
🎯 Target Zones:
TP1: $121,200 – Central Reversal Zone
TP2: $123,000 – Outer Reversal Zone
❌ Stop-Loss Ideas:
Below $117,000 (structure invalidation)
Below recent bullish impulse candle low
🧠 MMC Concepts in Action:
SR Flip: Strong indication of market shift
Demand Rejection: Institutional footprint detected
Zone Mapping: Controlled zone-to-zone movement
Liquidity Logic: Price moves where orders rest – CRZ = likely reaction
Reversal Framing: Structure analysis ahead of time, not after the move
📊 Conclusion:
This BTCUSD 4H analysis showcases a strong MMC-style breakout scenario. The reaction from demand, shift in SR structure, and projected reversal zones give us a clean roadmap. As long as the structure remains valid and price respects the new SR zone, this bullish move remains high-probability.
Trade with structure. Trust the zones. Mirror the Market.

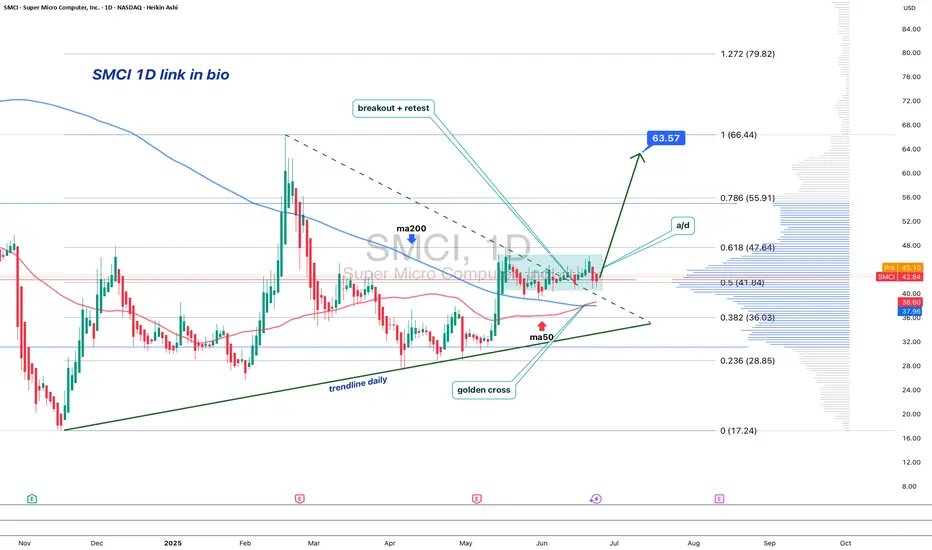
SMCI: When a chart says it’s time to reconnect with the AI hypeOn the daily chart, Super Micro Computer Inc. (SMCI) is showing a clean bullish setup. Price broke out of a descending trendline (green dashed), confirmed it with a retest, and is now consolidating above the breakout zone. The golden cross — where the MA50 crossed above the MA200 — confirms a long-term trend reversal.
Volume profile indicates strong accumulation near $41–43. The 0.5 Fibonacci level at $41.84 acted as support. Above the current range, there’s low volume resistance up to $63.57 (0.786), followed by $66.44 and a final extension target at $79.82 (1.272).
Fundamentals: SMCI is a leading server hardware manufacturer. Demand for their systems has soared with the explosion of AI infrastructure. The company maintains solid financials, with rising quarterly revenue and growing presence in the cloud sector. Institutional investors have been actively increasing their positions since late 2023 — a sign of strong long-term conviction.
Tactical plan:
— Entry: market $42–43
— Target 1: $55.91
— Target 2: $63.57
When technicals scream textbook breakout and fundamentals bring AI momentum to the table — it might just be one of the best late entries in the AI wave this summer.
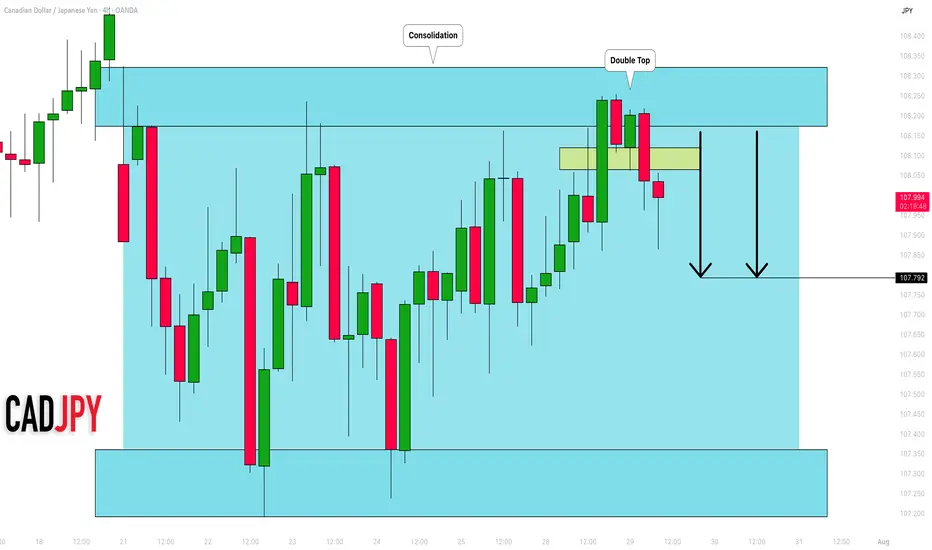
CADJPY: Consolidation Trading 🇨🇦🇯🇵
I expect a retracement from a resistance of a consolidation
range on CADJPY.
My confirmation is a double top pattern formation on that
on a 4H time frame.
Goal - 107.79
❤️Please, support my work with like, thank you!❤️
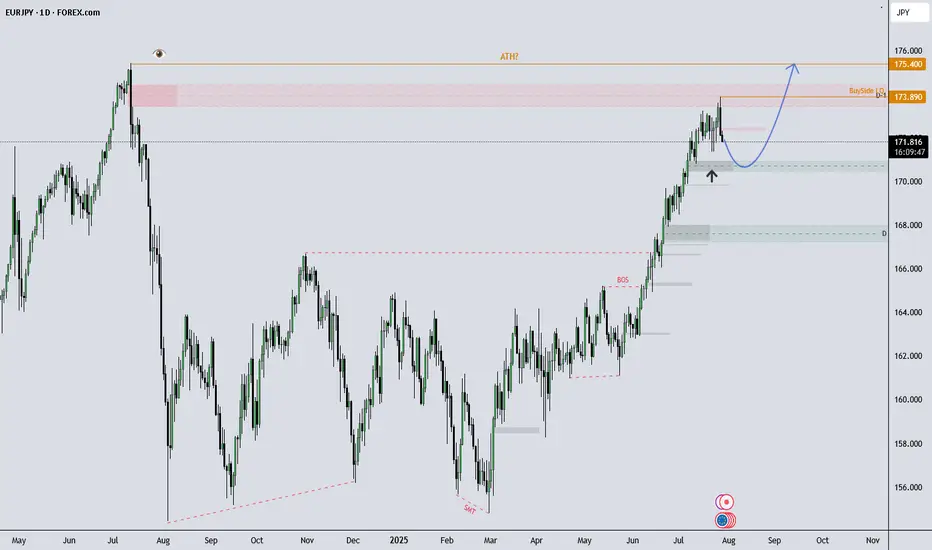
EURJPY Eyes New Highs After Pullback?What I see!
EURJPY Technical Outlook –
EURJPY remains in a strong uptrend and recently tapped into buy-side liquidity at 173.89, which now marks the All-Time High (ATH). After a brief rejection from that level, price is currently showing signs of a healthy pullback.
I’m observing the 170.00–171.00 zone, which aligns with previous demand. If price continues to respect this area, the overall bullish structure remains intact, with potential for a move back toward (and possibly beyond) the ATH.
A sustained break below 170.00 could indicate room for a deeper pullback, potentially toward the 168.00s, which would be a key area to monitor.
This analysis is shared for educational and discussion purposes only.
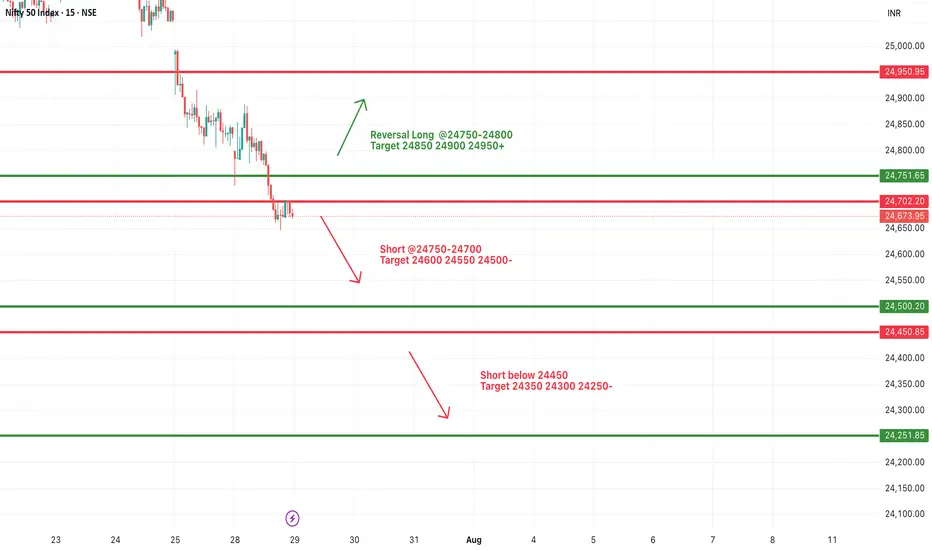
#NIFTY Intraday Support and Resistance Levels - 29/07/2025Nifty is expected to open with a gap-down today, continuing its bearish momentum seen in recent sessions. The index is now trading well below the key resistance zone of 24,750–24,800, with a visible weakness on the chart.
A short opportunity may arise if Nifty stays below the 24,750–24,700 zone. Any pullback toward this level may face selling pressure, and fresh shorts can be considered with downside targets of 24,600, 24,550, and 24,500-.
If the index breaks below the 24,450 level, the selling momentum may intensify, targeting 24,350, 24,300, and 24,250- levels intraday. This level marks a critical support, and traders should closely monitor price action here.
On the other hand, a reversal can only be expected if Nifty reclaims the 24,750–24,800 zone with strength. In that case, a bounce toward 24,850, 24,900, and 24,950+ is possible, but the reversal is only valid if strong bullish price action sustains above 24,800.
[INTRADAY] #BANKNIFTY PE & CE Levels(29/07/2025)Bank Nifty is expected to open with a gap-down, continuing its downside pressure from the previous sessions. The index is now hovering near an important support zone around 56,050–55,950.
If Bank Nifty sustains above the 56,050–56,100 zone after the gap-down open, a reversal rally can be seen with potential upside targets of 56,250, 56,350, and 56,450+. This zone may offer a low-risk long opportunity, provided price action confirms strength.
However, if Bank Nifty remains below 56,050 and especially breaches 55,950, fresh short positions can be initiated with downside targets of 55,750, 55,650, and 55,550-. A close below this support zone can accelerate the selling momentum further.
The market remains in a bearish tone unless a clear reversal structure forms above 56,050.

XAUUSD – Technical rebound, but downside risks remainOn the H4 chart, gold is bouncing slightly from the 3,323 support zone after a sharp drop. However, price remains within a large descending channel and is approaching a dense cluster of bearish FVGs around 3,360–3,374.
News context:
– US GDP and ADP data beat expectations, boosting the USD and adding pressure on gold.
– JOLTS dipped but remains above 7 million → limited support for gold.
– Thailand–Cambodia conflict provides only short-term impact.
Strategy: Favor SELL if price retests 3,360–3,374 and gets rejected. Downside targets: 3,323 or lower.
Main trend remains bearish, unless gold breaks above the descending channel.
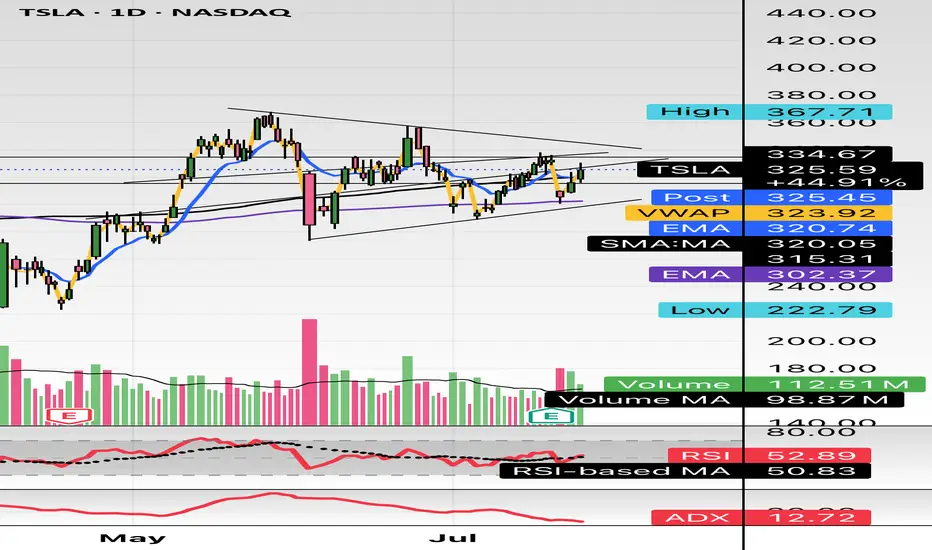
$TSLA either one big flag or massive short setting upHello,
Just some browsing, NASDAQ:TSLA hasn’t had any major moves prior to early May - June IMO. This is on my watch for a short swing setup. This is bull flagging but I see a short here. I’m conflicted. I do see the higher low but we are in a pitchfork and this has been consolidating in this $290-$340 area for about a month and half. There’s also a lower high. Just posting for some free dialogue and open ideas. Talk to me. Let me know what you see and think. We aren’t too far from 200EMA and 200SMA. It’s just curling above the 50 as well. Maybe we consolidate for another week or two? A massive move is brewing here I think. I’m talking $100 in a week up or down soon.
WSL
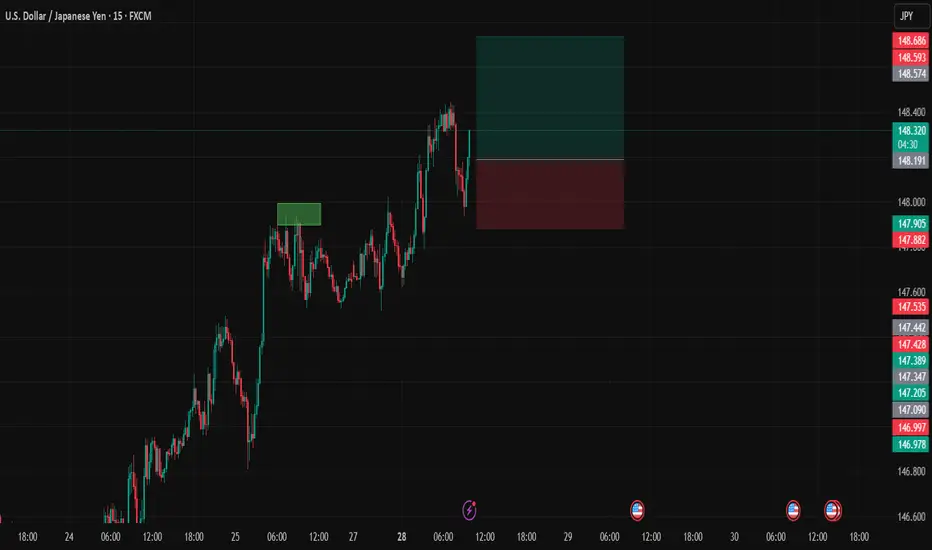
USDJPYDate:
July 28,2025
Session:
London and New York Session
Pair:
USDJPY
Bias:
Long
Looks like Sundays liquidity pool from last NYC open has been swept and it looks like price action wants to follow/continue its trend long.
Entry: 148.197
Stop Loss: 147.884
Target: 148.740
RR: 1.77
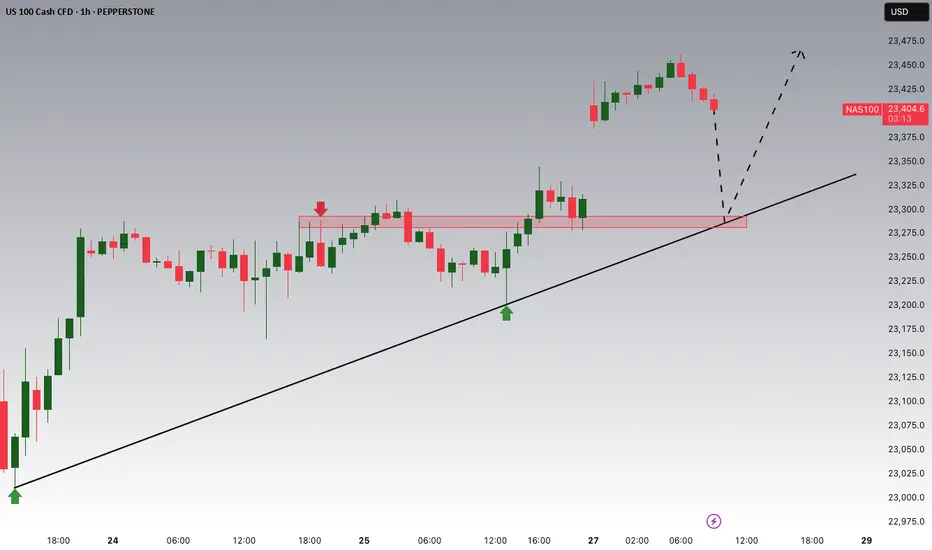
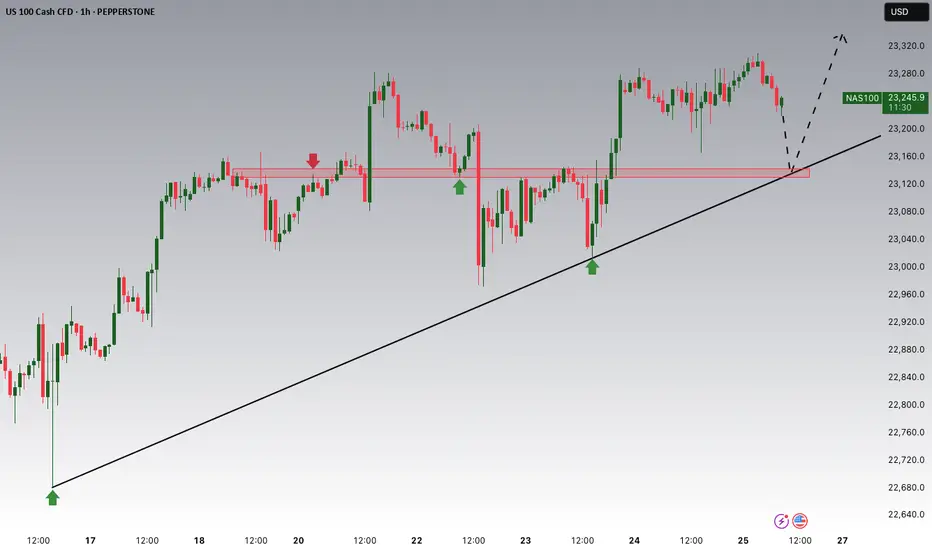
NASDAQ Potential UpsidesHey Traders, in today's trading session we are monitoring NAS100 for a buying opportunity around 23,140 zone, NASDAQ is trading in an uptrend and currently is in a correction phase in which it is approaching the trend 23,140 support and resistance area.
Trade safe, Joe.
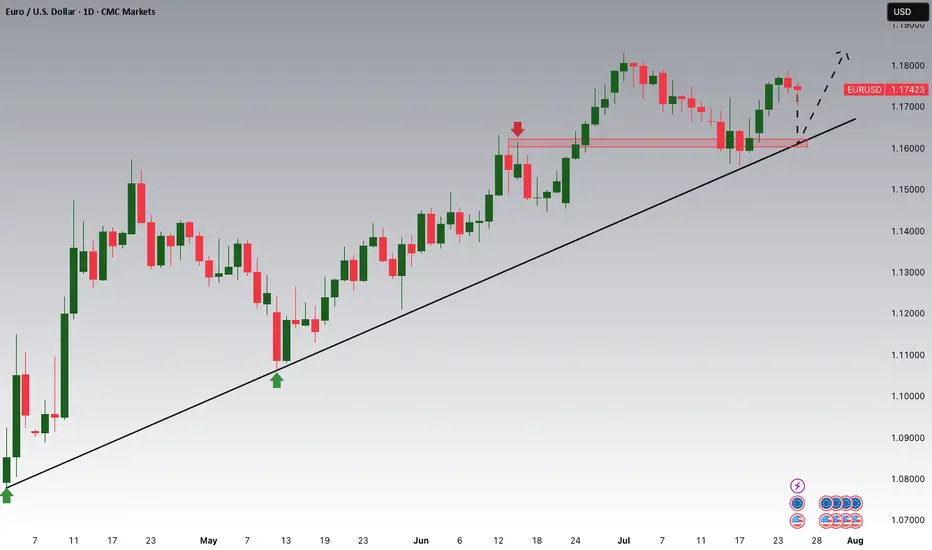
EURUSD Potential UpsidesHey Traders, in today's trading session we are monitoring EURUSD for a buying opportunity around 1.16 zone, EURUSD is trading in an uptrend and currently is in a correction phase in which it is approaching the trend at 1.16 support and resistance area.
Trade safe, Joe.
NASDAQ Potential UpsidesHey Traders, in today's trading session we are monitoring NAS100 for a buying opportunity around 23,300 zone, NASDAQ is trading in an uptrend and currently is in a correction phase in which it is approaching the trend at 23,300 support and resistance area.
Trade safe, Joe.